1Financial and accounting information
1.1.Review of the Group's business and consolidated results
1.1.1.Events of the financial year
1.1.1.1.Notable facts
ECONOMICAL CONTEXT LINKED TO COVID-19, SHORTAGE OF ELECTRONICS COMPONENTS AND MILITARY CONFLICT IN UKRAINE
In 2022, worldwide automotive production grew by 6.7% vs. 2021, from 77.2 million LVs in 2021 to 82.4 million LVs in 2022. It remains significantly below the 89 millions LVs recorded in 2019, before the Covid crisis. The first-half of the year was down 1.1% year-on-year, mostly impacted by Q1 (down 3.5% vs. Q1 2021) that recorded the outbreak of the war in Ukraine in February, while the second half was up 14.8%, mostly reflecting the very low base of comparison of Q3 2021.
It was penalized by Stop and Gos from OEMs consequent to supply chain disruptions due to the war in Ukraine, by the continued shortage of semiconductors and the Covid developments in China :
- ■China was strongly penalized by the Covid-related restrictions implemented in April and May (Q2 2022 automotive production in China was down 4.7% year-on-year) and then by the increase in Covid cases late 2022, after the decision to end the zero Covid policy (Q4 2022 automotive production in China was down 5.5% year-on-year);
- ■Europe was strongly impacted by Stop & Gos related to supply chain disruptions due to the war in Ukraine and the continuous shortage of semiconductors with H1 2022 automotive production in Europe down 11.3% year-on-year vs. H1 2021, of which -17.5% in Q1 2022;
- ■shortage of semiconductors for the automotive industry continued throughout the year and could gradually ease in 2023, while it is unlikely to resolve entirely before 2024;
- ■lastly, from a macroeconomic standpoint, 2022 has been characterized by additional challenges: high inflation has broadened out across countries, energy supply risks have pushed prices up and interest rates have risen to curb inflation.
As regards to the Group’s very limited activity in Russia (sales represented 0.4% of total consolidated sales in 2022 vs. 1.4% in 2021), due to the war in Ukraine, OEMs’ decisions regarding their operations in Russia and the uncertain and complex environment, Faurecia has decided to disengage from Russia and has depreciated related assets in 2022. The detailed accounting impacts are described in note 6. The group is not present in Ukraine.
1.1.1.2.Main events
January 2022
- ■ Faurecia has announced a partnership with BMW group to integrate the Faurecia Aptoide Automotive App Store in future vehicles. The App Store enable an innovative and seamlessly connected app offering in the new models of the world’s leading premium car and motorcycle manufacturer.
- ■On January 31, 2022, Faurecia announced the closing of the HELLA transaction, in line with the indicative timetable. Faurecia now owns a controlling stake exceeding 80% of the shares of HELLA and will consolidate HELLA in its financial accounts as from February 1, 2022. As a result of the transaction, the Hueck and Roepke Family pool received 13,571,385 newly issued shares of Faurecia, thus becoming Faurecia’s main shareholder with c. 9% of its share capital. The Family pool agreed to be subject to a first lock-up of its Faurecia shares during 18 months as from the closing date and a subsequent lock-up of 12 additional months for the portion of its Faurecia shares exceeding 5% of the Faurecia share capital.
March 2022
- ■Faurecia, selected to partner on the hydrogen fuel cell research project, “Bavarian fleet”, with MAN.
- Faurecia announced that the Company will equip a Bavarian fleet (Bayern flotte) of heavy-duty trucks provided by MAN with complete hydrogen storage systems, as part of a state-supported fuel cell research project.
- For this project, backed with about €7 million funding from Bavarian Ministry of Economic Affairs, Regional Development and Energy, Faurecia, part of group FORVIA, will develop and seek certification for a new size of tank perfectly adapted to meet the requirements of heavy-duty vehicles and other applications with intensive use cases.
April 2022
- ■The California Energy Commission (CEC) has selected Symbio, Michelin, Faurecia along with GTI and other industry partners, to develop and demonstrate a hydrogen-fueled, regional-haul Class 8 truck, as major contributors to a state-supported hydrogen mobility project.
- The “Symbio H2 Central Valley Express” project, will develop and demonstrate a hydrogen fuel cell truck that matches the performance of a 15-liter diesel truck providing a zero-emission solution for demanding regional-haul trucking operations. This hydrogen truck project strives to support California’s goal to achieve economy wide carbon neutrality by 2045.
- ■Faurecia has announced a worldwide long-term partnership with Mercedes-Benz group AG to integrate its apps platform, developed in partnership with Aptoide, into the MBUX multimedia system of one of the global suppliers of premium and luxury cars and vans.
- From 2023, the Company will provide a customized app portfolio refreshed multiple times per year to enhance user experience. The Faurecia Aptoide apps platform provides maximum security, privacy and control of content.
May 2022
- ■Faurecia, and Veolia have signed a Cooperation and Research Agreement to jointly develop innovative compounds for automotive interior modules, aiming to achieve an average of 30% of recycled content by 2025. Through this partnership, the two companies will accelerate the deployment of breakthrough sustainable interiors solutions implemented in instrument panels, door panels and center consoles in Europe. Veolia will start the production of these secondary raw materials at its existing recycling sites in France starting from 2023.
- In 2011, Faurecia was the first automotive supplier to introduce a complete range of bio-composite cockpit solutions with NAFILean®. More than a decade later and in around 13 million vehicles, these products' CO2 footprint is 28% lower than that of conventional all-plastic counterparts.
- ■ Faurecia has signed power purchase agreements (PPA) with ENGIE and EDP to equip over 150 sites in 22 countries with solar panels.
- This partnership is a major milestone in Faurecia’s roadmap to become CO2 neutral for its industrial operations (scopes 1 and 2) by 2025.
June 2022
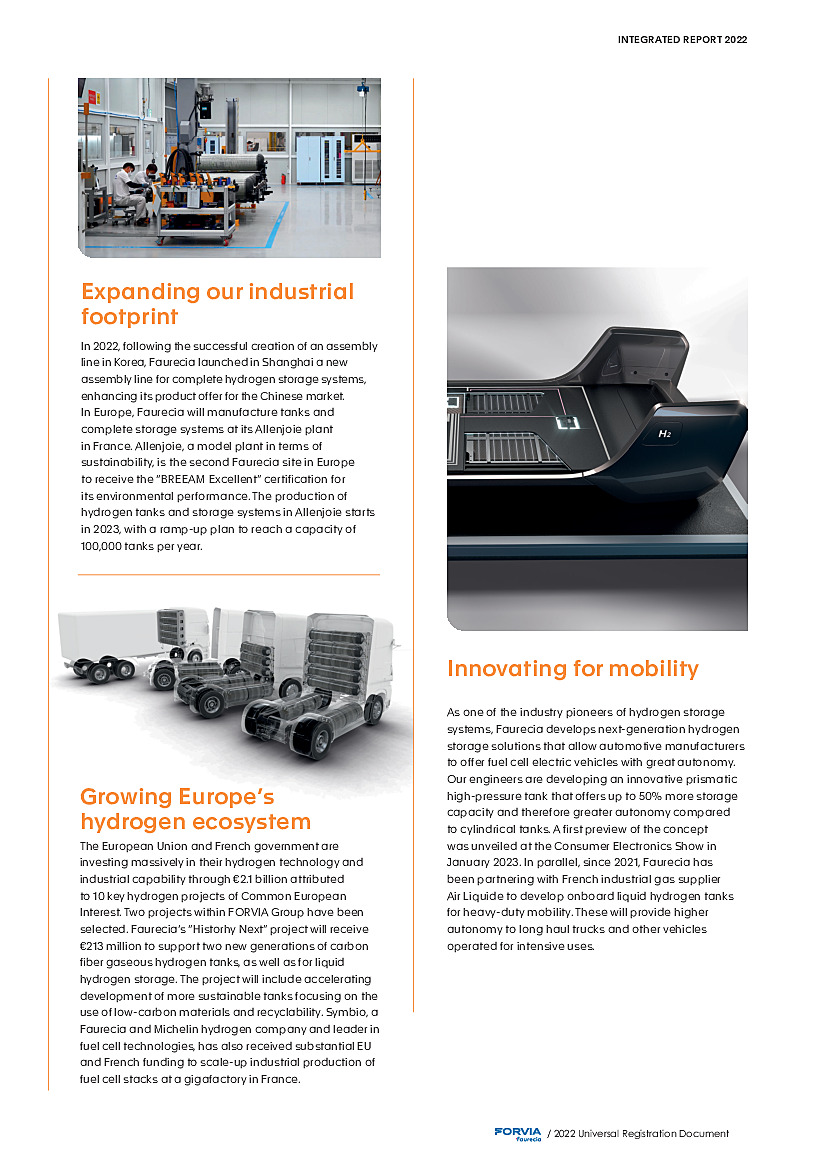
- ■Faurecia in collaboration with the company Air Flow has been awarded a contract to supply high-capacity hydrogen storage containers for refilling stations in the Zero Emission Valley (ZEV), a project involving HYmpulsion.
- The ZEV project aims to deploy, before the end of 2024, 1,200 fuel cell vehicles and 20 hydrogen stations, including several equipped with electrolyzers to produce hydrogen from renewable electricity without emitting CO2.
- ■FORVIA, has announced that its joint CO2 neutrality roadmap was validated by the Science Based Target initiative (SBTi) on June 6, 2022. Together, Faurecia and HELLA will reach net zero emissions by 2045 – an objective corresponding to the most ambitious standard of SBTi. Only twenty companies worldwide have had their net zero commitments approved so far.
July 2022
- ■HELLA has agreed the sale of its 33.33% stake in HBPO to its co-shareholder, Plastic Omnium for €290 million.
- ■Faurecia has signed a €315 million loan with the European Investment Bank (EIB). The €315 million transaction is a bullet loan with a maturity of seven years.
- This loan allows Faurecia to enhance its liquidity profile by extending its debt maturity at an attractive financing cost.
September 2022
- ■Faurecia has been integrated into the Euronext CAC 40 ESG® index that comprises the 40 companies within the CAC® Large 60 index that demonstrate the best Environmental, Social and Governance (ESG) practices.
- ■FORVIA exhibited at this year’s IAA Transportation in Hanover, for the first time with its two brands Faurecia and HELLA. Located in Hall 12 Booth B27 & 31, FORVIA will showcase the combined expertise of both companies in the fields of lighting and electronics as well as clean and sustainable mobility.
- ■Faurecia, has announced a $210 million loan with Latin America banks. This transaction is part of the program to finance HELLA acquisition. The $210 million transaction is structured into two tranches in USD and MXN, with a 2028 maturity. Margin above reference rates is close to 3.35% on average which represents an attractive financing cost in the current environment.
October 2022
- ■The zero emissions mobility activities of Faurecia, are selected as being of common European interest. Faurecia and Symbio are among the 10 projects supported by the French government in IPCEI (Important Project of Common European Interest). €2.1 billion are provided to support those 10 projects to accelerate the hydrogen industry in France.
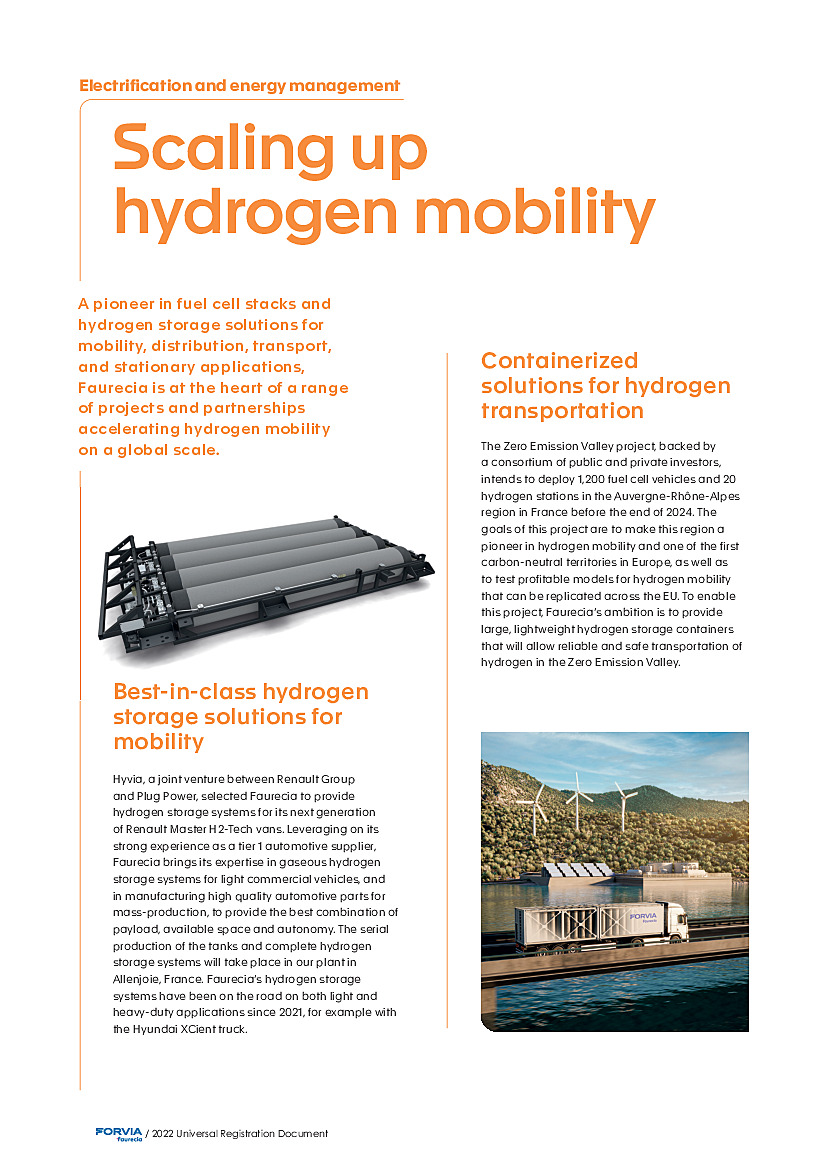
- ■Faurecia, has been awarded by HYVIA, a joint venture between Renault Group and Plug. Faurecia will supply next generation hydrogen storage systems for the mass production of its Renault Master H2-TECH, made in France. The hydrogen storage systems will be produced in Faurecia’s plant located in Allenjoie, France, which has a capacity of over 100k tanks per year.
- ■Faurecia, signed a power purchase agreement (PPA) of Europe’s largest investors in renewable energy, Octopus Energy Generation and Mirova, a management company dedicated to sustainable investment and an affiliate of Natixis Investment Managers. The installed capacity of the project reaches 85.8 megawatts (MW). The wind turbines are located in Alingsas, Sweden. This agreement will support FORVIA’s plan to reach net-zero CO2 emissions by 2045.
November 2022
- ■FORVIA announced the creation of MATERI’ACT, a new brand to massively develop and manufacture cutting-edge sustainable materials. FORVIA is the first in the automotive industry whose "net zero emissions" objective is validated by the Science Based Target initiatives, and thus reinforces its technological advantage in the field to offer mobility experiences that matter to people.
- ■Faurecia and HELLA, operating together as FORVIA hosted their first joint Capital Markets Day, during which the Group presented Power25, its new medium-term plan to drive profitable growth, enhance cash generation and accelerate Group deleveraging.
The ambitions of FORVIA’s Power25 plan are focused on three key strategic priorities:- ■Drive sales growth through innovation and sustainability,
- ■Enhance profitability and lower breakeven,
- ■Generate strong cash conversion and actively manage portfolio to accelerate Group deleveraging.
- They are translated into the following 2025 financial objectives (based on an assumption of worldwide automotive production of 88 million units in 2025 and after the estimated effect of the €1bn disposal program by end-2023):
- ■2025 sales of c. €30 billion,
- ■2025 operating margin > 7% of sales,
- ■2025 net cash flow at 4% of sales,
- ■Net-debt-to-adjusted-EBITDA < 1.5x at December 31, 2025.
- ■FORVIA, has received the prestigious CES 2023 Innovation Award in the category "Vehicle Tech & Advanced Mobility" as "Honoree" for its digital, chip-based "Solid State Lighting | High Definition" (SSL | HD) headlamp system.
- ■Faurecia has successfully priced €700 million in aggregate principal amount of SL Notes at 7.25%. The SL Notes are to be issued under Faurecia's Sustainability-Linked Financing Framework established in October 2021.
December 2022
- ■FORVIA showcased its newest solutions in electrification and energy management, automated and safe driving, and personalized experiences in the digital and sustainable cockpit. Through these technologies, FORVIA illustrated its commitment to becoming carbon-neutral across all operations and products by 2045.
- ■Faurecia, Michelin and Stellantis announced exclusive negotiations for Stellantis to acquire a substantial stake in Symbio, a leader in zero-emission hydrogen mobility, to become a significant player along with existing shareholders Faurecia and Michelin.
January 2023
- ■Faurecia has successfully priced the New Notes, sustainability-linked 7.25% senior notes due 2026 (the “New Notes”) following a private placement arranged by BNP Paribas. Faurecia priced the New Notes at 101.75% of par, or a yield of 6.65%.
February 2023
- ■Faurecia has issued on February 1st, 2023 €250 million of New Notes, sustainability-linked 7.25% senior notes due 2026. The proceeds of the issuance of the New Notes will be used to fully reimburse the Bridge-to-Bond and the Bridge-to-Equity in connection with the HELLA acquisition and for general corporate purposes.
- ■Faurecia has entered in February 2023 into exclusive negotiations with Cummins for the potential sale of a part of its Commercial Vehicle exhaust aftertreatment business. The potential transaction would be subject to customary conditions precedents, including regulatory approvals and completion of applicable employee representative consultations.
- ■Faurecia has announced mid February 2023 to have signed with the Motherson Group an agreement by which Motherson commits to acquire Faurecia SAS Cockpit Modules division (assembly and logistics services), reported as part of its Interiors Segment, for an enterprise value of €540 million. The transaction will be subject to customary conditions precedents, including regulatory approvals.
All press releases related to these events are available on the site www.faurecia.com
1.1.2.Automotive production
Worldwide automotive production increased by 6.7% from 2021 to 2022. It decreased in Europe (including Russia) by 0.5%, increased in Americas by 9.4% (o/w an increase of 9.7% in North America and 8.3% in South America) , increased in the rest of the world by 9.2%, and increased in Asia by 8.2% (of which an increase of 6.4% in China).
The data related to automotive production and volume evolution is based on IHS Markit Automotive reported dated February 2023 (vehicles segment in line with CAAM for China).
Automotive production and volume evolution from 2021 to 2022
|
Q1 |
Q2 |
H1 |
Q3 |
Q4 |
H2 |
FY |
---|---|---|---|---|---|---|---|
Europe |
-17.5% |
-4.2% |
-11.3% |
21.7% |
6.8% |
13.1% |
-0.5% |
Americas |
-3.5% |
11.8% |
3.7% |
25.0% |
7.2% |
15.6% |
9.4% |
North America |
-1.7% |
11.6% |
4.5% |
23.5% |
7.9% |
15.3% |
9.7% |
South America |
-13.0% |
12.8% |
-0.5% |
32.8% |
4.0% |
17.2% |
8.3% |
Asia |
1.9% |
-0.3% |
0.9% |
33.2% |
1.8% |
15.4% |
8.2% |
China |
6.7% |
-4.8% |
1.0% |
34.3% |
-5.5% |
11.1% |
6.4% |
Rest of the world |
10.2% |
6.7% |
8.5% |
39.2% |
-16.9% |
9.9% |
9.2% |
Total |
-3.4% |
1.5% |
-1.1% |
29.6% |
3.3% |
14.8% |
6.7% |
|
|
|
|
|
|
|
|
1.1.3.Sales
- ■a “Currency effect”, calculated by applying average currency rates for the period to the sales of the prior year;
- ■a “Scope effect” linked to the acquisition of HELLA since 1st February 2022 (11 months);
- ■a “Growth at constant scope & currencies”.
As “Scope effect”, FORVIA presents all acquisitions/divestments, whose sales on an annual basis amount to more than €250 million. Other acquisitions below this threshold are considered as “bolt-on acquisitions” and are included in “Growth are constant currencies”.
(in € million) |
H2 2022 |
Currencies |
Scope Effect* |
At constant scope & |
H2 2021 |
---|---|---|---|---|---|
Product Sales |
13,074.3 |
294.2 |
3,593.8 |
1,891.8 |
7,294.5 |
Var. in % |
79.2% |
4.0% |
49.3% |
25.9% |
|
Tooling, Prototypes and Other Services |
760.9 |
24.4 |
129.9 |
65.8 |
540.8 |
Var. in % |
40.7% |
4.5% |
24.0% |
12.2% |
|
Sales |
13,835.1 |
318.7 |
3,723.6 |
1,957.6 |
7,835.3 |
Var. in % |
76.6% |
4.1% |
47.5% |
25.0% |
|
* Scope effect includes HELLA sales from July to December 2022. |
(in € million) |
2022 |
Currencies |
Scope Effect* |
At constant scope & |
2021 |
---|---|---|---|---|---|
Product Sales |
24,106.5 |
629.5 |
6,314.2 |
2,590.1 |
14,572.7 |
Var. in % |
65.4% |
4.3% |
43.3% |
17.8% |
|
Tooling, Prototypes and Other Services |
1,351.7 |
44.5 |
197.9 |
64.2 |
1,045.1 |
Var. in % |
29.3% |
4.3% |
18.9% |
6.1% |
|
Sales |
25,458.2 |
674.0 |
6,512.1 |
2,654.3 |
15,617.8 |
Var. in % |
63.0% |
4.3% |
41.7% |
17.0% |
|
* Scope effect includes HELLA sales from February to December 2022. |
Sales of products (parts, components and R&D sold to manufacturers) reached €24,106.5 million in 2022 compared to €14,572.7 million in 2021. This represents an increase of 65.4% on a reported basis and by 17.8% at constant scope & currencies.
Sales of tooling, prototypes and other services reached €1,351.7 million in 2022 compared to €1,045.1 million in 2021. This represents an increase of 29.3% on a reported basis and an increase of 6.1% at constant scope & currencies.
Sales reached €25,458.2 million in 2022 compared to €15,617.8 million in 2021. This represents an increase of 63.0% on a reported basis and 17.0% at constant scope & currencies.
1.1.3.1.Sales by region
(in € million) |
H2 2022 |
Scope Effect* |
H2 2021 |
Reported |
At constant scope & |
Automotive Production |
---|---|---|---|---|---|---|
Europe |
5,807.9 |
2,011.6 |
3,190.6 |
82.0% |
22.5% |
13.1% |
Americas |
3,832.3 |
773.6 |
2,240.8 |
71.0% |
23.4% |
15.6% |
o/w North America |
3,437.5 |
760.0 |
1,944.7 |
76.8% |
20.6% |
15.3% |
o/w South America |
394.9 |
13.6 |
296.2 |
33.3% |
42.0% |
17.2% |
Asia |
3,988.2 |
903.5 |
2,309.1 |
72.7% |
27.7% |
15.4% |
o/w China |
3,206.1 |
827.2 |
1,764.7 |
81.7% |
26.9% |
11.1% |
Rest of the world |
206.8 |
34.9 |
94.7 |
118.4% |
81.5% |
9.9% |
Total |
13,835.1 |
3,723.6 |
7,835.3 |
76.6% |
25.0% |
14.8% |
* Scope effect includes HELLA sales from July to December 2022. |
(in € million) |
2022 |
Scope Effect* |
2021 |
Reported |
At constant scope & |
Automotive Production |
---|---|---|---|---|---|---|
Europe |
11,165.2 |
3,635.1 |
6,996.1 |
59.6% |
10.1% |
-0.5% |
Americas |
7,151.4 |
1,384.1 |
4,268.1 |
67.6% |
22.4% |
9.4% |
o/w North America |
6,410.0 |
1,362.0 |
3,724.6 |
72.1% |
20.7% |
9.7% |
o/w South America |
741.4 |
22.1 |
543.4 |
36.4% |
34.3% |
8.3% |
Asia |
6,795.3 |
1,430.2 |
4,166.5 |
63.1% |
21.6% |
8.2% |
o/w China |
5,377.1 |
1,292.1 |
3,117.4 |
72.5% |
21.6% |
6.4% |
Rest of the world |
346.3 |
62.7 |
187.1 |
85.1% |
49.2% |
9.2% |
Total |
25,458.2 |
6,512.1 |
15,617.8 |
63.0% |
17.0% |
6.7% |
* Scope effect includes HELLA sales from February to December 2022. |
- ■in Europe, sales reached €11,165.2 million (43.9% of total sales), compared to €6,996.1 million in 2021. This represents an increase of 59.6% on a reported basis and by 10.1% at constant scope and currencies. This is to be compared to a 0.5% downturn in production market in Europe;
- ■in Americas, sales reached €7,151.4 million (28.1% of total sales), compared to €4,268.1 million in 2021. This represents an increase of 67.6% on a reported basis and by 22.4% at constant scope and currencies. This is to be compared to a 9.4% upturn in production market in America. In North America, sales reached €6,410.0 million, compared to €3,724.6 million in 2021. This represents an increase of 72.1% on a reported basis and by 20.7% at constant scope and currencies. This is to be compared to a 9.7% upturn in production market in North America;
- ■in Asia, sales reached €6,795.3 million (26.7% of total sales), compared to €4,166.5 million in 2021. This represents an
increase of 63.1% on a reported basis and 21.6% at constant scope and currencies. This is to be compared to a 8.2%
upturn in production market in Asia. In China, sales reached €5,377.1 million, compared to €3,117.4 million in 2021. This
represents an increase of 72.5% on a reported basis and 21.6% at constant scope and currencies. This is to be compared
to a 6.4% upturn in production market in China. - ■in the rest of the world, sales reached €346.3 million (1.4% of total sales), compared to €187.1 million in 2021. This represents an increase of 85.1% on a reported basis and 49.2% at constant scope and currencies. This is to be compared to a 9.2% upturn in production market in the rest of the world;
- ■worldwide sales amounted to €25,458.2 million compared to €15,617.8 million in 2021. This represents an increase of 63.0% on a reported basis and 17.0% at constant scope and currencies. This is to be compared to a 6.7% upturn in production market in the world (source IHS Markit forecast dated February 2023).
1.1.3.2.Sales by customer
In 2022, sales* to FORVIA four main customers (VW, Stellantis, Renault-Nissan-Mitsubishi, Ford) amounted to €12,280.9 million or 48.2% compared to 60.2% in 2021:
- ■sales to the VW group totaled €4,648.1 million. They accounted for 18.3% of FORVIA’s total sales. They increased by 48.9% on a reported basis and by 8.9% at constant scope & currencies compared to 2021;
- ■sales to the Stellantis group totaled €3,400.3 million, accounting for 13.4% of FORVIA’s total sales. They increased by 18.0% on a reported basis and by 7.9% at constant scope & currencies compared to 2021;
- ■sales to the Ford group totaled €2,220.3 million. They accounted for 8.7% of FORVIA’s total sales. They increased by 27.4% on a reported basis and by 17.8% at constant scope & currencies compared to 2021;
- ■sales to the Renault-Nissan-Mitsubishi group totaled €2,012.2 million. They accounted for 7.9% of FORVIA’s total sales. They increased by 21.4% on a reported basis and increased by 5.8% at constant scope & currencies compared to 2021;
- ■sales to the DAIMLER totaled €1,697.6 million or 6.7% of total sales. They increased by 181.1% on a reported basis and by 17.8% at constant scope & currencies compared to 2021;
- ■sales to the Chinese OEMs totaled €2,128.8 million or 8.4% of total sales. They increased by 105.6% on a reported basis and by 63.2% at constant scope & currencies compared to 2021;
- ■sales to a Global vehicle company totaled €1,519.4 million or 6.0% of total sales. They increased by 123.4% on a reported basis and by 34.6% at constant scope & currencies compared to 2021;
- ■sales to the General Motors group totaled €1,298.3 million or 5.1% of total sales. They increased by 79.1% on a reported basis and by 18.6% at constant scope & currencies compared to 2021;
- ■sales to CVE totaled €992.0 million or 3.9% of total sales. They increased by 54.3% on a reported basis and by 18.9% at constant scope & currencies compared to 2023.
* The presentation of sales invoiced may differ from that of sales by end customer when products are transferred to intermediary assembly companies.
1.1.3.3.Sales by Business Group
(in € million) |
H2 2022 |
Scope Effect* |
H2 2021 |
Reported |
At constant scope & |
---|---|---|---|---|---|
Seating |
4,174.4 |
|
3,082.1 |
35.4% |
29.9% |
Interiors |
2,967.9 |
|
2,264.8 |
31.0% |
29.1% |
Clean Mobility |
2,451.0 |
|
2,050.8 |
19.5% |
15.1% |
Electronics |
1,971.3 |
1,453.1 |
437.6 |
350.5% |
15.4% |
Lighting |
1,792.6 |
1,792.6 |
|
|
|
Lifecycle Solutions |
477.9 |
477.9 |
|
|
|
Total |
13,835.1 |
3,723.6 |
7,835.3 |
76.6% |
25.0% |
o/w Group Faurecia |
10,111.5 |
|
7,835.3 |
29.1% |
25.0% |
o/w Group HELLA |
3,723.6 |
3,723.6 |
|
|
|
* Scope effect includes HELLA sales from July to December 2022. |
(in € million) |
2022 |
Scope Effect* |
2021 |
Reported |
At constant scope & |
---|---|---|---|---|---|
Seating |
7,704.3 |
|
6,048.7 |
27.4% |
21.9% |
Interiors |
5,529.5 |
|
4,640.6 |
19.2% |
16.8% |
Clean Mobility |
4,735.7 |
|
4,090.8 |
15.8% |
10.9% |
Electronics |
3,521.7 |
2,545.1 |
837.6 |
320,4% |
12.5% |
Lighting |
3,074.0 |
3,074.0 |
|
|
|
Lifecycle Solutions |
893.0 |
893.0 |
|
|
|
Total |
25,458.2 |
6,512.1 |
15,617.8 |
63.0% |
17.0% |
o/w Group Faurecia |
18,946.1 |
|
15,617.8 |
21.3% |
17.0% |
o/w Group HELLA |
6,512.1 |
6,512.1 |
|
|
|
* Scope effect includes HELLA sales from February to December 2022. |
- ■Seating totaled €7,704.3 million sales, up 27.4% on a reported basis and up 21.9% at constant scope & currencies compared to 2021;
- ■Interiors totaled €5,529.5 million sales, up 19.2% on a reported basis and up 16.8% at constant scope & currencies compared to 2021;
- ■Clean Mobility totaled €4,735.7 million sales, up 15.8% on a reported basis and up 10.9% at constant scope & currencies compared to 2021;
- ■Electronics totaled €3,521.7 million sales; up 320.4% on a reported basis and up 12.5% at constant scope & currencies compared to 2021;
- ■Lighting totaled €3,074.0 million sales;
- ■Lifecycle Solutions totaled €893.0 million sales.
1.1.4.Operating income
- ■the operating income before amortization of acquired intangible assets totaled €1,114.9 million (4.4% of sales), compared to €861.7 million (5.5% of sales) in 2021;
- ■gross expenditures for R&D totaled €2,078.9 million, or 8.2% of sales, compared to €1,218.9 million, or 7.8% of sales in 2021. The portion of R&D expenditure capitalized amounted to €1,181.6 million, compared to €875.4 million in 2021. The R&D capitalization ratio represented 56.8% of total R&D expenditure, whereas it represented 71.8% over the same period in 2021;
- ■the net R&D expenses reached €896.7 million (3.5% of sales) compared to €330.9 million in 2021 (2.1% of sales);
- ■selling and administrative expenses reached €1,212.5 million (4.8% of sales) compared to €690.8 million (4.4% of sales) in 2021;
- ■adjusted EBITDA – which represents operating income before depreciation, amortization and provisions for impairment of property, plant and equipment and capitalized R&D expenditures – totaled to €3,011.9 million (11.8% of sales), to be compared to €2,109.4 million (13.5% of sales) in 2021.
1.1.4.1.By region
(in € million) |
H2 2022 |
H2 2021 |
||||
Sales |
Operating |
% |
Sales |
Operating |
% |
|
Europe |
5,807.9 |
65.1 |
1.1% |
3,190.6 |
86.0 |
2.7% |
Americas |
3,823.3 |
147.4 |
3.8% |
2,240.8 |
1.3 |
0.1% |
o/w North America |
3,437.5 |
117.7 |
3.4% |
1,944.7 |
(11.8) |
-0.6% |
o/w South America |
394.9 |
29.6 |
7.5% |
296.2 |
13.1 |
4.4% |
Asia |
3,988.2 |
465.9 |
11.7% |
2,309.1 |
256.3 |
11.1% |
Rest of the world |
206.8 |
10.3 |
5.0% |
94.7 |
8.2 |
8.7% |
Total |
13,835.1 |
688.8 |
5.0% |
7,835.3 |
351.9 |
4.5% |
(in € million) |
2022 |
2021 |
||||
Sales |
Operating |
% |
Sales |
Operating |
% |
|
Europe |
11,165.2 |
179.6 |
1.6% |
6,996.1 |
292.0 |
4.2% |
Americas |
7,151.4 |
193.6 |
2.7% |
4,268.1 |
92.3 |
2.2% |
o/w North America |
6,410.0 |
142.3 |
2.2% |
3,724.6 |
48.8 |
1.3% |
o/w South America |
741.4 |
51.0 |
6.9% |
543.4 |
43.5 |
8.0% |
Asia |
6,795.3 |
722.7 |
10.6% |
4,166.5 |
457.7 |
11.0% |
Rest of the world |
346.6 |
19.3 |
5.6% |
187.1 |
19.7 |
10.5% |
Total |
25,458.2 |
1,114.9 |
4.4% |
15,617.8 |
861.7 |
5.5% |
- ■in Europe, the operating income decreased by €112.4 million, to reach €179.6 million or 1.6% of sales. This is to be compared to €292.0 million or 4.2% in 2021;
- ■in Americas, the operating income increased by €101.0 million, to €193.3 million (o/w €142.3 million euros in North America) or 2.7% of sales (2.2% in North America). This is to be compared to €92.3 million or 2.2% in 2021 in Americas and €48.8 million euros or 1.3% in North America;
- ■in Asia, the operating income increased by €265.0 million to reach €722.7 million or 10.6% of sales. This is to be compared to €457.7 million or 11.0% in 2021;
- ■in the rest of the world, the operating margin decreased by €0.4 million to €19.3 million or 5.6% of sales. This is to be compared to €19.7 million or 10.5% in 2021.
1.1.4.2.By Business Group
(in € million) |
H2 2022 |
H2 2021 |
||||
Sales |
Operating |
% |
Sales |
Operating |
% |
|
Seating |
4,174.4 |
132.4 |
3.2% |
3,082.1 |
88.4 |
2.9% |
Interiors |
2,967.9 |
154.8 |
5.2% |
2,264.8 |
73.1 |
3.2% |
Clean Mobility |
2,451.0 |
184.4 |
7.5% |
2,050.8 |
191.0 |
9.3% |
Electronics |
1,971.3 |
77.9 |
4.0% |
437.6 |
(0.7) |
-0.1% |
Lighting |
1,792.6 |
95.8 |
5.3% |
|
|
|
Lifecycle Solutions |
477.9 |
43.4 |
9.1% |
|
|
|
Total |
13,835.1 |
688.8 |
5.0% |
7,835.3 |
351.9 |
4.5% |
o/w Group Faurecia |
10,111.5 |
472.6 |
4.7% |
7,835.3 |
351.9 |
4.5% |
o/w Group HELLA |
3,723.6 |
216.2 |
5.8% |
|
|
|
(in € million) |
2022 |
2021 |
||||
Sales |
Operating |
% |
Sales |
Operating |
% |
|
Seating |
7,704.3 |
197.0 |
2.6% |
6,048.7 |
284.8 |
4.7% |
Interiors |
5,529.5 |
245.7 |
4.4% |
4,640.6 |
189.9 |
4.1% |
Clean Mobility |
4,735.7 |
336.3 |
7.1% |
4,090.8 |
388.7 |
9.5% |
Electronics |
3,521.7 |
140.8 |
4.0% |
837.6 |
(1.7) |
-0.2% |
Lighting |
3,074.0 |
106.5 |
3.5% |
|
|
|
Lifecycle Solutions |
893.0 |
88.5 |
9.9% |
|
|
|
Total |
25,458.2 |
1,114.9 |
4.4% |
15,617.8 |
861.7 |
5.5% |
o/w Group Faurecia |
18,946.1 |
769.0 |
4.1% |
15,617.8 |
861.7 |
5.5% |
o/w Group HELLA |
6,512.1 |
345.9 |
5.3% |
|
|
|
- ■Seating operating income amounted to €197.0 million (2.6% of sales) compared to €284.8 million in 2021 (4.7% of sales);
- ■Interiors operating income amounted to €245.7 million (4.4% of sales) compared to €189.9 million in 2021 (4.1% of sales);
- ■Clean Mobility operating income amounted to €336.3 million (7.1% of sales) compared to €388.7 million in 2021 (9.5% of sales);
- ■Electronics operating income amounted to €140.8 million (4.0% of sales) compared to €(1.7) million in 2021 (-0.2% of sales);
- ■Lighting operating income amounted to €106.5 million (3.5% of sales) ;
- ■Lifecycle Solutions operating income amounted to €88.5 million (9.9% of sales).
1.1.5.Net income
The net income group share is a loss of €381.8 million, or -1.5% of sales in 2022. This is to be compared to a loss of €78.8 million or -0.5% of sales in 2021. It represented a decrease of €303.0 million.
- ■the amortization of intangible assets acquired represented an expense of €218.6 million compared to an expense of €92.6 million in 2021;
- ■the “other non-recurring operating income and expenses” represented an expense of €449.2 million, compared to an expense of €238.5 million in 2021. This item included €351.8 million in restructuring charges compared to an expense of €196.3 million in 2021;
- ■financial income amounted to €51.6 million, compared to €32.0 million in 2021;
- ■financial costs totaled €385.3 million, versus €239.3 million in 2021;
- ■other financial income and expense represented an expense of €188.9 million compared to an expense of €47.2 million in 2021. This expense included €11.3 million from discounting pension benefit liabilities;
- ■the tax expense reached €186.3 million, compared to €138.8 million in 2021. It included an income of 181.4 million due to changes in deferred tax;
- ■the share of net income of associates is a profit of €11.4 million, compared to a loss of €24.6 million in 2021;
- ■net income attributable to minority interests totaled €131.4 million. It consists of net income accruing to investors in companies in which FORVIA is not the sole shareholder, mainly in China and HELLA, compared to €95.0 million in 2021.
Basic earnings per share amounted to €-2.20 (diluted net earnings per share at €-2.20) compared to €-0.57 in 2021 (diluted net earnings per share at €-0.57).
1.1.6.Financial structure
1.1.6.1.Reconciliation between net cash flow and cash provided by operating and investing activities
(in € million) |
Notes |
2022 |
2021 |
---|---|---|---|
Net cash flow |
|
470.8 |
304.6 |
Acquisitions/Sales of investments and business (net of cash |
2.3 |
(4,885.5) |
(66.1) |
Proceed from disposal of financial assets from continued activities |
2.3 |
0.0 |
0.0 |
Other changes from continued activities |
2.3 |
628.6 |
(62.0) |
Financing surplus (used) from discontinued operations |
2.3 |
0.0 |
(66.0) |
Other changes from discontinued activities |
|
0.0 |
0.0 |
Surplus (used) from operating and financing activities |
2.3 |
(3,786.1) |
110.4 |
1.1.6.2Net cash flow
The net cash flow was an inflow of €470.8 million compared to a net cash inflow of €304.6 million over the same period in 2021. It can be explained as follows:
- ■the operating margin before depreciations and provision of impairment of non-current assets or adjusted EBITDA reached €3,011.9 million compared to €2,109.4 million in 2021, due to the increase in operating income by €253.2 million and the increase in depreciation and amortization by €649.3 million;
- ■restructuring represented cash outflows of €183.8 million compared to €174.7 million in 2021;
- ■net financial costs represented cash outflows of €373.0 million, versus €230.3 million in 2021;
- ■the change in working capital requirement, including receivables factoring, represented a positive impact of €557,2 million compared to a positive impact of €53.0 million in 2021. This change consisted in part of an increase in inventories of €176.2 million, a net increase in trade receivables of €592.6 million, an increase in trade payables of €1,315.4 million and a positive variation of other trade receivables and payables for €10.6 million. The evolution of these balance sheet positions was impacted by exchange rate changes;
- ■capital expenditures on property, plant and equipment and on intangible assets represented cash outflows of €1,177.0 million, versus €530.0 million in 2021;
- ■capitalized research and development costs represented cash outflows of €965.8 million, versus €669.7 million in 2021;
- ■income taxes represented cash outflows of €384.3 million, compared to €242.6 million in 2021;
- ■finally, other cash flow items represented €14.4 million in outflows, compared to €10.8 million in outflows in 2021.
1.1.6.3Net Debt
The Group’s net financial debt stood at €7,939.1 million at December 31, 2022 compared to €3,466.7 million at December 31, 2021.
The net debt evolution is mainly impacted by the HELLA acquisition effective on the 31st of January 2022 as well as the positive net cash flow evolution of €470.8 million, the purchase of treasury shares for €1.1 million, dividends paid for €54.9 million, the net financial investments and other cash elements outflow of €4,537.5 million (mainly impacted by the HELLA acquisition) and the negative impact of €349.7 million related to IFRS 16.
- ■Our main syndicated credit facility, which has been renegotiated in May 2021. Its amount has been increased from €1,200 to €1,500 million, and its maturity extended to May 2026, with two one-year maturity extension options. The credit facility is now a sustainability-linked credit line, with a margin indexed on the Group’s performance in terms of CO2 emissions reduction for its scopes 1 & 2. As at December 31, 2022, this facility was not used and fully available for its total amount;
- ■HELLA’s syndicated credit facility, which has been renegotiated in September 2022. It has an available amount of € 450 million, with one option to increase the available amount by €150 million and its maturity is 30th September 2025, with two one-year maturity extension options. As at December 31 2022, this facility was not used and fully available for its total amount;
- ■Faurecia signed on August 13, 2021 a fully underwritten bridge loan of €5,500 million (including a €500 million 3 year Term Loan) in order to secure the financing of the acquisition of HELLA. As of 31st of December 2021 the Bridge facility was reduced to €3,400 million, following €2,100 million of prefinancing transactions. During 2022 Faurecia repaid back €2,200 million euros, following a €700 million capital increase on the 24th of June 2022 and further debt increases. As of 31st of December 2022 , the total outstanding amount of the bridge loan was €705 million, of which :
- - €100 million Bridge to Equity with maturity 30 January 2023 with a further extension possible up to 13th of August 2023
- - €105 million euros Bridge to Bond with maturity 2nd February 2023, with a future extension possible up to 13th of August 2023
- - €500 million Term Loan with a current maturity of 13th of August 2024;
- ■A total amount of €6,525 million bonds, of which €1,000 million of bonds maturing in June 2025, €750 million of bonds maturing in June 2026, €700 million of sustainability-linked bonds maturing June 2026, €1,200 million of sustainability-linked bonds maturing in February 2027, €890 million of bonds maturing in June 2027 (of which an additional €190 million issued in February 2021), €700 million of bonds maturing in June 2028, €400 million of Green Bonds maturing in June 2029, €300 million HELLA bonds maturing May 2024, €500 million HELLA bonds maturing January 2027 and ¥12,000 million HELLA Notes maturing 2032;
- ■€1,180 million of Schuldscheindarlehen (private placement under German law), made of several tranches maturing in December 2023, June, July and December 2024, January 2026, January 2027 and January 2028 ;
- ■A 30 billion Japanese Yen credit line signed in February 2020 in order to refinance the long-term debt of Clarion Co. Ltd maturing in February 2026 after a first maturity extension. As at December 31. 2022, this facility was used up to ¥20 billion;
- ■On the 1st of July 2022, Faurecia signed a €315 million Credit Agreement with the European Investment Bank with maturity 1st of July 2029. The amount drawn under the facility as of December 31, 2022 is €289 million;
- ■Faurecia Sistemas Automotrices SA DE CV signed on September 22,2022 a $210 million syndicated loan with Latin American investors.The loan is composed of a $100 million tranche and 2,000 million Mexican peso tranche both with maturity March 22, 2028 ;
- ■HELLA signed on June 16, 2003 a ¥10,000 million loan with maturity June 20, 2033.
1.2.Outlook
FORVIA 2023 GUIDANCE
- ■Worldwide automotive production of 82 million vehicles in 2023, broadly flat vs. actual production in 2022 and more
conservative than S&P’s latest forecast of 85 million - ■Main currency rates of USD/€ @ 1.10 and CNY/€ @ 7.50
- ■Sales between €25.2bn and €26.2bn including an estimated impact on sales of €(1.3)bn from disposals announced
to date (mainly SAS deconsolidation as from January 1, 2023, to comply with IFRS 5 and business to be sold to Cummins as
from July 1, 2023) - ■Operating margin between 5% and 6% of sales
- ■Net cash flow exceeding 1.5% of sales
- ■Net debt/Adj. EBITDA ratio between 2x and 2.4x at December 31, 2023, including the effect of the disposal program of €1bn by end-2023
This guidance assumes no major lockdown impacting production or retail sales in any major automotive region during the year.
FY 2025 TARGETS CONFIRMED (after estimated impact of the disposal program of €1bn by year-end 2023)
FORVIA’s full-year 2025 targets, as presented at the recent Capital Markets Day held on November 3, 2022, are fully confirmed (based on an assumption of worldwide automotive production of 88 million vehicles in 2025, more conservative than S&P’s latest forecast of 90 million, and on 2025 currency rates of USD/€ @ 1.05 and CNY/€ @ 7.00):
1.3Consolidated financial statements
In the financial statements reported thereafter, please note that :
- ■figures reported for the year 2021 are figures related to Faurecia "stand-alone" as reported in February 2022 ;
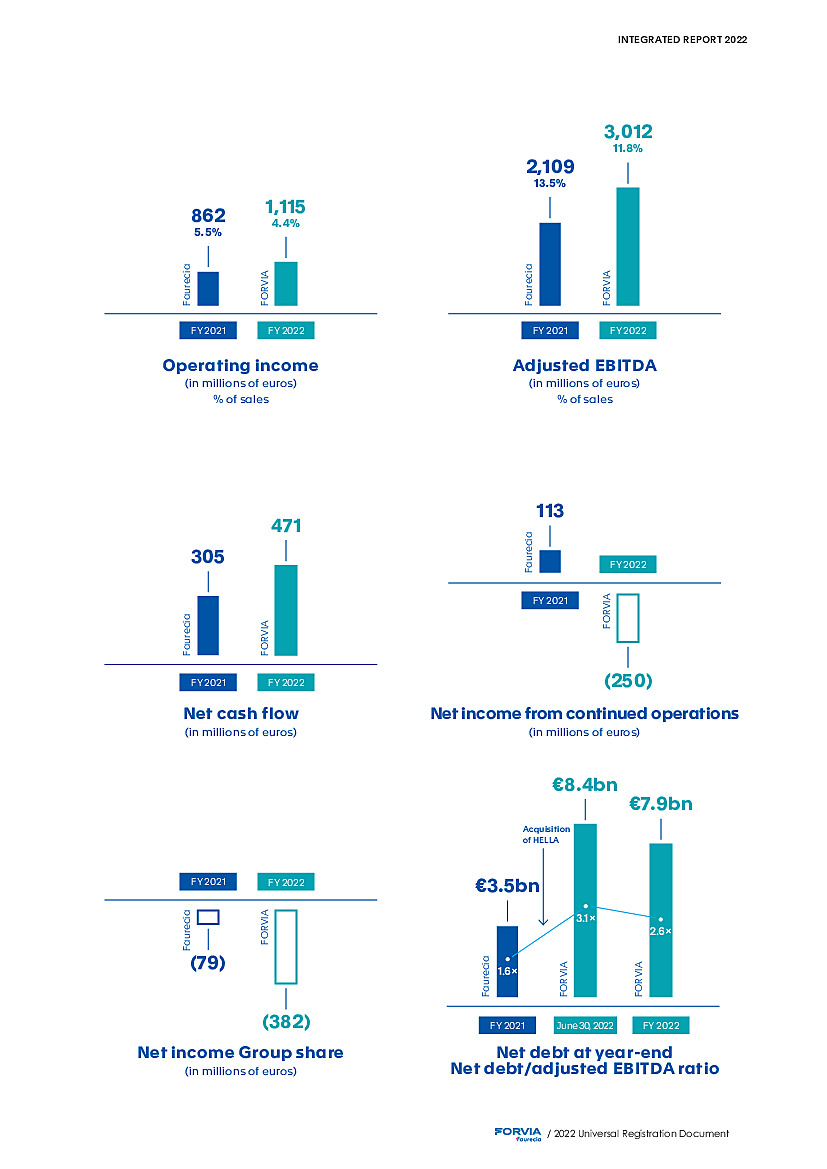
- ■figures reported for the year 2022 include the major impact of HELLA consolidation since February 1st 2022 (i.e. 11 months in 2022).
1.3.1.Consolidated statement of comprehensive income
(in € million) |
Notes |
2022 |
2021 |
---|---|---|---|
Sales |
4 |
25,458.2 |
15,617.8 |
Cost of sales |
5 |
(22,234.1) |
(13,734.4) |
Research and development costs |
5 |
(896.7) |
(330.9) |
Selling and administrative expenses |
5 |
(1,212.5) |
(690.8) |
Operating income (before amortization |
4 |
1,114.9 |
861.7 |
Amortization of intangible assets acquired in business combinations |
11 |
(218.6) |
(92.6) |
Operating income (after amortization |
|
896.3 |
769.1 |
Other non-recurring operating income |
6 |
1.8 |
6.0 |
Other non-recurring operating expense |
6 |
(451.0) |
(244.5) |
Income from loans, cash investments and marketable securities |
|
51.6 |
32.0 |
Finance costs |
7 |
(385.3) |
(239.3) |
Other financial income and expense |
7 |
(188.9) |
(47.2) |
Income before tax of fully consolidated companies |
|
(75.5) |
276.1 |
Taxes |
8 |
(186.3) |
(138.8) |
of which deferred taxes |
8 |
181.4 |
95.0 |
Net income (loss) of fully consolidated companies |
|
(261.8) |
137.3 |
Share of net income of associates |
13 |
11.4 |
(24.6) |
Net income from continued operations |
|
(250.4) |
112.7 |
Net income from discontinued operations |
2.3 |
0.0 |
(96.5) |
Consolidated net income (loss) |
|
(250.4) |
16.2 |
Attributable to owners of the parent |
|
(381.8) |
(78.8) |
Attributable to minority interests from continued operations |
23 |
131.4 |
95.0 |
Attributable to minority interests from discontinued operations |
|
0.0 |
0.0 |
Basic earnings (loss) per share (in €) |
9 |
(2.20) |
(0.57) |
Diluted earnings (loss) per share (in €) |
9 |
(2.20) |
(0.57) |
Basic earnings (loss) from continued operations per share (in €) |
9 |
(2.20) |
0.13 |
Diluted earnings (loss) from continued operations per share (in €) |
9 |
(2.20) |
0.13 |
Basic earnings (loss) from discontinued operations per share (in €) |
9 |
NA |
(0.70) |
Diluted earnings (loss) from discontinued operations per share (in €) |
9 |
NA |
(0.70) |
Other comprehensive income
(in € million) |
Notes |
2022 |
2021 |
---|---|---|---|
Consolidated net income (loss) |
|
(250.4) |
16.2 |
Amounts to be potentially reclassified to profit or loss from continued operations |
|
70.5 |
259.4 |
Gains (losses) arising on fair value adjustments to cash flow hedges |
|
92.6 |
3.9 |
of which recognized in equity |
|
82.5 |
10.9 |
of which transferred to net income (loss) for the period |
|
10.1 |
(7.0) |
Exchange differences on translation of foreign operations |
|
2.8 |
256.6 |
Tax impact |
|
(24.9) |
(1.1) |
Amounts not to be reclassified to profit or loss from continued operations |
|
168.7 |
45.1 |
Actuarial gain/(loss) on post-employment benefit obligations |
25 |
244.3 |
54.1 |
Tax impact |
|
(75.6) |
(9.0) |
Other comprehensive income from discontinued operations |
|
0.0 |
6.5 |
Total comprehensive income (expense) for the period |
|
(11.2) |
327.2 |
Attributable to owners of the parent |
|
(150.8) |
196.9 |
Attributable to minority interests |
|
139.6 |
130.3 |
1.3.2.Consolidated balance sheet
Assets
(in € million) |
Notes |
2022 |
2021 |
---|---|---|---|
Goodwill |
10 |
5,260.3 |
2,236.2 |
Intangible assets |
11 |
4,590.1 |
2,800.4 |
Property, plant and equipment |
12A |
5,055.8 |
2,802.4 |
Right-of-use assets |
12B |
1,183.5 |
950.9 |
Investments in associates |
13 |
333.9 |
150.8 |
Other equity interests |
14 |
128.5 |
88.0 |
Other non-current financial assets |
15 |
158.1 |
98.0 |
Other non-current assets |
16 |
187.1 |
122.3 |
Deferred tax assets |
8 |
690.5 |
540.6 |
Total non-current assets |
|
17,587.8 |
9,789.6 |
Inventories, net |
17 |
2,924.2 |
1,657.6 |
Contract assets |
|
275.6 |
273.5 |
Trade accounts receivables |
18 |
5,065.9 |
3,468.1 |
Other operating receivables |
19 |
720,5 |
473.6 |
Other receivables |
20 |
1,425.7 |
1,094.9 |
Other current financial assets |
30 |
17.6 |
11.9 |
Cash and cash equivalents |
21 |
4,201.1 |
4,905.7 |
Total current assets |
|
14,630.6 |
11,885.3 |
Total assets |
|
32,218.4 |
21,674.9 |
Liabilities
(in € million) |
Notes |
2022 |
2021 |
---|---|---|---|
Equity |
|
|
|
Capital |
22 |
1,379.6 |
966.3 |
Additional paid-in capital |
|
1,408.7 |
605.2 |
Treasury stock |
|
(4.5) |
(4.0) |
Retained earnings |
|
2,162.5 |
1,974.7 |
Translation adjustments |
|
(16.5) |
(34.3) |
Net income (loss) |
|
(381.8) |
(78.8) |
Equity attributable to owners of the parent |
|
4,548.0 |
3,429.1 |
Minority interests |
23 |
1,691.1 |
386.3 |
Total shareholders’ equity |
|
6,239.1 |
3,815.4 |
Non-current provisions |
25 |
575.2 |
447.3 |
Non-current financial liabilities |
26 |
9,106.2 |
6,333.6 |
Non-current lease liabilities |
26 |
1,049.2 |
833.1 |
Other non-current liabilities |
|
48.2 |
5.6 |
Deferred tax liabilities |
8 |
390.4 |
44.1 |
Total non-current liabilities |
|
11,169.2 |
7,663.7 |
Current provisions |
24 |
795.5 |
288.4 |
Current financial liabilities |
26 |
1,773.7 |
1,018.8 |
Current portion of lease liabilities |
26 |
251.8 |
198.8 |
Prepayments on customers contracts |
|
975.4 |
740.2 |
Trade payables |
27 |
9,181.3 |
6,693.2 |
Accrued taxes and payroll costs |
27 |
1,104.3 |
779.1 |
Sundry payables |
28 |
728.1 |
477.3 |
Total current liabilities |
|
14,810.1 |
10,195.8 |
Total equity and liabilities |
|
32,218.4 |
21,674.9 |
1.3.3.Consolidated cash flow statement
(in € million) |
Notes |
2022 |
2021 |
---|---|---|---|
I- Operating activities |
|
|
|
Operating income (before amortization of acquired intangible assets) |
|
1,114.9 |
861.7 |
Depreciations and amortizations of assets |
5.5 |
1,897.0 |
1,247.7 |
o/w depreciations and amortizations of R&D assets |
5.5 |
687.2 |
487.5 |
o/w other depreciations |
|
1,209.8 |
760.2 |
EBITDA adjusted |
|
3,011.9 |
2,109.4 |
Operating current and non-current provisions |
|
(102.0) |
(47.5) |
Capital (gains) losses on disposals of operating assets |
|
(2.4) |
(4.1) |
Paid restructuring |
|
(183.8) |
(174.7) |
Paid finance costs net of income |
|
(373.0) |
(230.3) |
Other non-recurring operating income and expenses paid |
|
(83.5) |
(42.8) |
Paid taxes |
|
(384.3) |
(242.6) |
Dividends from associates |
|
24.4 |
13.5 |
Change in working capital requirement |
|
557.2 |
53.0 |
Change in inventories |
|
(176.2) |
(203.0) |
o/w R&D inventories increase |
5.4 |
(215.8) |
(205.7) |
o/w R&D inventories decrease |
|
194.1 |
201.2 |
Change in trade accounts receivables |
|
(592.6) |
(5.0) |
Change in trade payables |
|
1,315.4 |
397.3 |
Change in other operating receivables and payables |
|
54.3 |
18.2 |
Change in other receivables and payables (excl. Tax) |
|
(43.7) |
(154.5) |
Operating cash flows from discontinued activities |
|
0.0 |
(41.9) |
Cash flows provided by (used in) operating activities |
|
2,464.6 |
1,392.0 |
II- Investing activities |
|
|
|
Additional property, plant and equipment |
12 |
(1,158.3) |
(528.6) |
Additional intangible assets |
11 |
(18.7) |
(1.3) |
Capitalized development costs |
5.4 & 11 |
(965.8) |
(669.7) |
Acquisitions/Sales of investments and business (net of cash and cash equivalents) |
10 |
(4,885.5) |
(66.1) |
Proceeds from disposal of property, plant and equipment |
|
22.8 |
33.0 |
Proceed from disposal of financial assets |
|
0.0 |
0.0 |
Change in investment-related receivables and payables |
|
126.3 |
37.3 |
Other changes |
|
628.6 |
(62.0) |
Investing cash flows from discontinued operations |
|
0.0 |
(24.1) |
Cash flows provided by (used in) investing activities |
|
(6,250.7) |
(1,281.6) |
Cash provided by (used in) operating and investing activities (I)+(II) |
|
(3,786.1) |
110.4 |
III- Financing activities |
|
|
|
Shares issued by Faurecia and fully consolidated companies (net of costs) |
|
1,216.8 |
101.7 |
Dividends paid to owners of the parent company |
|
(0.0) |
(134.8) |
Dividends paid to minority interests in consolidated subsidiaries |
|
(54.9) |
(66.4) |
Acquisitions of treasury stocks |
|
(1.1) |
(127.5) |
Debt securities issued and increase in other financial liabilities |
26 |
4,755.9 |
2,512.0 |
Repayment of debt and other financial liabilities |
26 |
(2,539.8) |
(479.4) |
Repayments on lease debts |
|
(257.0) |
(205.1) |
Financing cash flows from discontinued activities |
|
0.0 |
(2.6) |
Net cash provided by (used in) financing activities |
|
3,119.9 |
1,597.8 |
IV- Other changes in cash and cash equivalents |
|
|
|
Impact of exchange rate changes on cash and cash equivalents |
|
(38.4) |
106.2 |
Net cash flows from discontinued operations |
|
0.0 |
5.5 |
Net increase (decrease) in cash and cash equivalents |
|
(704.6) |
1,819.9 |
Cash and cash equivalents at the beginning of period |
|
4,905.7 |
3,085.9 |
Cash and cash equivalents at end of period |
|
4,201.1 |
4,905.7 |
The net cash flow amounts to €470.8 million as of December 31, 2022 and €304.6 million as of December 31, 2021.
1.3.4.Consolidated statement of changes in equity
(in € million) |
Number |
Capital stock |
Addi- |
Treasury Stock |
Retained earnings and net |
Valuation adjustments |
Equity |
Minority interests |
Total |
||
Trans- |
Cash flow hedges |
Actuarial gain/(loss) |
|||||||||
Shareholders’ equity as of January 1, 2021 before appropriation of net income (loss) |
138,035,801 |
966.3 |
632.8 |
(19.1) |
2,236.4 |
(254.7) |
(0.6) |
(156.1) |
3,405.0 |
331.4 |
3,736.4 |
Net income (loss) |
|
|
|
|
(78.8) |
|
|
|
(78.8) |
95.0 |
16.2 |
Other comprehensive income |
|
|
|
|
|
220.7 |
2.8 |
52.2 |
275.7 |
35.3 |
311.0 |
Comprehensive income |
|
|
|
|
(78.8) |
220.7 |
2.8 |
52.2 |
196.9 |
130.3 |
327.2 |
Capital increase |
|
|
|
|
|
|
|
|
0.0 |
2.4 |
2.4 |
2020 dividends |
|
|
|
|
(134.8) |
|
|
|
(134.8) |
(68.2) |
(203.0) |
Allocation of free shares |
|
|
|
|
(9.7) |
|
|
|
(9.7) |
|
(9.7) |
Purchases and sales of treasury stock |
|
|
|
15.1 |
|
|
|
|
15.1 |
|
15.1 |
Changes in scope of consolidation and other |
|
|
(27.6) |
|
(16.4) |
(0.3) |
|
0.9 |
(43.4) |
(9.6) |
(53.0) |
Shareholders’ equity as of December 31, 2021 before appropriation of net income (loss) |
138,035,801 |
966.3 |
605.2 |
(4.0) |
1,996.7 |
(34.3) |
2.2 |
(103.0) |
3,429.1 |
386.3 |
3,815.4 |
IFRS IC decision on SaaS Software** |
|
|
|
|
(3.5) |
|
|
|
(3.5) |
|
(3.5) |
Shareholders’ equity as of December 31, 2021 restated before appropriation of net income (loss) |
138,035,801 |
966.3 |
605.2 |
(4.0) |
1,993.2 |
(34.3) |
2.2 |
(103.0) |
3,425.6 |
386.3 |
3,811.9 |
Net income (loss) |
|
|
|
|
(381.8) |
|
|
|
(381.8) |
131.4 |
(250.4) |
Other comprehensive income |
|
|
|
|
|
17.3 |
63.5 |
150.2 |
231.0 |
8.2 |
239.2 |
Comprehensive income |
|
|
|
|
(381.8) |
17.3 |
63.5 |
150.2 |
(150.8) |
139.6 |
(11.2) |
Capital increase (2) |
59,053,539 |
413.3 |
803.5 |
|
|
|
|
|
1,216.9 |
|
1,216.9 |
2021 dividends |
|
|
|
|
|
|
|
|
0.0 |
(55.2) |
(55.2) |
Allocation of free shares |
|
|
|
|
9.2 |
|
|
|
9.2 |
|
9.2 |
Purchases and sales of treasury stock |
|
|
|
(0.5) |
|
|
|
|
(0.5) |
|
(0.5) |
Changes in scope of consolidation and other |
|
|
|
|
184.1 |
0.5 |
(51.1) |
(85.9) |
47.7 |
1,220.4* |
1,268.1 |
Shareholders’ equity as of December 31, 2022 before appropriation of net income (loss) |
197,089,340 |
1,379.6 |
1,408.7 |
(4.5) |
1,804.7 |
(16.5) |
14.7 |
(38.7) |
4,548.0 |
1,691.1 |
6,239.1 |
(1) Of which 84,171 treasury stock as of 12/31/2022 and 84,171 treasury stock as of 12/31/2021 – See Note 9. (2) Of which €524.5 million on January 31, 2022 and €692.3 million on June 24, 2022. * See Note 10.A. ** See Note 1.A. |
1.3.5.Notes to the consolidated financial statements
contents
FORVIA comprises the complementary technology and industrial strengths of Faurecia and HELLA, and is the 7th largest global automotive supplier.
Faurecia S.E. is a European company which registered office is located at 23-27, avenue des Champs-Pierreux, 92000 Nanterre (Hauts-de-Seine department) in France. The Company is listed on Euronext Paris.
The consolidated financial statements were approved by Faurecia’s Board of Directors on February 17, 2023.
The accounts were prepared on a going concern basis.
Note 1Summary of significant accounting policies
1.AAccounting principles
The consolidated financial statements of the Faurecia group have been prepared in accordance with International Financial Reporting Standards (IFRS) published by the IASB, as adopted by the European Union and available on the European Commission website. These standards include International Financial Reporting Standards and International Accounting Standards (IAS), as well as the related International Financial Reporting Interpretations Committee (IFRIC) interpretations.
The standards used to prepare the 2022 consolidated financial statements and comparative data for 2021 are those published in the Official Journal of the European Union (OJEU) as of December 31, 2022, whose application was mandatory at that date. The new standards, amendments and revisions to the existing standards, whose publication is mandatory from January 1, 2022, have no significant impact on the Group consolidated financial statements, more specifically the IAS 37 amendment on cost of fulfilling a contract and the IFRS IC decision on SaaS softwares.
Moreover, Faurecia has not undertaken any early application of new standards, amendments or interpretations whose application is mandatory after December 31, 2022, irrespective of whether or not they are adopted by the European Union.
The principal accounting policies considered have been applied consistently to all presented periods. Specifically, the operating margin (before amortization of intangible assets acquired) is the Faurecia group’s principal performance indicator. It corresponds to net income of the fully consolidated companies before:
- ■the amortization of intangible assets acquired in business combinations (customer relationship…);
- ■other non-recurring operating income and expenses, corresponding to material, unusual and non-recurring items including reorganization costs and early retirement costs, the impact of exceptional events such as the discontinuation of a business, the closure of an industrial site, disposals of non-operating buildings, impairment losses and reversals recorded for property, plant and equipment or intangible assets, as well as other material and unusual losses;
- ■income on loans, cash investments and marketable securities;
- ■finance costs;
- ■other financial income and expenses, which include the impact of discounting the pension benefit obligation and the return on related plan assets, the ineffective portion of interest rate and currency hedges, changes in value of interest rate and currency instruments for which the hedging relationship does not satisfy the criteria set forth in IFRS 9, and gains and losses on sales of shares in subsidiaries;
- ■taxes.
The preparation of financial statements in accordance with IFRS requires the use of estimates and assumptions when measuring certain assets, liabilities, income, expenses accounted for in the financial statements as well as for the evaluation of commitments given and contingent liabilities. These estimates and assumptions are primarily used when calculating the impairment of property, plant and equipment, right of use, intangible assets and goodwill, for measuring pension and other employee benefit obligations as well as for lease liabilities and depreciation of deferred tax assets. They are based on historical experience and other factors that are believed to be reasonable under the circumstances. Actual results may differ from these estimates and assumptions. These estimations are revised on a regular basis, notably in the recent macro economic context of the military conflict Ukraine (see Note 2.5). Moreover, the Group must exercise judgment in determining whether the criteria for recognizing an asset or group of assets as held for sale are met, pursuant to the provisions of IFRS 5 “Non-Current Assets Held for Sale and Discontinued Operations”.
These estimates consider also the Group plans in terms of carbon neutrality as approved by the Science Based Target Initiative (SBTi) in July 2022 and more specifically, achieving by 2025 CO2 neutral scopes 1 & 2 and by 2030 reducing green house gas (GHG) emissions by 45%, among others by solar energy production on its sites (on site PPA), purchases of renewable energy (off site PPA) and the development of its transversal division for cutting-edge sustainable and smart materials launched in July 2021, as well as the review of the group industrial portfolio to climatic risks on the basis on the GIEC scenarii.
The results of the sensitivity tests carried out on the carrying amounts of goodwill and provisions for pensions and other employee benefits are provided in notes 10 and 25.2, respectively. In addition, note 11 “Intangible Assets” describes the main assumptions used for measuring intangible assets.
1.BConsolidation principles
Companies over which the Group exercises significant influence and which are at least 20%-owned are consolidated when one or more of the following criteria are met: annual sales of over €20 million, total assets of over €20 million, and debt of over €5 million.
Subsidiaries controlled by the Group are fully consolidated. Control is presumed to exist when the Group holds more than 50% of a company’s voting rights and may also arise as a result of shareholders’ agreements.
Subsidiaries are fully consolidated as of the date on which control is transferred to the Group. They are no longer consolidated as of the date that control ceases.
Companies over which the Group exercises significant influence but not control, generally through a shareholding representing between 20% and 50% of the voting rights, are accounted for by the equity method. There is no joint operation in the sense of IFRS 11 within the companies consolidated by equity method.
The Faurecia group’s financial statements are presented in euros. Except if specifically specified, amounts are in millions of euros; generally, amounts presented are rounded to the closest unit; consequently, the sum of rounded amounts can present non-significant differences to the reported total. Moreover, ratios and variances reported are computed with the detailed amounts and not with the rounded amounts.
The functional currency of foreign subsidiaries is generally their local currency. The assets and liabilities of these companies are translated into euros at the year-end exchange rate and income statement items are translated at the average exchange rate for the year. The resulting foreign exchange gains and losses are recorded in equity.
Balance sheets and net income of Group entities active in hyperinflation economies are restated to take into account the changes in purchasing power of the local currencies using the official indexes at closing date. They are then translated in euros using the exchange rate of the closing date; without restatement of comparative periods in accordance with IAS 21. This is applied to Group affiliates in Argentina in 2021 and 2022 and in Turkey in 2022.
However certain companies located outside the euro or the US-dollar zone and which carry out the majority of their transactions in euros or US dollars may, however, use euros or US dollars as their functional currency.
All material inter-company transactions are eliminated in consolidation, including inter-company gains.
The accounting policies of subsidiaries and companies accounted for by the equity method are not significantly different from those applied by the Group.
Note 2Change in scope of consolidation and recent events
2.1Major perimeter change with HELLA acquisition
On August 14, 2021, Faurecia has announced the signature of agreements concerning the acquisition of block of control for 60% of the shares from the controlling family pool and a public tender cash offer on the remaining 40% shares of HELLA, group listed on the Frankfort Stock Exchange, for a price of €60 per HELLA share, corresponding to a total value of €6.7 billion for the total number of shares. 19.5% of HELLA shares were tendered in the takeover offer by HELLA shareholders, which has been launched on September 27, 2021 by Faurecia and closed on November 11, 2021.
Following approval from the appropriate regulatory bodies, Faurecia has completed on January 31, 2022 the acquisition of 79.5% of HELLA, comprising the 60% acquired from the family pool, of which 8.95% were paid through newly issued Faurecia shares and 19.5% as a result of the public tender offer mentioned above. Faurecia also acquired additional shares on the market, representing 2.09% of HELLA shares as of March 18, 2022. As of December 31, 2022, Faurecia holds 81.6% of HELLA shares.
Faurecia has an exclusive control on HELLA, which is fully consolidated (including all its significant affiliates) since February 1, 2022. The new group combining Faurecia and HELLA is now named FORVIA.
The combination of Faurecia and HELLA creates the 7th largest global automotive supplier, focused on four growth areas, fully aligned with industry megatrends:
- ■Electric Mobility (incl. hydrogen solutions);
- ■ADAS & Autonomous Driving;
- ■Cockpit of the Future;
- ■Lifecycle Value Management.
2.2Other changes in scope in 2022
Within the Seating perimeter, in China the companies Xian Faurecia Automotive Parts Co., Ltd and Changzhou Faurecia Automotive Parts Co., Ltd have been created and are fully consolidated since February 2022; they are held at 70% by the Group. The company Faurecia (Tianjin) Automotive Systems Co., Ltd has been created and is fully consolidated since February 2022; it is held at 100%. The company Faurecia (Changshu) Automotive System Co., Ltd in China, fully consolidated, is being held at 60% vs initially at 55% since October 2022.
For the Electronics perimeter, in Mexico, the company Hitachi Automotive Systems San Juan Del Rio, S.A. de C.V held at 20% and consolidated in equity method had been sold in June 2022. In China, the company Changchun FAWSN Faurecia Cockpit of Future System Co., Ltd in China, has been acquired in July 2022 at 50% and is fully consolidated and the company Faurecia Clarion (Wuhan) has been created and is fully consolidated since September 2022, it is held at 100%.
Within the Lighting perimeter, the company HBPO Beteiligungsgesellschaft mbH in Germany, consolidated in equity method with a share of 27% since February 2022 following HELLA acquisition (see 2.1) has been sold in December 2022.
2.3Disposal of Acoustic Soft Trim
On October 31, 2021, Faurecia sold to the group Adler its business Acoustic Soft Trim, which manufactures and sells acoustic products and soft trims, with eight plants and one R&D center, all based in Europe, within the Interiors segment. An expert has been nominated to determine any potential price adjustments based on Acoustic Soft Trim accounts on transaction date; no significant impact is expected on Group financial statements.
2.4Reminder of change in scope of consolidation introduced in 2021
Within the Clean Mobility perimeter, in China the company Kaishi Faurecia Aftertreatment Control Technologies Co., Ltd has been acquired at 35% in March 2021 and is consolidated by equity method and the company Faurecia CLD Safety Technology (Shenyang) Co., Ltd has been acquired in May 2021 at 65% and is fully consolidated. The company Hongtai Faurecia Composite (Wuhan) Co. Ltd, consolidated by equity method and held at 50%, has been sold in June 2021. In Indonesia, the company PT Faurecia Clean Mobility Indonesia held at 100%, has been created in September 2021 and is fully consolidated. In October 2021, Faurecia has acquired the remaining shares of Faurecia Metalloprodukcia Holding, already held at 70% and fully consolidated. The company’s name is now Faurecia Exhaust Russia Holding.
For Clarion Electronics perimeter, in Sweden, the company Faurecia Créo, held at 78.5% is now held at 100% and is fully consolidated. In Malaysia, the company Crystal Precision Sdn, Bhd previously held at 86.25% and fully consolidated, was held at 30% in June 2021 and consolidated by equity method during the first half year 2021, has been progressively sold between July and December 2021.
Within Seating perimeter, the company Faurecia (Shanghai) Automotive Component Co. Ltd, has been created in February 2021 and is fully consolidated.
The company Faurecia Ré has been acquired at 100% in Luxembourg in May 2021; it is fully consolidated and will be used to manage the insurance policies of the Group.
2.5Recent events
Economical context linked to Covid-19, shortage of electronics components and military conflict in Ukraine
In 2022, worldwide automotive production grew by 6.7% vs. 2021, from 77.2 million LVs in 2021 to 82.4 million LVs in 2022. It remains significantly below the 89.0 million LVs recorded in 2019, before the Covid crisis. The first-half of the year was down 1.1% year-on-year, mostly impacted by Q1 (down 3.5% vs. Q1 2021) that recorded the outbreak of the war in Ukraine in February, while the second half was up 14.8%, mostly reflecting the very low base of comparison of Q3 2021.
It was penalized by Stop and Gos from OEMs consequent to supply chain disruptions due to the war in Ukraine, by the continued shortage of semiconductors and the Covid developments in China :
- ■China was strongly penalized by the Covid-related restrictions implemented in April and May (Q2 2022 automotive production in China was down 4.7% year-on-year) and then by the increase in Covid cases late 2022, after the decision to end the zero Covid policy (Q4 2022 automotive production in China was down 5.5% year-on-year).
- ■Europe was strongly impacted by Stop & Gos related to supply chain disruptions due to the war in Ukraine and the continuous shortage of semiconductors with H1 2022 automotive production in Europe down 11.3% year-on-year vs. H1 2021, of which 17.5% in Q1 2022,
- ■shortage of semiconductors for the automotive industry continued throughout the year and could gradually ease in 2023, while it is unlikely to resolve entirely before 2024.
- ■lastly, from a macroeconomic standpoint, 2022 has been characterized by additional challenges: high inflation has broadened out across countries, energy supply risks have pushed prices up and interest rates have risen to curb inflation.
As regards to the Group’s very limited activity in Russia (sales represented 0.4% of total consolidated sales in 2022 vs. 1.4% in 2021), due to the war in Ukraine, OEMs’ decisions regarding their operations in Russia and the uncertain and complex environment, Faurecia has decided to disengage from Russia and has depreciated related assets in 2022. The detailed accounting impacts are described in note 6. The group is not present in Ukraine.
Note 3Post-balance sheet events
Faurecia has issued on February 1st, 2023 €250 million of New Notes, sustainability-linked 7.25% senior notes due 2026. The proceeds of the issuance of the New Notes was used to fully reimburse the Bridge-to-Bond and the Bridge-to-Equity in connection with the HELLA acquisition (see note 26.3) and for general corporate purposes.
Faurecia has entered in February 2023 into exclusive negotiations with Cummins for the potential sale of a part of its Commercial Vehicle exhaust aftertreatment business. The potential transaction would be subject to customary conditions precedents, including regulatory approvals and completion of applicable employee representative consultations.
Faurecia has announced mid February 2023 to have signed with the Motherson Group an agreement by which Motherson commits to acquire Faurecia SAS Cockpit Modules division (assembly and logistics services), reported as part of its Interiors Segment, for an enterprise value of €540 million. The transaction will be subject to customary conditions precedents, including regulatory approvals.
Note 4Information by operating segment
The Group is structured into business units based on the nature of the products and services offered. Following the integration of HELLA activities, acquired on January 31, 2022 (see note 2.1) and the consequent group organization, the group business units are presented as follows.
- ■Seating (design and manufacture of complete vehicle seats, seating frames and adjustment mechanisms);
- ■Interiors (design, manufacture and assembly of instrument panels and complete cockpits, door panels and modules);
- ■Clean Mobility (design and manufacture of exhaust systems, solutions for fuel cell electric vehicles, and aftertreatment solutions for commercial vehicles);
- ■Electronics (design and manufacture of display technologies, driver assistance systems and cockpit electronics), which includes HELLA Electronics and Clarion Electronics;
- ■Lighting (design and manufacture of lighting technologies);
- ■Lifecycle solutions (solutions extending the vehicle lifecycle as well as workshop equipment and special original equipment).
These business units are managed by the Group on an independent basis in terms of reviewing their individual performance and allocating resources. The tables below show reconciliation between the indicators used to measure the performance of each segment –notably operating income (before amortization of acquired intangible assets) – and the consolidated financial statements. Borrowings, other operating income and expense, financial income and expenses, and taxes are monitored at the Group level and are not allocated to the various segments. A review of the useful life for the fixed assets has been performed in regard to the climate changes and its regulatory consequences as known at the closing date, more specifically for the Clean Mobility segment, and has not enabled to identify any significant impact for the Group.
4.1Accounting principles
Revenue on parts is recognized when the control is transferred to the customer, incidental to ownership of the modules or parts produced. This generally corresponds to when the goods are shipped.
Revenue on tooling is generally recognized at the transfer of control of these tooling to the customer, usually shortly before serial production starts. Development costs are generally recognized as set up costs for the serial parts production and capitalized, they are then not considered as a revenue distinct from product sales, except specific cases depending on the contract with the customer.
Faurecia operates as an agent for monoliths sales, as well as for some cockpit components, these sales are then recorded at net value in the income statement.
Operating margin (before amortization of acquired intangible assets) is the Faurecia group’s principal performance indicator. It corresponds to net income of the fully consolidated companies before:
- ■the amortization of intangible assets acquired in business combinations (customer relationship…);
- ■other non-recurring operating income and expenses, corresponding to material, unusual and non-recurring items including reorganization costs and early retirement costs, the impact of exceptional events such as the discontinuation of a business, the closure of an industrial site, disposals of non-operating buildings, impairment losses and reversals recorded for property, plant and equipment or intangible assets, as well as other material and unusual losses;
- ■income on loans, cash investments and marketable securities;
- ■finance costs, including finance costs on lease liabilities;
- ■other financial income and expenses, which include the impact of discounting the pension benefit obligation and the return on related plan assets, the ineffective portion of interest rate and currency hedges, changes in value of interest rate and currency instruments for which the hedging relationship does not satisfy the criteria set forth in IFRS 9, and gains and losses on sales of shares in subsidiaries;
- ■taxes.
4.2Key figures by operating segment
Full-Year 2022
(in € million) |
Seating |
Interiors |
Clean Mobility |
Electronics |
Lighting |
Lifecycle solutions |
Other |
Total |
---|---|---|---|---|---|---|---|---|
TOTAL SALES |
7,750.1 |
5,595.5 |
4,754.1 |
3,806.9 |
3,096.1 |
902.7 |
199.2 |
26,104.6 |
Inter-segment eliminations |
(45.8) |
(66.0) |
(18.4) |
(285.0) |
(22.1) |
(9.8) |
(199.2) |
(646.4) |
Consolidated sales |
7,704.3 |
5,529.5 |
4,735.7 |
3,521.7 |
3,074.0 |
893.0 |
0.0 |
25,458.2 |
Operating income (before amortization |
197.0 |
245.7 |
336.3 |
140.8 |
106.5 |
88.5 |
0.0 |
1,114.9 |
Amortization of intangible assets acquired |
|
|
|
|
|
|
|
(218.6) |
Operating income (after amortization |
|
|
|
|
|
|
|
896.3 |
Other non-recurring operating income |
|
|
|
|
|
|
|
1.8 |
Other non-recurring operating expenses |
|
|
|
|
|
|
|
(451.0) |
Finance costs, net |
|
|
|
|
|
|
|
(333.7) |
Other financial income and expenses |
|
|
|
|
|
|
|
(188.9) |
Corporate income tax |
|
|
|
|
|
|
|
(186.3) |
Share of net income of associates |
|
|
|
|
|
|
|
11.4 |
Net income (loss) |
|
|
|
|
|
|
|
(250.3) |
Segment assets |
5,246.6 |
5,040.9 |
4,993.7 |
5,979.9 |
3,064.3 |
1,317.3 |
553.6 |
26,196.4 |
Net property, plant and equipment |
898.5 |
860.7 |
890.9 |
1,179.2 |
975.2 |
134.3 |
117.0 |
5,055.8 |
Right-of-use assets |
259.6 |
400.2 |
219.7 |
71.6 |
64.3 |
13.5 |
154.7 |
1,183.5 |
Other segment assets |
4,088.5 |
3,780.0 |
3,883.1 |
4,729.2 |
2,024.8 |
1,169.6 |
282.0 |
19,957.1 |
Investments in associates |
|
|
|
|
|
|
|
333.9 |
Other equity interests |
|
|
|
|
|
|
|
128.5 |
Short and long-term financial assets |
|
|
|
|
|
|
|
4,573.2 |
Tax assets (current and deferred) |
|
|
|
|
|
|
|
986.3 |
Total assets |
|
|
|
|
|
|
|
32,218.4 |
Segment liabilities |
2,845.2 |
2,951.4 |
3,830.4 |
1,409.2 |
1,486.3 |
229.1 |
597.3 |
13,348.8 |
Borrowings |
|
|
|
|
|
|
|
10,879.9 |
Lease liabilities |
|
|
|
|
|
|
|
1,301.0 |
Tax liabilities (current and deferred) |
|
|
|
|
|
|
|
449.5 |
Equity and minority interests |
|
|
|
|
|
|
|
6,239.1 |
Total liabilities |
|
|
|
|
|
|
|
32,218.4 |
Capital expenditure |
226.4 |
207.3 |
132.0 |
270.3 |
270.8 |
33.2 |
26.7 |
1,166.7 |
Depreciation of property, plant and equipment |
(155.7) |
(183.2) |
(171.7) |
(189.7) |
(178.4) |
(17.1) |
(22.8) |
(918.8) |
Depreciation of Right-of-use assets |
(71.4) |
(81.8) |
(50.9) |
(22.0) |
(11.3) |
(4.5) |
(22.4) |
(264.2) |
Impairment of property, plant and equipment |
(10.1) |
(13.7) |
(17.9) |
(2.8) |
0.0 |
0.0 |
(11.7) |
(56.1) |
Headcounts |
45,052 |
38,602 |
20,462 |
19,817 |
22,779 |
4,870 |
5,878 |
157,460 |
Full-Year 2021
(in € million) |
Seating |
Interiors |
Clean Mobility |
Electronics |
Other |
Total |
---|---|---|---|---|---|---|
Total sales |
6,091.2 |
4,706.3 |
4,101.4 |
842.0 |
124.5 |
15,865.5 |
Inter-segment eliminations |
(42.5) |
(65.7) |
(10.5) |
(4.4) |
(124.5) |
(247.7) |
Consolidated sales |
6,048.7 |
4,640.6 |
4,090.8 |
837.6 |
0.0 |
15,617.8 |
Operating income (before amortization |
284.8 |
189.9 |
388.7 |
(1.7) |
0.0 |
861.7 |
Amortization of intangible assets acquired |
|
|
|
|
|
(92.6) |
Operating income (after amortization |
|
|
|
|
|
769.1 |
Other non-recurring operating income |
|
|
|
|
|
6.0 |
Other non-recurring operating expenses |
|
|
|
|
|
(244.5) |
Finance costs, net |
|
|
|
|
|
(207.3) |
Other financial income and expenses |
|
|
|
|
|
(47.2) |
Corporate income tax |
|
|
|
|
|
(138.8) |
Share of net income of associates |
|
|
|
|
|
(24.6) |
Net income from continued operations |
|
|
|
|
|
112.7 |
Net income from discontinued operations |
|
|
|
|
|
(96.5) |
Net income (loss) |
|
|
|
|
|
16.2 |
Segment assets |
4,508.8 |
4,282.5 |
4,887.3 |
1,599.2 |
313.4 |
15,590.9 |
Net property, plant and equipment |
837.2 |
839.7 |
935.0 |
138.6 |
52.1 |
2,802.4 |
Right-of-use assets |
242.2 |
346.5 |
234.2 |
48.0 |
80.0 |
950.9 |
Other segment assets |
3,429.3 |
3,096.2 |
3,718.1 |
1,412.6 |
181.3 |
11,837.6 |
Investments in associates |
|
|
|
|
|
150.8 |
Other equity interests |
|
|
|
|
|
88.0 |
Short and long-term financial assets |
|
|
|
|
|
5,093.0 |
Tax assets (current and deferred) |
|
|
|
|
|
752.0 |
Total assets |
|
|
|
|
|
21,674.9 |
Segment liabilities |
2,392.9 |
2,633.0 |
3,633.5 |
513.4 |
248.1 |
9,420.6 |
Borrowings |
|
|
|
|
|
7,352.4 |
Lease liabilities |
|
|
|
|
|
1,031.9 |
Tax liabilities (current and deferred) |
|
|
|
|
|
54.4 |
Equity and minority interests |
|
|
|
|
|
3,815.4 |
Total liabilities |
|
|
|
|
|
21,674.9 |
Capital expenditure |
173.4 |
178.3 |
143.1 |
20.4 |
13.5 |
528.6 |
Depreciation of property, plant and |
(140.7) |
(175.5) |
(160.4) |
(19.4) |
(6.9) |
(502.9) |
Depreciation of Right-of-use assets |
(66.5) |
(73.8) |
(47.4) |
(13.2) |
(14.3) |
(215.3) |
Impairment of property, plant and |
(3.6) |
(26.0) |
(5.1) |
(2.9) |
0.0 |
(37.6) |
Headcounts |
44,131 |
36,792 |
20,954 |
6,042 |
3,221 |
111,140 |
4.3Sales by operating segment
4.4Sales by major customer
(in € million) |
2022 |
2021 |
||
Consolidated Sales |
% |
Consolidated Sales |
% |
|
VW Group |
3,926.3 |
15 |
2,493.0 |
16 |
Stellantis |
2,982.3 |
12 |
2,503.3 |
16 |
Ford Group |
1,969.9 |
8 |
1,504.4 |
10 |
Renault-Nissan |
1,585.6 |
6 |
1,192.8 |
8 |
Daimler |
1,555.7 |
6 |
539.8 |
3 |
Global vehicule company |
1,423.1 |
6 |
603.3 |
4 |
GM |
1,293.7 |
5 |
677.2 |
4 |
Others |
10,721.5 |
42 |
6,103.9 |
39 |
Total |
25,458.2 |
100 |
15,617.8 |
100 |
* The presentation of sales invoiced may differ from that of sales by end customer when products are transferred to intermediary assembly companies. |
4.5Key figures by geographic area
Sales are broken down by destination region. Other items are presented by the region where the companies involved operate:
2022
(in € million) |
France |
Germany |
Other |
Americas |
Asia |
Other countries |
Total |
---|---|---|---|---|---|---|---|
Consolidated Sales |
1,578.3 |
2,771.7 |
6,815.2 |
7,151.4 |
6,795.3 |
346.3 |
25,458.2 |
Net property, plant and equipment |
343.5 |
806.0 |
1,621.7 |
1,160.5 |
1,083.8 |
40.3 |
5,055.8 |
Right-of-use assets |
195.9 |
147.4 |
286.9 |
391.8 |
154.6 |
7.0 |
1,183.5 |
Capital expenditure |
78.7 |
149.2 |
378.8 |
287.0 |
258.8 |
14.2 |
1,166.7 |
Headcounts as of December 31 |
11,303 |
15,030 |
53,530 |
34,674 |
40,795 |
2,128 |
157,460 |
2021
(in € million) |
France |
Germany |
Other |
Americas |
Asia |
Other countries |
Total |
---|---|---|---|---|---|---|---|
Consolidated Sales |
1,498.8 |
1,077.2 |
4,420.1 |
4,268.1 |
4,166.5 |
187.1 |
15,617.8 |
Net property, plant and equipment |
352.8 |
121.8 |
840.1 |
778.8 |
683.6 |
25.2 |
2,802.4 |
Right-of-use assets |
191.0 |
46.2 |
244.7 |
309.9 |
153.3 |
5.9 |
950.9 |
Capital expenditure |
88.6 |
28.4 |
154.5 |
132.8 |
116.0 |
8.3 |
528.6 |
Headcounts as of December 31 |
10,513 |
5,261 |
36,690 |
26,434 |
30,907 |
1,335 |
111,140 |
Note 5Analysis of operating expenses
5.1Analysis of operating expenses by function
5.2Analysis of operating expenses by nature
(in € million) |
2022 |
2021 |
---|---|---|
Purchases consumed |
(15,383.6) |
(9,185.2) |
External costs |
(2,826.3) |
(1,682.3) |
Personnel costs |
(5,486.6) |
(3,523.1) |
Taxes other than on income |
(65.6) |
(51.3) |
Other income and expenses |
1,239.7 |
894.8 |
Depreciation, amortization and provisions for impairment in value of non-current assets |
(1,897.0) |
(1,247.9) |
Charges to and reversals of provisions |
76.0 |
38.9 |
Total |
(24,343.3) |
(14,756.1) |
5.3Personnel costs
Details of expenses relating to the Group’s free shares plans and pension costs are provided in Notes 22.2 and 25, respectively.
5.4Research and development costs
Development costs are usually capitalized in intangible assets as they are considered as set up costs for the serial parts production, and then amortized to match the quantities of parts delivered to the customer, over a period not exceeding five years except under exceptional circumstances. For some specific contracts where the developments works are a separate performance obligation under IFRS 15, the corresponding costs comply with the definition of work in progress and are capitalized in inventory. These inventories are then expensed (cost of sales) when the corresponding revenue is recognized.
The development costs recognized in the cost of sales (stock decrease and R&D assets depreciation) amount to €881.9 million as of December 31, 2022, vs €701.0 million as of December 31, 2021.
5.5Depreciation, amortization and provisions for impairment in value of non-current assets
(in € million) |
2022 |
2021 |
---|---|---|
Amortization of capitalized development costs |
(680.0) |
(507.0) |
Provisions for impairment of capitalized development costs |
(7.2) |
19.5 |
Amortization of other intangible assets |
(43.5) |
(42.6) |
Depreciation of specific tooling |
(10.1) |
(10.7) |
Depreciation and impairment of other property, plant and equipment |
(892.0) |
(491.8) |
Depreciation of Right-of-use assets |
(264.2) |
(215.3) |
Total |
(1,897.0) |
(1,247.9) |
Note 6Other non-recurring operating income and expenses
Other non-recurring operating income
Other non-recurring operating expenses
(in € million) |
2022 |
2021 |
---|---|---|
Other provisions for impaiment of assets |
0.0 |
0.0 |
Reorganization expenses (1)(3) |
(351.8) |
(196.3) |
Impairment of goodwill |
0.0 |
0.0 |
Losses on disposal of assets |
0.0 |
0.0 |
Others (2)(3) |
(99.2) |
(48.2) |
Total |
(451.0) |
(244.5) |
(1) As of December 31, 2022, this item includes restructuring costs in the amount of €207.7 million and provisions for impairment in value of assets in the amount of €144.1 million versus €137.6 million and €58.7 million as of December 31, 2021. (2) Of which €43.0 million of costs linked to the acquisition and integration of HELLA as of December 31, 2022 and €25.6 million as of December 31, 2021. (3) The costs linked to reduction of activities in Russia amounted to €130.3 million as of December 31, 2022 of which €103.9 million of reorganization expenses and €26.4 million of others. |
Restructuring
Reorganization costs (€351.8 million) include redundancy and site relocation payments for 3,306 people.
Note 7Finance costs and Other financial income and expenses
7.1Finance costs
7.2Other financial income and expenses
(in € million) |
2022 |
2021 |
---|---|---|
Impact of discounting pension benefit obligations |
(11.3) |
(4.5) |
Changes in the ineffective portion of currency hedges |
(0.3) |
0.2 |
Changes in fair value of currency hedged relating to debt |
(1.1) |
0.6 |
Foreign exchange gains and losses on borrowings |
(43.5) |
(1.9) |
Hyperinflation impact (Argentina-Turkey) |
(40.8) |
(11.5) |
Others* (1) |
(91.9) |
(30.1) |
Total |
(188.9) |
(47.2) |
* This item includes amortization of costs related to long-term debts and commissions for non-use of the credit facility. (1) Of which €34.3 million of financial costs linked to the acquisition of HELLA vs. €11.4 million in 2021. |
Note 8Corporate income tax
Deferred taxes are recognized using the liability method for temporary differences arising between the tax bases for assets and liabilities and their carrying amounts on the consolidated financial statements. Temporary differences mainly arise from tax loss carryforwards and consolidation adjustments to subsidiaries’ accounts.
Deferred taxes are measured using tax rates (and laws) that have been enacted or substantially enacted at the balance sheet date.
Deferred income tax assets are recognized only to the extent that it is probable that future taxable profit will be available in the short or medium term against which the temporary differences or the loss carry forward can be utilized, based on the Group’s forecasts.
Deferred tax liabilities are accounted for every taxable temporary differences in relation with investment in subsidiaries, joint ventures and associates unless the Group has the capacity to control the timing of the reversal of temporary differences and if it is probable that they will not be reversed in a predictable future.
In compliance with IFRIC 23, accruals for risk on income tax are part of the income tax within the statement of comprehensive income and of income tax payables within the balance sheet (Note 28).
8.1Analysis of the tax charge
The effective corporate income tax charge can be reconciled with the theoretical tax charge as follows:
(in € million) |
2022 |
2021 |
---|---|---|
Pre-tax income of consolidated companies |
(75.5) |
276.1 |
Theoritical Tax (25.83% in 2022 vs 28.41% in 2021) |
19.5 |
(78.4) |
Effect of rate changes on deferred taxes recognized on the balance sheet |
(1.2) |
(0.2) |
Effect of local rate differences* |
46.5 |
26.6 |
Tax credits |
7.0 |
2.5 |
Change in unrecognized deferred tax |
(165.7) |
(91.4) |
Permanent differences & others** |
(92.4) |
2.2 |
Corporate tax recognized |
(186.3) |
(138.8) |
* The impact of local rate differences mainly relates to Chinese and German entities. ** Mainly due to withholding tax. |
|
|
8.2Analysis of tax assets and liabilities
The Group considers the recovery of the deferred tax net balance as at December 31, 2022, i.e. €300.1 million, as probable.
(in € million) |
2022 |
2021 |
---|---|---|
Amount as at the beginning of the year |
496.5 |
393.4 |
|
181.4 |
95.0 |
|
(75.4) |
(9.0) |
|
(14.9) |
27.2 |
|
(287.5) |
(10.1) |
Amount as at the end of the year |
300.1 |
496.5 |
* Mainly related to actuarial gains and losses directly recognized in equity. |
|
|
8.3Deferred tax assets and liabilities by nature
(in € million) |
2022 |
2021 |
---|---|---|
Tax asset carryforwards |
221.9 |
157.0 |
Intangible assets |
(631.9) |
(245.6) |
Other tangible assets and long-term assets |
20.4 |
68.2 |
Pensions |
103.0 |
85.2 |
Other reserves |
38.1 |
8.2 |
Stocks |
229.4 |
199.0 |
Other working capital |
319.2 |
224.5 |
Total |
300.1 |
496.5 |
of which deferred tax assets |
690.5 |
540.6 |
of which deferred tax liabilities |
(390.4) |
(44.1) |
8.4Impairment of tax asset carryforwards
Note 9Earnings per share
Basic earnings per share are calculated by dividing net income attributable to owners of the parent by the weighted average number of shares outstanding during the year, excluding treasury stock. For the purpose of calculating diluted earnings per share, the Group adjusts net income attributable to owners of the parent and the weighted average number of shares outstanding for the effects of all dilutive potential ordinary shares (including stock options, free shares and convertible bonds).
|
2022 |
2021 |
---|---|---|
Number of shares outstanding at year-end (1) |
197,089,340 |
138,035,801 |
Adjustments: |
|
|
|
(84,171) |
(84,171) |
|
(23,332,976) |
0 |
Weighted average number of shares before dilution |
173,672,193 |
137,951,630 |
Weighted impact of dilutive instruments: |
|
|
|
81,117 |
0 |
|
|
0 |
Weighted average number of shares after dilution |
173,753,310 |
137,951,630 |
(1) Changes in the number of shares outstanding as of December 31, 2022, are analyzed as follows: |
||
As of December 31, 2021: Number of Faurecia shares outstanding |
138,035,801 |
|
Change of number of shares |
59,053,539 |
|
As of December 31, 2022: Number of Faurecia shares outstanding |
197,089,340 |
|
In relation to stock options, this method consists of comparing the number of shares that would have been issued if all outstanding stock options had been exercised to the number of shares that could have been acquired at fair value.
The potentially dilutive impact of free shares is taken into account considering the number of shares to be distributed for the plans of which the realization of the performance conditions has already been stated by the Board.
Earnings per share
|
2022 |
2021 |
---|---|---|
Net Income (loss) (in € million) |
(381.8) |
(78.8) |
Basic earnings (loss) per share |
(2.20) |
(0.57) |
After dilution |
(2.20) |
(0.57) |
Net Income (loss) from continued operations (in € million) |
(381.8) |
17.7 |
Basic earnings (loss) per share |
(2.20) |
0.13 |
After dilution |
(2.20) |
0.13 |
Net Income (loss) from discontinued operations (in € million) |
0.0 |
(96.5) |
Basic earnings (loss) per share |
NA |
(0.70) |
After dilution |
NA |
(0.70) |
Note 10ABusiness Combination – HELLA
Following approval from the appropriate regulatory bodies, Faurecia, through its subsidiary Forvia Germany GmbH, has acquired 79.5% of the HELLA shares on January 31, 2022 and through additional acquisitions on the market, holds 81.6% of HELLA shares as of December 31, 2022 (see Note 2.1) for a total amount of €5.4 billion and has the exclusive control over HELLA. Minority interests represent 18.4% of HELLA shares. The €5.4 billion are composed of €4 billion of consideration transferred to the family pool (€3.5 billion of cash and €0.5 billion of Faurecia shares), €1.3 billion of cash paid for the tender offer on the 19.5% and €0.1 billion of cash paid for the acquisition of additional shares on the market and from the family.
HELLA is a major automotive supplier, which develops and manufactures lighting technology and electronics components and systems for the automotive industry. The Group’s production and manufacturing sites are located across the globe; its most significant markets are in Europe, the USA and Asia, particularly China. The Company is listed on the Frankfort stock exchange and is based in Lippstadt, Germany. HELLA has achieved in its fiscal year 2021 €6,380 million sales and was employing 36,500 employees.
The one-year period during which the amounts of assets acquired and liabilities assumed and the related goodwill may be amended has ended on January 31, 2023. Out of the initial purchase price for a 100% basis of €6,714.1 million; €3,700.0 million have been allocated to the net assets acquired, specifically to technology for €658 million, trademark for €233 million and customer relationships for €379 million, and €3,014.0 million to the goodwill, mainly representing the expected synergies of HELLA integration and the new market opportunities.
HELLA accounts have been included in the consolidated financial statements since February 1, 2022. HELLA total contribution to Faurecia’s consolidated revenue and operating income (before amortization of acquired intangible assets) was respectively €6,512.1 million and €345.9 million for the year 2022. Would HELLA have been consolidated from January 1, 2022, its contribution based on a pro rata temporis of the 11 last consolidated months would amount to €7,104.1 million to the consolidated revenue and €377.4 million to the operating income (before amortization of acquired intangible assets).
The table below shows a breakdown of the fair value of HELLA assets acquired and liabilities assumed:
(in € million) |
Fair Values |
---|---|
Intangible assets |
1,779.7 |
Property, plant and equipment |
2,047.7 |
Right-of-use assets |
127.1 |
Other non-current assets |
705.9 |
Total non-current assets |
4,660.4 |
Inventories, net |
1,065.2 |
Trade accounts receivable |
1,105.3 |
Other Current assets |
1,321.2 |
O/w deferred tax assets |
310.4 |
Cash & cash equivalent |
233.8 |
Total current assets |
3,725.6 |
Total assets |
8,386.0 |
Other non-current liabilities |
0.0 |
Non-current provisions |
399.0 |
Non-current financial liabilities |
1,289.9 |
Non-current lease liabilities |
127.4 |
Total non-current liabilities |
1,816.4 |
Trade payables |
1,182.0 |
Current liabilities |
1,646.1 |
o/w deferred tax liabilities |
598.3 |
Current financial liabilities |
14.3 |
Current portion of lease liabilities |
27.2 |
Total current liabilities |
2,869.6 |
Total liabilities |
4,685.9 |
Net acquired assets |
3,700.0 |
Goodwill |
3,014.0 |
o/w attributable to minority interests |
587.7 |
Acquisition cost at 100% |
6,714.1 |
o/w consideration transferred |
5,442.9 |
o/w fair value of minority interests |
1,271.2 |
The costs linked to the acquisition and integration of HELLA are booked in "Other non-recurring operating expenses" for €43.0 million in 2022 v.s. €25.6 million in 2021 (see note 6) and in "Other financial income and expenses" for €34.3 million in 2022 v.s. €11.4 million in 2021 (see note 7).
Note 10BGoodwill
In case of a business combination, the aggregate value of the acquisition is allocated to the identifiable assets acquired and liabilities assumed based on their fair value determined at their acquisition date.
A goodwill is recognized when the aggregate of the consideration transferred and the amount of any non-controlling interest in the acquiree exceed the net of the acquisition-date amounts of the identifiable assets acquired and the liabilities assumed. In accordance with IAS 36, goodwill is not amortized but is tested for impairment at least once a year and more often if there is an indication that it may be impaired. For the purpose of impairment testing, goodwill is allocated to cash-generating units (CGUs). A CGU is defined as the smallest identifiable group of assets that generates cash inflows that are largely independent of the cash inflows from other assets or groups of assets.
The CGU to which goodwill is allocated represents the level within the operating segment at which goodwill is monitored for internal management purposes. The Group has identified the following CGUs:
The carrying amount of assets and liabilities thus grouped is compared to the higher of its market value and value in use, which is equal to the present value of the net future cash flows expected, and their net market value including costs of disposal.
(in € million) |
Gross |
Impairment |
Net |
---|---|---|---|
Amount as of January 1, 2021 |
2,856.4 |
(660.5) |
2,195.9 |
Acquisitions |
28.4 |
0.0 |
28.4 |
Provision for impairment |
0.0 |
(0.0) |
(0.0) |
Translation adjustments and other movements |
11.9 |
0.0 |
11.9 |
Amount as of December 31, 2021 |
2,896.7 |
(660.5) |
2,236.2 |
Acquisitions |
3,014.0 |
0.0 |
3,014.0 |
Provision for impairment |
0.0 |
0.0 |
0.0 |
Translation adjustments and other movements |
10.2 |
(0.1) |
10.1 |
Amount as of December 31, 2022 |
5,920.9 |
(660.6) |
5,260.3 |
Cash-generating units and impairment tests
Impairment tests are carried out whenever there is an indication that an asset may be impaired and at least once a year. Impairment testing consists of comparing the carrying amount of an asset, or group of assets, with the higher of its market value and value in use. Value in use is defined as the present value of the net future cash flows expected to be derived from an asset or group of assets.
The assets are grouped at the lowest levels for which there are separately identifiable cash flows (cash-generating units, or CGUs).
Impairment tests are performed on each group of intangible assets (development costs) and property, plant and equipment attributable to a customer contract. This is done by comparing the aggregate carrying amount of the Group of assets concerned with the present value of the expected net future cash flows to be derived from the contract.
An impairment loss is recorded when the assets’ carrying amount is higher than the present value of the expected net future cash flows. A provision is then recorded for losses to completion on loss-making contracts in compliance with IAS 37.
In case of a triggering event, impairment testing is also carried out on general and corporate assets grouped primarily by type of product and geographic area.
The cash inflows generated by the assets allocated to these CGUs are largely interdependent due to the high overlap among various manufacturing flows, optimization of capacity utilization, and centralization of research and development activities.
Within the frame of the impairment tests of goodwill and group of CGUs, the cash flow forecasts used to calculate value in use were based on the Group’s 2023-2025 forecasts which were drafted in the second semester of 2022. The volume assumptions used in the strategic plan are based on worldwide automotive market assumptions of 81 million of cars in 2023, 85 million in 2024 and 88 million in 2025, based themselves on external information sources. The impacts of group commitment on carbon neutrality as well as the consequences of governmental policies linked to the global warming are as well part of the assumptions used for these forecasts. In order to take into account the development plan for the activities integrated following HELLA acquisition in 2022, the cash flow forecasts used for Electronics, Lighting and Lifecycle solutions are based on forecasts extended until 2027.
The main assumption affecting value in use is the level of operating income used to calculate future cash flows and particularly the terminal value. The operating margin assumption for 2025 remains above 7% of sales for the Group as a whole.
Projected cash flows for the last year have been projected to infinity by applying a growth rate determined based on analysts’ trend forecasts for the automotive market. The growth rate applied for the 2022 test was 1.4% (1.4% applied at the end of 2021), except for Electronics for which 2% has been considered given the specific development of this segment.
Faurecia called on an independent expert to update the weighted average cost of capital used to discount future cash flows. The market parameters used in the expert’s calculation are based on a sample of companies operating in the automotive supplier sector. Taking into account these parameters and a market risk premium of 7.3% on average, the weighted cost of capital used to discount future cash flows was set at 10.5% (on the basis of a range of values provided by the independent expert) in 2022 (9.3% in 2021). This rate was applied for the impairment tests carried out on all of the groups of CGUs, as they all bear the same specific risks relating to the automotive supplier sector and the CGUs multinational operation does not justify using geographically different discount rates; as a reminder in 2021 a discount rate of 8.3% had been considered except for Clarion Electronics, to take into account a slightly different country exposure, which is no more the case in 2022, the Electronics segment combining this activity with HELLA Electronics.
The table below shows the sensitivity of the impairment test results to changes in the assumptions used as of December 31, 2022 to determine the value in use of the CGUs groups to which the Group’s goodwill is allocated:
Sensitivity (in € million) |
Test income |
Cash flow |
Growth rate |
Operating margin rate for terminal value -0.5 pt |
Combination |
---|---|---|---|---|---|
Seating |
1,229 |
(220) |
(195) |
(273) |
(637) |
Interiors |
865 |
(183) |
(161) |
(218) |
(521) |
Clean Mobility |
1,801 |
(172) |
(151) |
(160) |
(449) |
Electronics |
302 |
(318) |
(251) |
(232) |
(737) |
Lighting |
113 |
(119) |
(91) |
(120) |
(305) |
Lifecycle solutions |
212 |
(72) |
(54) |
(36) |
(152) |
Note 11 Intangible assets
Note 11Intangible assets
A.Research and development expenditure
The Faurecia group incurs certain development costs in connection with producing and delivering modules for specific customer orders which are considered as set up costs for the serial parts production and capitalized. In accordance with IAS 38, these development costs are recorded as an intangible asset where the Company concerned can demonstrate:
- ■its intention to complete the project as well as the availability of adequate technical and financial resources to do so;
- ■how the customer contract will generate probable future economic benefits and the Company’s ability to measure these reliably;
- ■its ability to reliably measure the expenditure attributable to the contracts concerned (costs to completion).
These capitalized costs are amortized to match the quantities of parts delivered to the customer, over a period not exceeding five years except under exceptional circumstances.
Research costs, and development costs that do not meet the above criteria, are expensed as incurred.
B.Other intangible assets
Other intangible assets include development and purchase costs relating to software used within the Group –which are amortized on a straight-line basis over a period of between one and three years– as well as patents and licenses, and the intangible assets acquired in business combinations (customer relationship…); these assets are amortized on the corresponding contracts duration.
(in € million) |
Development costs |
Software |
Intangible |
Total |
---|---|---|---|---|
Amount as of January 1, 2021 |
2,059.7 |
74.2 |
534.1 |
2,668.0 |
Additions |
671.7 |
5.6 |
0.0 |
677.3 |
Depreciation and amortization |
(507.0) |
(42.6) |
(92.6) |
(642.2) |
Funding of provisions |
19.5 |
0.0 |
0.0 |
19.5 |
Translation adjustments and other |
24.5 |
29.0 |
24.2 |
77.8 |
Amount as of December 31, 2021 |
2,268.4 |
66.2 |
465.8 |
2,800.4 |
Additions |
969.1 |
18.7 |
0.0 |
987.8 |
Depreciation and amortization |
(680.0) |
(40.7) |
(218.6) |
(939.3) |
Funding of provisions |
(45.4) |
(0.5) |
0.0 |
(45.9) |
Translation adjustments and other |
486.5 |
45.6 |
1,255.0 * |
1,787.1 |
Amount as of December 31, 2022 |
2,998.6 |
89.3 |
1,502.1 |
4,590.1 |
* see note 10A. |
|
|
|
|
The book value of development costs allocated to a customer contract as well as the associated specific tooling is compared to the present value of the expected net future cash flows to be derived from the contract based on the best possible estimate of future sales. The volumes taken into account in Faurecia’s Business Plans are the best estimates by the Group’s Marketing department based on automakers’ forecasts when available.
Note 12AProperty, plant and equipment
Property, plant and equipment are stated at acquisition cost, or production cost in the case of assets produced by the Group for its own use, less accumulated depreciation.
Maintenance and repair costs are expensed as incurred, except when they increase productivity or prolong the useful life of an asset, in which case they are capitalized.
In accordance with the amended version of IAS 23, borrowing costs on qualifying assets arising subsequent to January 1, 2009 are included in the cost of the assets concerned. The amount is not significant for the period.
Property, plant and equipment are depreciated by the straight-line method over the estimated useful lives of the assets, as follows:
(in € million) |
Land |
Buildings |
Plant, |
Specific tooling |
Other |
Total |
---|---|---|---|---|---|---|
Amount as of January 1, 2021 |
104.3 |
385.1 |
1,742.9 |
28.5 |
552.6 |
2,813.3 |
Additions (including own work capital) |
0.0 |
1.4 |
43.9 |
7.1 |
476.2 |
528.6 |
Disposals |
(6.8) |
(44.7) |
(196.5) |
(27.5) |
(36.7) |
(312.1) |
Depreciation |
(0.5) |
(49.6) |
(392.5) |
(10.7) |
(49.6) |
(502.9) |
Non-recurring impairment losses |
(0.6) |
(5.2) |
(30.7) |
0.0 |
(1.2) |
(37.6) |
Depreciation written off on disposals |
1.7 |
39.8 |
190.8 |
27.5 |
34.3 |
294.1 |
Currency translation adjustments |
1.2 |
13.0 |
76.6 |
0.1 |
12.5 |
103.4 |
Scope variations & other movements |
(1.8) |
32.7 |
297.0 |
(0.3) |
(411.8) |
(84.3) |
Amount as of December 31, 2021 |
97.5 |
372.5 |
1,731.5 |
24.5 |
576.4 |
2,802.4 |
Additions (including own work capital) |
0.0 |
14.1 |
193.2 |
6.4 |
952.9 |
1,166.7 |
Disposals |
(3.4) |
(55.0) |
(260.6) |
(36.5) |
(34.3) |
(389.7) |
Funding of depreciation, amortization and impairment provisions |
(0.2) |
(77.4) |
(718.5) |
(10.1) |
(112.5) |
(918.8) |
Non-recurring impairment losses |
(0.0) |
(17.7) |
(27.8) |
(0.0) |
(10.6) |
(56.1) |
Depreciation written off on disposals |
1.2 |
55.2 |
240.9 |
36.5 |
34.7 |
368.6 |
Currency translation adjustments |
(0.1) |
2.6 |
24.3 |
(0.0) |
1.1 |
27.9 |
Scope variations & other movements |
2.5 |
629.1 |
1,601.1 |
0.0 |
(177.9) |
2,054.8 |
Amount as of December 31, 2022 |
97.4 |
923.4 |
2,784.3 |
20.9 |
1,229.8 |
5,055.8 |
(in € million) |
2022 |
2021 |
|||
---|---|---|---|---|---|
Gross |
Depreciation |
Net |
Gross |
Net |
|
Land |
105.3 |
(7.8) |
97.4 |
106.1 |
97.5 |
Buildings |
2,163.9 |
(1,240.4) |
923.4 |
1,076.5 |
372.5 |
Plant, tooling and technical equipment |
9,773.5 |
(6,989.3) |
2,784.3 |
5,007.6 |
1,731.5 |
Specific tooling |
93.3 |
(72.4) |
20.9 |
122,. |
24.5 |
Other property, plant and equipment & property, |
2,132.2 |
(902.5) |
1,229.8 |
962.6 |
576.4 |
Total |
14,268.2 |
(9,212.4) |
5,055.8 |
7,275.2 |
2,802.4 |
Note 12BRight-of-use assets
Lease contracts are accounted for in the balance sheet, through an asset (representing the right to use the leased asset along the contract duration) and a liability (representing the lease future payments obligation), considering the main following principles:
- ■exemption of contracts with a duration less than 12 months or which value is below €5,000 (corresponding lease payments are still expensed along the contract lifetime);
- ■the duration of a contract is equal to its non cancellable duration, except if the Group is reasonably certain to exercise the renewal or cancellation options contractually agreed;
- ■as long as the contract implicit rate can’t be easily determined, the discount rate used is the marginal borrowing rate corresponding to the duration of the lease contract, determined based on the lessee and duration concerned;
- ■as of the effective date (date at which the leased asset is made available by the lessor), lease contracts as defined per IFRS 16 “leases” are accounted for:
- ■as fixed assets (right of use) for the amount of the lease liability, increased by advanced payments made to lessor, initial costs incurred, as well as estimated dismantling or refurbishment costs that would be paid by Faurecia based on contractual terms if needed, and
- ■as lease liability for the amount of discounted lease payment over the contract duration as defined above, using the discount rate defined above,
- ■these right of use are depreciated on a linear basis, on the contract duration or by exception on the utility duration, if this one is shorter or if the contract transfers to the lessee the asset property or if a purchase option exists which is reasonably certain to be exercised by Faurecia,
- ■cash flows related to the sale and lease back operations are included in the cash flows provided by investing activities.
(in € million) |
Land |
Buildings |
Plant and equipment |
Others |
Total |
---|---|---|---|---|---|
Amount as of January 1, 2021 |
0.2 |
761.5 |
73.1 |
78.5 |
913.3 |
New contracts |
0.1 |
123.6 |
31.8 |
41.8 |
197.2 |
Depreciation |
0.0 |
(152.5) |
(22.4) |
(40.4) |
(215.2) |
Funding of impairment provisions |
0.0 |
(1.7) |
0.0 |
(0.1) |
(1.8) |
Scope variations & other movements |
0.0 |
68.1 |
(4.3) |
(6.3) |
57.4 |
Amount as of December 31, 2021 |
0.3 |
799.0 |
78.2 |
73.5 |
950.9 |
New contracts |
0.0 |
256.0 |
20.4 |
55.6 |
332.0 |
Depreciation |
0.0 |
(191.3) |
(26.2) |
(46.7) |
(264.2) |
Funding of impairment provisions |
0.0 |
(5.5) |
0.0 |
(0.4) |
(5.9) |
Scope variations & other movements |
(0.0) |
162.5 |
(0.0) |
8.2 |
170.7 |
Amount as of December 31, 2022 |
0.3 |
1,020.7 |
72.4 |
90.2 |
1,183.5 |
Note 13Investments in associates
As of December 31, 2022
(in € million) |
% interest |
Group share of equity* |
Dividends |
Group share of sales |
Group share of total assets |
---|---|---|---|---|---|
Changchun HELLA Faway Automotive Lighting Co. |
40% |
49.2 |
0.0 |
75.3 |
56.7 |
HELLA MINTH Jiaxing Automotive Parts Co. |
41% |
27.5 |
0.0 |
7.9 |
17.3 |
Behr-HELLA Thermocontrol GmbH |
41% |
54.7 |
0.0 |
232.2 |
196.6 |
FAURECIA-NHK Co., Ltd |
50% |
0.0 |
0.0 |
168.5 |
50.1 |
TEKNIK MALZEME Ticaret Ve Sanayi A.S |
50% |
0.0 |
0.0 |
16.6 |
16.9 |
SYMBIO |
50% |
16.7 |
0.0 |
6.4 |
154.0 |
Total Network Manufacturing LLC |
49% |
0.7 |
0.0 |
103.8 |
28.4 |
DETROIT MANUFACTURING SYSTEMS, LLC |
49% |
0.0 |
(0.5) |
547.6 |
117.2 |
Others |
|
185.0 |
(21.6) |
1,155.5 |
525.8 |
Total |
|
333.9 |
(22.1) |
2,313.7 |
1,163.1 |
* As the Group share of some company’s net equity is negative, it is recorded under liabilities as a provision for contingencies and charges. |
There is no joint operation in the sense of IFRS 11 within the companies consolidated by equity method.
Change in investments in associates
(in € million) |
2022 |
2021 |
---|---|---|
Group share of equity at beginning of period |
150.8 |
177.4 |
Dividends |
(22.1) |
(14.3) |
Share of net income of associates |
11.4 |
(24.6) |
Change in scope of consolidation |
197.8 |
2.0 |
Capital increase |
2.8 |
2.3 |
Currency translation adjustments |
(6.8) |
8.0 |
Group share of equity at end of period |
333.9 |
150.8 |
Note 14Other equity interests
Equity interests correspond to the Group’s interests in the capital of non-consolidated companies. They are subject to impairment testing based on the most appropriate financial analysis criteria. An impairment loss is recognized when appropriate. The criteria generally applied are the Group’s equity in the underlying net assets and the earnings outlook of the company concerned.
(in € million) |
% of share capital |
2022 |
2021 |
|
Gross |
Net |
Net |
||
Changchun Xuyang Industrial Group |
18.8 |
13.2 |
13.2 |
13.5 |
TactoTek Oy |
9.0 |
6.6 |
6.6 |
6.6 |
Guardknox Cyber Technologies Ltd |
7.0 |
5.4 |
5.4 |
5.4 |
Canatu Oy |
8.0 |
7.0 |
7.0 |
7.0 |
SL Corporation |
1.6 |
13.4 |
13.4 |
NA |
HELLA Fast Forward Shanghai Co Ltd |
100.0 |
9.0 |
9.0 |
NA |
Light Field Lab |
4.3 |
9.3 |
9.3 |
NA |
Other |
|
87.0 |
64.7 |
55.6 |
Total |
|
150.7 |
128.5 |
88.0 |
Note 15Other non-current financial assets
Loans and other financial assets are initially stated at fair value and then at amortized cost, calculated using the effective interest method.
Note 16Other non-current assets
Note 17Inventories and work-in-progress
Inventories of raw materials and supplies are stated at cost, determined by the FIFO method (First-In, First-Out).
Finished and semi-finished products, as well as work-in-progress, are stated at production cost, determined by the FIFO method. Production cost includes the cost of materials and supplies as well as direct and indirect production costs, excluding overhead not linked to production and borrowing costs.
Work-in-progress includes the costs of specific tooling produced or purchased specifically for the purpose of manufacturing parts or modules for customer orders and which are sold to the customer, i.e. for which the control is transferred to the customer, usually shortly before serial production starts, and specific development work which is sold to customers and corresponding to the definition of work in progress when the contract enables to consider that these developments are a specific performance obligation under IFRS 15. These costs are expensed (cost of sales) over the period in which the corresponding revenue is recognized, i.e. at transfer of control of these development works to the customer.
Inventories of products for which the Group is considered as agent are presented as contract assets and not in inventories.
Provisions are booked for inventories for which the probable realizable value is lower than cost and for slow moving items.
(in € million) |
2022 |
2021 |
||
Gross |
Depreciations |
Net |
Net |
|
Raw materials and supplies |
1,473.0 |
(188.5) |
1,284.5 |
638.0 |
Engineering, tooling and prototypes |
854.5 |
(29.0) |
825.5 |
605.1 |
Work in progress for production |
109.3 |
(2.9) |
106.4 |
7.8 |
Semi-finished and finished products |
841.5 |
(133.7) |
707.8 |
406.7 |
Total |
3,278.3 |
(354.1) |
2,924.2 |
1,657.6 |
Note 18Trade accounts receivables
Under trade receivables sale programs, the Group can sell a portion of the receivables of a number of its French, German, North America and other subsidiaries to a group of financial institutions, transferring substantially all of the risks and rewards relating to the receivables sold to the financial institutions concerned.
The following table shows the amount of receivables sold with maturities beyond December 31, 2022, for which substantially all the risks and rewards have been transferred, and which have therefore been derecognized, as well as the financing under these programs:
Given the high quality of Group counterparties, late payments do not represent a material risk. They generally arise from administrative issues.
- ■€135.5 million less than one month past due;
- ■€26.3 million between one and two months past due;
- ■€22.8 million between two and three months past due;
- ■€18.6 million between three and six months past due;
- ■€36.3 million more than six months past due.
Note 19Other operating receivables
Note 20Other receivables
In 2022, the receivables Crédit d’Impôt Recherche (CIR) have been sold for an amount of €41.9 million vs €57.2 million in 2021.
Note 21Cash and cash equivalents
Cash and cash equivalents include current account balances in the amount of €3,747.5 million (compared to €2,196.4 million in 2021) and short-term investments in the amount of €453.5 million (compared to €2,709.3 million after depreciation of €0.7 million in 2021), for a total of €4,201.1 million as of December 31, 2022 vs €4,905.7 million as of December 31,2021.
These components include cash at bank, current account balances, marketable securities such as money market and short-term money market funds, deposit and very short-term risk-free securities that are readily sold or converted into cash. Cash equivalents are investments held for the purpose of meeting short term cash commitments and are subject to an insignificant risk of change in value.
Note 22Shareholders’ equity
22.1Capital
As of December 31, 2022, Faurecia capital stock totaled €1,379,625,380 divided into 197,089,340 fully paid-up shares with a par value of €7 each.
Within the frame of the Faurecia share issue paying part of the 60% shares Hella acquisition (cf note 2.1), Faurecia has issued 13,571,385 new shares on January 31, 2022.
As a consequence of the capital increase with preferential subscription rights and which subscription period was open from June 9, 2022 to June 17, 2022 included, 45,482,154 new Faurecia shares have been subscribed with a par value of €15.50, of which 43,521,870 ordinary new shares on a non-reductible basis and 1,960,284 ordinary new shares on a reductible basis.
The Group’s capital is not subject to any external restrictions. Double voting rights are granted to all shares for which a nominative registration can be confirmed, for at least two years in the name of the same shareholder.
22.2Share-based payment
Free share grant
In 2010, Faurecia implemented a share grant plan for executives of Group companies. These shares are subject to service and performance conditions.
In 2021, Faurecia has implemented a unique long term share grant plan (Executive Super Performance Initiative-ESPI) for the members of the Group Executive Committee. The acquisition period is 5 years without conservation condition, and the maximum amount is limited to 300% of the yearly fixed wages. These shares are subject to a service and a performance condition, the Total shareholder Return -TSR, compared to a peer group.
Free shares are measured at fair value by reference to the market price of Faurecia’s shares at the grant date, less an amount corresponding to the expected dividends due on the shares but not paid during the vesting period and an amount reflecting the cost of the shares being subject to a lock-up period. For the ESPI plan, the fair value of the shares includes also an assumption for the achievement of the external performance condition which is frozen at grant date. The fair value is recognized in payroll costs on a straight-line basis over the vesting period, with a corresponding adjustment to equity.
Date of |
Date of Board meeting |
Maximum number |
Performance condition |
share |
Adjustments |
Acquisition date |
sales date (from) |
||
reaching the objective |
exceeding the objective |
dividend rate |
Non-trans- |
||||||
06/26/2020 |
10/22/2020 |
875,069 |
1,138,079 |
2022 after tax income target as stated in strategic plan when granted, Faurecia earning per share growth compared to a reference group of companies and percentage of diversity men-women within the management population |
38.68 |
2.90% |
NA |
10/22/2024 |
10/22/2024 |
05/31/2021 |
10/25/2021 |
1,016,861 |
1,322,794 |
2023 after tax income target as stated in strategic plan when granted, Faurecia earning per share growth compared to a reference group of companies and percentage of diversity men-women within the management population |
42.33 |
3.60% |
NA |
10/25/2025 |
10/25/2025 |
06/01/2022 |
07/28/2022 |
1,765,390 |
2,294,250 |
For the CEO: 2024 after tax income target as stated in strategic plan when granted, Faurecia earning per share growth compared to a reference group of companies and percentage of diversity men-women within the management population |
16.68 |
6.00% |
NA |
07/28/2026 |
07/28/2026 |
05/31/2021 |
07/23/2021 |
445,474 |
445,474 |
ESPI plan: Faurecia share relative performance (TSR) compared to a reference group of companies on a yearly basis; for the CEO, Faurecia share relative performance (TSR) compared to a reference group of companies on average over 5 years (2021-2026) |
39.57 |
3.60% |
NA |
07/23/2026 |
07/23/2026 |
* Net of free shares granted cancelled. |
The performance conditions for the plan attributed by the Board of October 9, 2019 have been partially met, the corresponding shares (81,117), will be distributed in October 2023. For each of the plans presented above, the number of potential free shares has been adjusted following the capital increase in cash performed in June 2022 in compliance with the rules and after approval of the Board, by applying a 1.0788 factor to the initial values.
Other plans
A long-term variable remuneration (long-term incentive, LTI) has been implemented for HELLA Management Board before HELLA acquisition by Faurecia. This long-term incentive is paid in cash. The performance criteria are based on the return on invested capital (RoIC), the income before tax as well as the performance of the HELLA share (total shareholder return). The LTI base amount is determined for the first fiscal year in the calculation period, as a fixed percentage of the annual fixed salary depending on the RoIC; the long-term variable remuneration is based on a calculation period of five fiscal years and payment is made once the calculation period comprising a total of five fiscal years has come to an end. For example, the LTI allocated for the fiscal year 2020/2021 will be paid out at the end of the fiscal year 2024. As these LTI are share-based, their value is recognized according to IFRS 2.
With the exception of one member of the HELLA Management Board, for whom the LTI regulations described above were also applied in the fiscal year 2019/20, LTI allocated for fiscal year 2019/20 do not include the performance of the HELLA share as a performance criteria and their calculation period comprises only a total of four fiscal years.
There are currently 4 plans on going and one additional plan that has vested but not yet been paid out as of December 31, 2022, with the following valuation:
Plan |
Plan |
Grant date |
Vesting date |
Debt as |
---|---|---|---|---|
LTI 19/20 |
(non share based) |
June 1, 2019 |
December 31, 2023 |
0.7 |
LTI 19/20 |
(share-based) |
April 1, 2020 |
December 31, 2022 |
0.1 |
LTI 20/21 |
(share-based) |
June 1, 2020 |
December 31, 2024 |
5.2 |
LTI 21/22 |
(share-based) |
June 1, 2021 |
December 31, 2025 |
2.8 |
LTI 22 |
(share-based) |
June 1, 2022 |
December 31, 2026 |
0.9 |
The amount recognized for the period for all these plans is an expense of €16.4 million, compared to €3.9 million in the year of 2021.
22.3Treasury stock
The cost of the shares held in treasury stock as of December 31, 2022 totaled €3.5 million, representing an average cost of €41.99 per share.
Note 23Minority interests
This item corresponds to minority shareholders’ interests in the equity of consolidated subsidiaries.
(in € million) |
2022 |
2021 |
---|---|---|
Amount as at beginning of the period |
386.3 |
331.4 |
Increase in minority shareholder interests |
0.0 |
2.4 |
Other changes in scope of consolidation |
1,220.4 |
(9.6) |
Minority interests in net income for the year |
131.4 |
95.0 |
Other comprehensive income |
22.5 |
0.0 |
Dividends allocated to minority interests |
(55.2) |
(68.2) |
Currency translation adjustments |
(14.3) |
35.3 |
Amount as at the end of the year |
1,691.1 |
386.3 |
The minority interests mainly correspond to the minority interests of HELLA, representing €1,264.5 million as of December 31, 2022.
Note 24Current provisions and contingent liabilities
24.1Current provisions
A provision is recorded when Group Executive Management has decided to streamline the organization structure and announced the program to the employees affected by it or their representatives, when relevant.
(in € million) |
Amount as |
Additions |
Expenses charged |
Reversals* |
Sub total changes |
Change in scope of consolidation and other changes |
Amount |
---|---|---|---|---|---|---|---|
Restructuring |
163.8 |
211.2 |
(224.0) |
0.0 |
(12.8) |
49.0 |
200.0 |
Risks on contracts |
53.7 |
77.5 |
(146.7) |
(1.6) |
(70.8) |
495.2 |
478.1 |
Litigation |
35.8 |
15.8 |
(15.3) |
(0.9) |
(0.3) |
29.9 |
65.4 |
Other provisions |
35.1 |
4.3 |
(1.9) |
0.0 |
2.4 |
14.5 |
52.0 |
Total |
288.4 |
308.8 |
(387.9) |
(2.5) |
(81.5) |
588.6 |
795.5 |
* Surplus provisions. |
24.2Contingent liabilities
Litigation
There are no other claims or litigation in progress or pending that are likely to have a material impact on the Group’s consolidated financial position.
Note 25Non-current provisions and provisions for pensions and other post-employment benefits
25.1 Non-current provisions
Changes in non-current provisions
(in € million) |
2022 |
2021 |
---|---|---|
Amount as at the beginning of the period |
447.3 |
515.3 |
Restatement IFRS IC decision on IAS 19* |
NA |
(9.3) |
Scope variation |
399.0 |
(17.4) |
Other movement |
(16.4) |
16.3 |
Allowance (or reversal) of provision |
48.8 |
21.8 |
Expenses charged to the period |
(54.4) |
(20.9) |
Payment to external funds |
(5.8) |
(4.4) |
Restatement differences |
(243.3) |
(54.1) |
Amount as at the end of the period |
575.2 |
447.3 |
* Cf. Note 25.2 |
|
|
25.2Provisions for pensions and other post-employment benefits
Group employees may receive, in addition to their pensions in conformity with the applicable regulations in the countries where the Group companies employing them are located, additional benefits or post-retirement benefit obligations. The Group offers these benefits through either defined benefits or defined contribution plans. The valuation and accounting methodologies followed by the Group are the following:
- ■for defined contribution plans, costs are recognized as expenses based on contributions;
- ■the liability for defined benefit plans is determined on an actuarial basis using the projected unit credit method, according to the agreements effective in each concerned Group company.
The valuation takes into account the probability of employees staying with the Group up to retirement age and expected future salary levels as well as other economic assumptions (such as the inflation rate, the discount rate) for each concerned zone or country. It takes now also into account the 2021 IFRS IC decision on attributing benefit to periods of services. These assumptions are described in Note 25.2.
Benefit obligations are partially funded by contributions to external funds. In cases where the funds are permanently allocated to the benefit plan concerned, their value is deducted from the related liability. An excess of plan assets is only recognized in the balance sheet when it represents future benefits effectively available for the Group.
Periodic pension and other employee benefit costs are recognized as operating expenses over the benefit vesting period.
In case of a change in regime, past service costs are fully recognized as operating expenses, the benefits being fully acquired or not.
The expected rate of return of defined benefits plan assets is equal to the discount rate used to value the obligation at the opening of the period. This return is recorded in “Other financial income and expense”.
The other long-term benefits (during employment period) mainly cover seniority bonuses as well as long-service awards. The obligation is valued using similar methodology, assumptions and frequency as the ones used for post-employment benefits.
Benefit obligations
(in € million) |
2022 |
2021 |
---|---|---|
Present value of projected obligations |
|
|
|
633.7 |
462.6 |
|
167.2 |
200.1 |
|
41.0 |
25.8 |
|
8.2 |
9.7 |
Total |
850.1 |
698.3 |
Value of plan assets: |
|
|
|
575.2 |
447.3 |
|
296.4 |
290.7 |
|
(21.5) |
(39.6) |
Total |
850.1 |
698.3 |
(1) External funds mainly cover pension plan benefit obligations for €284.5 million in 2022. (2) Pension plan surpluses are included in Other non-current assets. |
Pension benefit obligations
A – Description of the plans
In France, all managerial employees with a salary in tranche C are granted a defined benefit pension scheme, for which the rights acquired as of December 31, 2019 have been frozen according to seniority at this date, in order to comply with the PACTE law from May 22, 2019. Executive Committee members who have an employment contract with Faurecia S.E. or any of its subsidiaries also benefit from a defined benefit pension scheme for French members and defined contribution pension scheme for foreign members, the rights acquired as of December 31, 2019 in the defined benefit pension scheme for French members have also been frozen according to seniority at this date, in order to comply with the PACTE law from May 22, 2019. The rights are reestimated based on the evolution of the salary and respective expenses of the employees part of the pension scheme.
In the United States, the two remaining plans, already closed to new participants, were combined as of January 1, 2020. The combined pension plan covers 828 participants.
In Germany, the main defined benefit pension plan still open covers 5,164 participants. The benefit granted is based on the number of years of service, starting after 14 years. The main defined benefit pension plan closed to new participants covers 7,958 participants.
In Japan, the main defined benefit plan covers 881 participants. Benefits are based on years of service and paid at the end of the contract or upon reaching the age of 60.
B – Assumptions used
The Group’s obligations under these plans are determined on an actuarial basis, using the following assumptions:
- ■retirement age between 62 and 65 for employees in France;
- ■staff turnover assumptions based on the economic conditions specific to each country and/or Group company;
- ■mortality assumptions specific to each country;
- ■estimated future salary levels until retirement age, based on inflation assumptions and forecasts of individual salary increases for each country;
- ■the expected long-term return on external funds;
- ■discount and inflation rates (or differential) based on local conditions;
The main actuarial assumptions used in the past two years to measure the pension liability are as follows:
Nota: The discount rate for the euro zone was determined on the basis of yields on prime corporate bonds for a maturity corresponding to the duration of the obligations. Prime corporate bonds are defined as bonds awarded one of the top two ratings by a recognized rating agency (for example, bonds rated AA or AAA by Moody’s or Standard & Poor’s).
C – Information on external funds
The fair value of shares and bonds falls in the level 1 category (price quoted in active markets) in 2022.
D – Provisions for pension liabilities recognized on the balance sheet
(in € million) |
2022 |
2021 |
||||
France |
Abroad* |
Total |
France |
Abroad |
Total |
|
Amount as at the beginning of the period |
167.1 |
205.1 |
372.1 |
179.6 |
271.9 |
451.5 |
Restatement IFRS IC decision on IAS 19 (1) |
NA |
NA |
NA |
(9.3) |
0.0 |
(9.3) |
Effect of changes in scope of consolidation (provision net of plan surpluses) |
0.5 |
378.5 |
379.0 |
(7.3) |
(9.2) |
(16.5) |
Additions |
11.3 |
32.0 |
43.3 |
8.8 |
15.3 |
24.2 |
Expenses charged to the provision |
(2.8) |
(41.6) |
(44.4) |
(2.4) |
(13.6) |
(16.0) |
Payments to external funds |
0.0 |
(5.8) |
(5.8) |
(2.0) |
(2.4) |
(4.4) |
Actuarial gains/(losses) |
(48.2) |
(192.7) |
(240.9) |
3.1 |
(56.3) |
(53.2) |
Other movements |
0.0 |
1.2 |
1.2 |
(3.4) |
(0.7) |
(4.1) |
Amount as at the end of the period |
127.9 |
376.7 |
504.5 |
167.1 |
205.1 |
372.1 |
(1) cf. Note 25.2 * The provision for €376.7 million as of December, 31, 2022 relates mainly to Germany (€311.0 million). |
E – Changes in pension liabilities
(in € million) |
2022 |
2021 |
||||
France |
Abroad |
Total |
France |
Abroad |
Total |
|
Projected benefit obligation |
|
|
|
|
|
|
Amount as at the beginning of the period |
183.6 |
479.3 |
662.9 |
196.4 |
515.8 |
712.3 |
Restatement IFRS IC decision on IAS 19* |
NA |
NA |
NA |
(9.3) |
0.0 |
(9.3) |
Service costs |
10.8 |
25.3 |
36.1 |
9.1 |
15.1 |
24.2 |
Annual restatement |
2.2 |
14.0 |
16.2 |
1.2 |
5.2 |
6.4 |
Benefits paid |
(3.9) |
(65.4) |
(69.3) |
(4.8) |
(22.1) |
(26.9) |
Actuarial gains/(losses) |
(47.4) |
(285.8) |
(333.2) |
3.1 |
(38.5) |
(35.4) |
Other movements (including translation adjustment) |
0.5 |
491.7 |
492.2 |
(6.6) |
6.6 |
(0.1) |
Curtailments and settlements |
(1.6) |
(2.3) |
(3.9) |
(1.4) |
(2.8) |
(4.2) |
Effect of closures and plan amendments |
0.0 |
0.0 |
0.0 |
(4.1) |
0.0 |
(4.1) |
Amount as at the end of the period |
144.2 |
656.8 |
801.0 |
183.6 |
479.3 |
662.9 |
Value of plan assets |
|
|
|
|
|
|
Amount as at the beginning of the period |
16.5 |
274.2 |
290.7 |
16.8 |
243.9 |
260.7 |
Projected return on plan assets |
0.1 |
5.0 |
5.1 |
0.1 |
2.2 |
2.3 |
Actuarial gains/(losses) |
0.8 |
(93.1) |
(92.3) |
0.0 |
17.8 |
17.8 |
Other movements (including translation adjustment) |
0.0 |
112.0 |
112.0 |
0.0 |
16.5 |
16.5 |
Employer contributions |
0.0 |
5.8 |
5.8 |
2.0 |
2.4 |
4.4 |
Benefits paid |
(1.1) |
(23.8) |
(24.9) |
(2.4) |
(8.5) |
(10.9) |
Curtailments and settlements |
0.0 |
0.0 |
0.0 |
0.0 |
0.0 |
0.0 |
Effect of closures and plan amendments |
0.0 |
0.0 |
0.0 |
0.0 |
0.0 |
0.0 |
Amount as at the end of the period |
16.3 |
280.1 |
296.4 |
16.5 |
274.2 |
290.7 |
Balance of provisions as at the end of the period |
127.9 |
376.7 |
504.5 |
167.1 |
205.1 |
372.1 |
Total change expensed at the end of the year |
11.3 |
32.0 |
43.3 |
8.8 |
15.3 |
24.2 |
* Cf. Note 25.2. |
- ■in operating income for the portion relating to service cost;
- ■in “Other financial income and expenses” for restatement of vested rights and the projected return on external funds.
The actuarial gains and losses generated have been recorded in “Other comprehensive income” according to IAS 19R. It can be analyzed as follows:
F – Retirement pension liabilities: sensitivity to changes in the discount rate and in the inflation rate in the main scope
The impact of a 25 basis point increase in the discount rate and in the inflation rate for the projected benefit obligation is as follows:
25.3Long-service awards
The Group evaluates its liability for the payment of long-service awards, given to employees based on certain seniority requirements. The Group calculates its liability for the payment of long-service awards using the same method and assumptions as for its pension liability. Provisions for long-service awards have been set aside as follows:
25.4Healthcare costs
In addition to pension plans, some Group companies, mainly in the United States, cover the healthcare costs of their employees.
The increase of 25 basis points in the discount rate and 1 percentage point in the healthcare cost trend rates would lead to the following variations on the Group’s projected benefits obligations:
(in %) |
Discount rate +0.25 pt |
Healthcare cost trend rate +1 pt |
---|---|---|
Projected benefit obligation |
(1.8)% |
+7.4% |
Financial liabilities
The Group’s financial liabilities fall within the IFRS 9 categories of (i) financial liabilities at fair value through profit or loss, and (ii) other financial liabilities measured at amortized cost.
They are recorded on the following balance sheet items: “Current financial liabilities” and “Non-current financial liabilities” (Note 26), “Accrued taxes and payroll costs” (Note 27) and “Sundry payables” (Note 28).
Financial assets and liabilities are broken down into current and non-current components for maturities at the balance sheet date: under or over a year.
Note 26Net debt
The Group’s financial liabilities are generally measured at amortized cost using the effective interest method.
26.1Analysis of net debt
(in € million) |
2022 |
2021 |
---|---|---|
Bonds |
6,499.5 |
4,891.5 |
Bank borrowings |
2,461.7 |
1,366.1 |
Other borrowings |
84.8 |
73.0 |
Non-current lease liabilities |
1,049.2 |
833.1 |
Non-current derivatives |
60.2 |
3.0 |
Sub-total non-current financial liabilities |
10,155.4 |
7,166.7 |
Current portion of long-term debt |
849.5 |
122.9 |
Current portion of lease liabilities |
251.8 |
198.8 |
Short-term borrowings (1) |
922.1 |
894.5 |
Current derivatives |
2.0 |
1.4 |
Sub-total current financial liabilities |
2,025.5 |
1,217.6 |
Total financial liabilities |
12,180.9 |
8,384.3 |
Derivatives classified under non-current and current assets |
(40.7) |
(11.9) |
Cash and cash equivalents |
(4,201.1) |
(4,905.7) |
Net debt |
7,939.1 |
3,466.7 |
Net cash and cash equivalent |
4,201.1 |
4,905.7 |
(1) Including bank overdrafts |
38.8 |
17.1 |
(in € million) |
Balance as of December 31, 2021 |
Impact |
Translation adjustments |
Impact of fair value changes |
Change in consolidation scope |
Balance as of December 31, 2022 |
---|---|---|---|---|---|---|
Bonds |
4,891.5 |
694.0 |
0.0 |
1.4 |
912.6 |
6,499.5 |
Bank borrowings |
1,366.1 |
3,942.5 |
7.3 |
22.1 |
(2,876.3) |
2,461.7 |
Other borrowings |
73.0 |
0.0 |
(0.9) |
12.6 |
0.1 |
84.8 |
Non-current lease liabilities |
833.1 |
0.0 |
17.4 |
0.0 |
198.7 |
1,049.2 |
Non-current derivatives |
3.0 |
(37.8) |
0.0 |
15.3 |
79.7 |
60.2 |
Sub-total non-current |
7,166.7 |
4,598.7 |
23.8 |
51.4 |
(1,685.2) |
10,155.4 |
Current portion of long-term debt |
122.9 |
(2,424.3) |
(4.0) |
8.8 |
3,146.1 |
849.5 |
Current portion of lease liabilities |
198.8 |
(257.0) |
2.3 |
0.0 |
307.8 |
251.8 |
Short-term borrowings |
894.5 |
27.7 |
(1.4) |
0.0 |
1.3 |
922.1 |
Current derivatives |
1.4 |
(0.1) |
0.0 |
0.7 |
0.0 |
2.0 |
Sub-total current |
1,217.6 |
(2,653.7) |
(3.1) |
9.5 |
3,455.2 |
2,025.5 |
Total financial liabilities |
8,384.3 |
1,945.0 |
20.7 |
60.9 |
1,770.0 |
12,180.9 |
Derivatives classified under non-current and current assets |
(11.9) |
(13.1) |
0.0 |
(15.5) |
(0.2) |
(40.7) |
Cash and cash equivalents |
(4,905.7) |
900.3 |
38.4 |
0.0 |
(234.1) |
(4,201.1) |
Total |
3,466.7 |
2,832.2 |
59.1 |
45.4 |
1,535.7 |
7,939.1 |
26.2Maturities of long-term debt
(in € million) |
2024 |
2025 |
2026 |
2027 |
2028 and beyond |
Total |
---|---|---|---|---|---|---|
Bonds |
299.7 |
986.2 |
1,446.7 |
2,569.3 |
1,197.6 |
6,499.5 |
Bank borrowings |
1,001.0 |
32.5 |
558.4 |
32.2 |
837.5 |
2,461.7 |
Other borrowings |
84.6 |
0.1 |
0.0 |
0.1 |
0.0 |
84.9 |
Non-current lease liabilities |
210.1 |
180.0 |
147.2 |
133.5 |
378.4 |
1,049.2 |
Non-current derivatives |
0.0 |
0.0 |
0.0 |
1.7 |
58.5 |
60.2 |
Total as of December 31, 2022 |
1,595.5 |
1,198.8 |
2,152.4 |
2,736.7 |
2,472.0 |
10,155.4 |
26.3Financing
The main components of Faurecia financing are described below; financing components at HELLA GmbH & kGaA are also described below as a consequence of HELLA acquisition (see notes 2.1 &10.A).
Syndicated credit facility
On December 15, 2014, Faurecia signed a syndicated credit facility, with a five-year maturity, for an amount of €1,200 million. This credit facility was renegotiated on June 24, 2016, then on June 15, 2018 in order to extend the maturity to five years from that date. In May 2021, Faurecia has signed with its banks an Amend & Extend agreement of this syndicated credit line enabling the Group to increase the amount up to €1,500 million, as well as indexing its costs on Faurecia’s environmental performance, the interest rate varying depending upon the achievement of the Group’s target of CO2 neutrality for its scopes 1 & 2, and to extend its maturity to 5 years, i.e. May 2026, with two one-year extension options submitted to the banks’ agreement.
On April 26, 2022 Faurecia has proactively renegotiated its covenant for its bank credit lines (ratio Net debt (1)/adjusted EBITDA(2)) and which compliance is a condition affecting the availability of this credit facility. The level of this ratio was not tested for June 30, 2022 and stands at 3.75x for December 31, 2022 (instead of 3.00x) before coming back to 3.0x from June 30, 2023 onwards. As of December 31, 2022, this condition was met.
This credit facility includes some restrictive clauses on asset disposals (disposal representing over 35% of the Group’s total consolidated assets requires the prior approval of banks representing two-thirds of the syndicate) and on the debt level of some subsidiaries.
Syndicated credit facility HELLA
On June 01, 2015, HELLA signed a syndicated credit facility, with a five-year maturity with two extension options, for an amount of €450 million. A first one-year extension option has been exercised in April 2016, extending the maturity of this credit facility to June 2021. A second one-year extension option has been exercised in April 2017, extending the maturity of this credit facility to June 2022. This credit facility was renegotiated on August 16, 2021, to extend the maturity to June 03, 2023, and adjust its terms and conditions.
On September 30, 2022, HELLA signed a new syndicated credit facility, replacing the previous one, for an amount of €450 million, with a three-year maturity, with two one-year extension options and an option to increase the amount up to €150 million.
Syndicated bridge loan
On August 13, 2021, Faurecia signed a syndicated confirmed bridge loan for an amount of €5.5 billion in order to secure the financing of the HELLA acquisition, to be refinanced mainly through bonds issues and bank loans, to the exception of the €800 million part to be refinanced through a capital increase (bridge to equity).
On January 26, 2022 Faurecia has drawn €2.9 billion on this bridge loan, of which €500 million corresponding to a three years loan granted by the banks of the syndicated bridge loan.
On April 26, 2022 Faurecia has proactively renegotiated its covenant for its bank credit lines (ratio Net debt (1)/adjusted EBITDA (2)) and which compliance is a condition affecting the availability of this credit facility. The level of this ratio was not tested for June 30, 2022 and stands at 3.75x for December 31, 2022 (instead of 3.0x) before coming back to 3.0x from June 30, 2023 onwards.
During the year 2022, Faurecia has reimbursed in total €2.2 billion on this bridge loan, by using especially the proceeds of the €700 million capital increase launched on June 3, 2022 as well as the ones from various debts issuance further described below.
As of December 31, 2022, the bridge loan was drawn up to €705 million of which €100 million for the bridge to equity with a maturity on Faurecia’s hand on February 13, 2023, €105 million for the bridge to bond with a maturity on August 13, 2023 and €500 million of Term loan with a maturity on August 13, 2024. The bridge to bond and bridge to equity were fully reimbursed at the beginning of February 2023 (see note 2.6).
Schuldscheindarlehen
Faurecia has signed on December 17, 2018 a private placement under German Law (Schuldscheindarlehen) for a total amount of €700 million. This transaction is structured into several tranches in EUR and USD, at fixed and variable rates, with maturities of 4, 5 and 6 years, i.e. December 2022, 2023 and 2024. €378 million have been received on December 20, 2018 and the remaining amount has been received in early January 2019. The USD tranches have been partially converted in EUR resources through long term cross-currency swaps.
On June 21, 2021 Faurecia has reimbursed by anticipation €226.5 million of the variable rate tranche of the Schuldscheindarlehen with 2022 maturity. On December 20, 2022 Faurecia has reimbursed €58.5 million of the fixed rate tranche of the Schuldscheindarlehen with 2022 maturity.
Faurecia has signed on December 17, 2021 a private placement under German Law (Schuldscheindarlehen) including ESG performance criteria for a total amount of €700 million. Faurecia signed on June 15, 2022 an additional placement of €50 million. These transactions are structured into several tranches in EUR and USD, at fixed and variable rates, with maturities of 2.5, 4, 5 and 6 years, i.e. July 2024 and January 2026, 2027 and 2028. €435 million have been received on December 22, 2021 and the remaining amount has been received in early January 2022. The USD tranches have been partially converted in EUR resources through long term cross-currency swaps.
¥30 billion credit facility
On February 7, 2020, Faurecia has signed a credit facility in Yen for an amount of ¥30 billion, with a five-year maturity, aiming at refinancing on a long-term basis the debt of Clarion Co. Ltd. The credit facility comprises two tranches of ¥15 billion each, one being a loan and the other one a renewable credit line.
The maturity of the credit line has been extended from February 2025 to February 2026 by exercising the first extension option.
On April 26, 2022 Faurecia has proactively renegotiated its covenant for its bank credit lines (ratio Net debt (1)/adjusted EBITDA (2)) and which compliance is a condition affecting the availability of this credit facility. The level of this ratio was not tested for June 30, 2022 and stands at 3.75x for December 31, 2022 (instead of 3.0x) before coming back to 3.0x from June 30, 2023 onwards. As of December 31, 2022, this condition was met.
Syndicated loan Latin America
On September 22, 2022, Faurecia Sistemas Automotrices de Mexico S.A. DE CV signed a syndicated credit facility for an amount of US$210 million, with various investors from Latin America. On this basis, Faurecia has borrowed US$100 million and 2 billion mexican pesos at a variable rate with a maturity on March 22, 2028, the amount in pesos being converted in USD resources through long term cross-currency swaps.
European Investissement Bank (EIB) credit facility
On July 1, 2022, Faurecia signed a credit facility for an amount of €315 million, with a seven-year maturity with the European Investment Bank (EIB). This credit facility aims at financing investments in R&D, production and deployment of the hydrogen technology for mobility applications, advanced systems for driving assistance and driver control systems. It is composed of two tranches: (i) one for an amount of €289 million (ii) one for an amount of €26 million.
This credit facility includes a covenant on the ratio Net debt (3)/adjusted EBITDA (4) which compliance is a condition affecting the availability of this credit facility, identical to the syndicated credit facility and which cannot exceed 3.75x for December 31, 2022 and 3.0x from June 30, 2023 onwards. As of December 31, 2022, this condition was met. It includes as well some restrictive clauses on asset disposals and on the debt level of some subsidiaries.
In compliance with IAS20, the difference between the market rate for a comparable loan at initial date and the interest rate for this loan has been recognized as a grant ; it is recognized in P&L against the costs that the grant aims to compensate over the loan duration.
2024 bonds HELLA
On May 17, 2017, HELLA issued bonds for an amount of €300 million due May 17, 2024, carrying annual interest of 1.00%, payable on May 17 each year, as from May 17, 2018.
The proceeds of these bonds have been used to redeem the €300 million bonds due September 07, 2017, carrying annual interest of 1.25%, issued in March 2014.
2025 bonds
On March 8, 2018, Faurecia issued bonds for an amount of €700 million due June 15, 2025, carrying annual interest of 2.625%, payable on June 15 and December 15 each year, as from June 15, 2018.
These bonds include a covenant restricting the additional indebtedness if the EBITDA after certain adjustments is lower than twice the gross interest costs, and restrictions on the debt similar to those of the syndicated credit loan.
The proceeds of these bonds have been used to redeem the €700 million bonds due June 15, 2022, carrying annual interest of 3.125%, issued in March and April 2015.
The bonds are listed on the Global Exchange Market of Euronext Dublin (previously Irish Stock Exchange).
An additional issue for €300 million of these 2025 bonds has been done on July 31, 2020. These additional bonds have been issued at 97.50% of the par, which corresponds to a yield to maturity of 3.18%.
SLB 7.25% 2026 bonds
On November 15, 2022, Faurecia issued bonds for an amount of €700 million due June 15, 2026, carrying annual interest of 7.25%, payable on June 15 and December 15 each year, as from June 15, 2023.
These bonds are subject to the same restrictions than the 2029 bonds and base the 2025 objectives of CO2 emission reduction on scope 1 & 2. On the “Sustainable Linked Financing Framework” published in October 2021 and approved by the ISS ESG. The non compliance to these objectives involves a step up of the bonds interest in 2026.
2026 bonds
On March 27, 2019, Faurecia issued bonds for an amount of €500 million due June 15, 2026, carrying annual interest of 3.125%, payable on June 15 and December 15 each year, as from June 15, 2019.
In order to prefinance the acquisition of 50% of SAS shares, an additional issue for €250 million of these 2026 bonds has been performed on October 31, 2019. These additional bonds have been issued at 104.50% of the par, which corresponds to a return at issuance of 2.40%.
2027 2.375% bonds
On November 27, 2019, Faurecia issued bonds for an amount of €700 million due June 15, 2027, carrying annual interest of 2.375%, payable on June 15 and December 15 each year, as from June 15, 2020.
The proceeds of these bonds have been used to refinance the €700 million bonds due June 15, 2023 carrying annual interest of 3.625%, issued on April 1, 2016.
This refinancing has been done through a tender offer through which 2023 bond holders could exchange their bonds against new 2027 bonds. The rate of exchange has reached 76%. The bonds that were not tendered in this offer have been redeemed in accordance with the offering memorandum. The settlement of these two operations has taken place respectively on November 25 and November 28, 2019.
The bond premium for bonds tendered in the offer is amortized over the duration of the new 2027 bonds; the bond premium for bonds redeemed by anticipation has been expensed in the year 2019.
On February 3, 2021, an additional issue for €190 million of these 2027 bonds has been performed via a private placement. These bonds have been issued at 100.75% of the par, which corresponds to a return at issuance of 2.26%.
2027 SLB 2.75% bonds
On November 10, 2021, Faurecia issued bonds for an amount of €1,200 million due February 15, 2027, carrying annual interest of 2.75%, payable on June 15 and December 15 each year, as from June 15, 2022.
These bonds are subject to the same restrictions than the 2029 bonds and base the 2025 objectives of CO2 emission reduction on scope 1 & 2. On the “Sustainable Linked Financing Framework” published in October 2021 and approved by the ISS ESG. The non compliance to these objectives involves a step up of the bonds interest in 2026.
2027 bonds hella
On September 03, 2019, HELLA issued bonds for an amount of €500 million due January 26, 2027, carrying annual interest of 0.50%, payable on January 26 each year, as from January 26, 2020.
The proceeds of these bonds have been used to redeem the €500 million bonds due January 24, 2020, carrying annual interest of 2.375%, issued in January 2013.
2028 bonds
On July 31, 2020, Faurecia issued bonds for an amount of €700 million due June 15, 2028, carrying annual interest of 3.75%, payable on June 15 and December 15 each year, as from December 15, 2020.
These bonds are subject to the same restrictions than the 2027 bonds. The bonds are listed on the Global Exchange Market of Euronext Dublin.
Green bonds 2029
Faurecia issued on March 22, 2021 green bonds for an amount of €400 million due June 15, 2029, carrying annual interest of 2.375%. The proceeds will be used to finance or refinance the Group’s investments in the hydrogen mobility, for both hydrogen storage and distribution systems and in fuel cell stacks and systems through Symbio, its joint venture with Michelin. The Green Bond Framework has been reviewed by ISS ESG, environmental rating agency.
These bonds are subject to the same restrictions than the 2028 bonds. The bonds are listed on the Global Exchange Market of Euronext Dublin.
loan facilities hella in yen
On September 17, 2002, HELLA issued a notes certificate for an amount of ¥12 billion due September 17, 2032, carrying annual interest of 3.50%, payable on March 17 and September 17 each year, as from March 17, 2003.
On June 16, 2003, HELLA signed a loan for an amount of ¥10 billion due June 20, 2033, carrying annual interest of 4.02%, payable in USD on June 20 and December 20 each year, as from December 20, 2003.
Finally, during the year 2022, Faurecia regularly issued commercial papers with a maturity up to one year for investors located mainly in France. As of December 31, 2022, the outstanding amount was €694.4 million.
During the year 2022, Standard & Poor’s has downgraded its outlook from stable to negative to Faurecia on May 24, 2022 to its BB grading. Fitch has downgraded its outlook from stable to negative to Faurecia July 29, 2022 to its BB+ grading.
(in € million) |
Carrying Amount |
|
Remaining contractual maturities |
|||||
---|---|---|---|---|---|---|---|---|
Assets |
Liabilities |
Total |
0-3 months |
3-6 months |
6-12 months |
1-5 years |
>5 years |
|
Other non-current financial assets |
158.1 |
|
158.1 |
|
|
|
158.1 |
|
Other non-current assets |
187.2 |
|
187.2 |
|
|
|
187.2 |
|
Trade accounts receivables |
5,065.9 |
|
5,065.9 |
4,792.1 |
197.9 |
75.9 |
|
|
Cash and cash equivalents |
4,201.1 |
|
4,201.1 |
4,201.1 |
|
|
|
|
Interests on: |
|
|
|
|
|
|
|
|
2024 HELLA Bond |
|
(1,9) |
(6.0) |
0,0 |
(3.0) |
0.0 |
(3.0) |
0,0 |
2025 Bonds |
|
(1,1) |
(78.8) |
0.0 |
(13.1) |
(13.1) |
(52.5) |
0.0 |
2026 Bonds |
|
(1.0) |
(93,8) |
0,0 |
(11,7) |
(11,7) |
(70,3) |
0,0 |
2026 SLB Bonds |
|
(6,5) |
(203,0) |
0,0 |
(25,4) |
(25,4) |
(152,3) |
0,0 |
2027 Bonds |
|
(1,4) |
(132,0) |
0,0 |
(16,5) |
(16,5) |
(99,0) |
0,0 |
2027 SLB Bonds |
|
(0,9) |
(105,7) |
0,0 |
(10,6) |
(10,6) |
(84,6) |
0,0 |
2027 HELLA Bond |
|
(2,3) |
(12.5) |
(2.5) |
0.0 |
0.0 |
(10.0) |
0,0 |
2028 Bonds |
|
(1,1) |
(144,4) |
0,0 |
(13,1) |
(13,1) |
(105,0) |
(13,1) |
2029 Bonds |
|
(4,7) |
(61,8) |
0,0 |
(4,8) |
(4,8) |
(38,0) |
(14,3) |
2032 HELLA Bonds |
|
(0,9) |
(29,9) |
(1.5) |
0.0 |
(1,5) |
(11,9) |
(14,9) |
Schuldschein |
|
(0,6) |
(145,2) |
(13,6) |
(13,6) |
(27.0) |
(90.5) |
(0,4) |
Other long-term borrowings |
|
(19,0) |
(294,0) |
(20,9) |
(20,0) |
(37,9) |
(178,0) |
(37,2) |
Current portion of lease liabilities |
|
(251,8) |
(251,8) |
(62,5) |
(62,3) |
(127,0) |
|
|
Other current financial liabilities |
|
(1 096,2) |
(1 096,2) |
(676,9) |
(119,5) |
(299,8) |
0,0 |
0,0 |
Trade accounts payables |
|
(9 181,3) |
(9 181,3) |
(8 786,5) |
(336,1) |
(58,7) |
|
|
Bonds (excluding interest) |
|
|
|
|
|
|
|
|
2024 Hella Bond |
|
(299,7) |
(299,7) |
|
|
|
(299,7) |
|
2025 Bonds |
|
(986,2) |
(986,2) |
|
|
|
(986,2) |
|
2026 Bonds |
|
(752,4) |
(752,4) |
|
|
|
(752,4) |
|
2026 SLB Bond |
|
(694,2) |
(694,2) |
|
|
|
(694,2) |
|
2027 Bonds |
|
(1 192,3) |
(1 192,3) |
|
|
|
(1 192,3) |
|
2027 SLB Bonds |
|
(877,9) |
(877,9) |
|
|
|
(877,9) |
|
2027 HELLA Bond |
|
(499,1) |
(499,1) |
|
|
|
(499,1) |
|
2028 Bonds |
|
(696,2) |
(696,2) |
|
|
|
|
(696,2) |
2029 Bonds |
|
(396,9) |
(396,9) |
|
|
|
|
(396,9) |
2032 HELLA Bonds |
|
(104,5) |
(104,5) |
|
|
|
|
(104,5) |
Bank borrowings |
|
|
|
|
|
|
|
|
Schuldschein |
|
(1 180,0) |
(1 180,0) |
0,0 |
0,0 |
(216,1) |
(724,9) |
(239,0) |
Others |
|
(1 283,9) |
(1 283,9) |
(117,2) |
0,0 |
(206,4) |
(361,2) |
(599,1) |
Other borrowings |
|
(115,0) |
(115,0) |
0,0 |
0,0 |
(108,3) |
(5,6) |
(1,1) |
Non-current lease liabilities |
|
(1 049,2) |
(1 049,2) |
|
|
|
(670,8) |
(378,4) |
Interest rate derivatives |
12,5 |
0,0 |
12,5 |
0,0 |
4,6 |
0,0 |
7,9 |
0,0 |
|
12,5 |
0,0 |
12,5 |
0,0 |
4,6 |
0,0 |
7,9 |
0,0 |
|
|
|
|
|
|
|
|
|
Currency hedges |
85,2 |
(82,6) |
2,6 |
11,3 |
8,4 |
23,3 |
5,7 |
(46,2) |
|
5,3 |
(3,8) |
1,5 |
2,1 |
0,0 |
0,0 |
(1,7) |
1,1 |
|
79,9 |
(78,6) |
1,3 |
9,4 |
8,5 |
23,3 |
7,4 |
(47,2) |
|
0,0 |
(0,1) |
(0,1) |
(0,1) |
(0,1) |
0,0 |
0,0 |
0,0 |
Total |
9 709,8 |
(20 780,9) |
(12 336.5) |
(677.1) |
(438.7) |
(1 078.6) |
(7 600.2) |
(2 541,4) |
26.4Analysis of borrowings
As of December 31, 2022, the variable rate borrowings were 29.4% of borrowings before taking into account the impact of hedging.
Borrowings, taking into account foreign exchange swaps, break down by repayment currency as follows:
Note 27Trade payables, accrued taxes and payroll costs
27.1Trade payables
Faurecia has implemented a reverse factoring program since 2017. This program enables suppliers participating to sell their receivables towards Faurecia to a financial institution (factor) before their contractual payment term. Relations between the parties are structured through two contracts:
- ■Faurecia suppliers are entering a factoring contract with the factor, for the receivables they have towards Faurecia;
- ■Faurecia signs a contract with the factor in which Faurecia commits to pay these invoices at the contractual payment term to the factor (once the invoices have been validated).
This program enables the participating suppliers to have their receivables paid on a short term by the factor. Faurecia pays these invoices at their contractual due date to the factor.
The scheme’s analysis has led Faurecia to consider that the nature of these invoices was not changed by the implementation of this program. They are therefore still classified as trade payables.
27.2Accrued taxes and payroll cost
Note 28 Sundry payables
Note 28Sundry payables
Note 29Financial instruments
29.1Financial instruments recorded in the balance sheet
(in € million) |
December 31, 2022 |
Breakdown by category of instrument (1) |
||||
Balance |
Carrying amount not |
Financial assets/ |
Financial assets/ |
Assets and |
Financial assets/ |
|
Other equity interests |
128.5 |
|
128.5 |
|
|
128.5 |
Other non-current financial assets |
158.1 |
|
2.5 |
20.6 |
135.0 |
158.1 |
Trade accounts receivables |
5,065.9 |
5,065.9 |
|
|
|
0.0 |
Other operating receivables |
720.5 |
672.1 |
8.4 |
40.0 |
|
48.4 |
Other non-current assets |
187.1 |
178.6 |
|
8.5 |
|
8.5 |
Other receivables and prepaid expenses |
1,425.7 |
1,327.1 |
|
98.6 |
|
98.6 |
Currency derivatives |
13.1 |
|
11.4 |
1.7 |
|
13.1 |
Interest rate derivatives |
4.6 |
|
0.0 |
4.6 |
|
4.6 |
Cash and cash equivalents |
4,201.1 |
|
4,201.1 |
|
|
4,201.1 |
Financial assets |
11,904.6 |
7,243.7 |
4,351.9 |
174.0 |
135.0 |
4,660.9 |
Long-term debt* |
9,106.2 |
2.3 |
14.3 |
46.0 |
9,043.6 |
8,239.3 |
Non-current lease liabilities |
1,049.2 |
|
|
|
1,049.2 |
1,049.2 |
Short-term debt |
1,773.7 |
|
2.0 |
|
1,771.7 |
1,773.7 |
Current portion of lease liabilities |
251.8 |
|
|
|
251.8 |
251.8 |
Prepayments on customers contracts |
975.4 |
975.4 |
|
|
|
0.0 |
Trade payables |
9,181.3 |
9,181.3 |
|
|
|
0.0 |
Accrued taxes and payroll costs |
1,104.3 |
1,104.3 |
|
|
|
0.0 |
Other non-current liabilities |
48.1 |
47.0 |
|
1.1 |
|
1.1 |
Sundry payables |
728.1 |
711.6 |
3.9 |
12.6 |
|
16.5 |
Financial liabilities |
24,218.1 |
12,021.9 |
20.2 |
59.7 |
12,116.3 |
11,331.6 |
(1) No financial instruments were transferred between categories in 2022. (2) All of the instruments in this category are financial assets or liabilities designated as measured on initial recognition. * The fair value of the bonds, excluding accrued interest, was established on the basis of the year-end market value (December 31, 2022): for the 2024 HELLA bonds quoted 96.45% of par, at €289.3 million; for the 2025 bonds quoted 90.86% of par, at €908.6 million; for the 2026 bonds quoted 88.31% of par, at €662.3 million; for the SLB 7.25% 2026 bonds quoted 100.89% of par, at €706.2 million; for the 2027 bonds quoted 83.54% of par, at €743.5 million; for the 2027 bonds SL quoted 84.21% of par, at €1,010.5 million; for the 2027 HELLA bonds quoted 83.60% of par, at €418.0 million; for the 2028 bonds quoted 85.09% of par, at €595.7 million and for the 2029 green bonds quoted 75.18% of par, at €300.7 million. |
(in € million) |
December 31, 2021 |
Breakdown by category of instrument (1) |
||||
Balance Sheet |
Carrying amount not defined as financial instruments |
Financial |
Financial |
Assets and liabilities at amortized cost |
Financial |
|
Other equity interests |
88.0 |
|
88.0 |
|
|
88.0 |
Other non-current financial assets |
98.0 |
|
|
|
98.0 |
98.0 |
Trade accounts receivables |
3,468.1 |
3,468.1 |
|
|
|
0.0 |
Other operating receivables |
473.6 |
468.5 |
0.3 |
4.8 |
|
5.1 |
Other receivables and prepaid expenses |
1,094.9 |
1,094.9 |
|
|
|
0.0 |
Currency derivatives |
5.3 |
|
3.6 |
1.7 |
|
5.3 |
Interest rate derivatives |
6.6 |
|
|
6.6 |
|
6.6 |
Cash and cash equivalents |
4,905.7 |
|
4,905.7 |
|
|
4,905.7 |
Financial assets |
10,140.2 |
5,031.5 |
4,997.6 |
13.1 |
98.0 |
5,108.7 |
Long-term debt* |
6,333.6 |
2.1 |
|
3.0 |
6,328.5 |
6,449.4 |
Non-current lease liabilities |
833.1 |
|
|
|
833.1 |
833.1 |
Short-term debt |
1,018.8 |
|
1.4 |
|
1,017.4 |
1,018.8 |
Current portion of lease liabilities |
198.8 |
|
|
|
198.8 |
198.8 |
Prepayments on customers contracts |
740.2 |
740.2 |
|
|
|
0.0 |
Trade payables |
6,693.2 |
6,693.2 |
|
|
|
0.0 |
Accrued taxes and payroll costs |
779.1 |
779.1 |
|
|
|
0.0 |
Sundry payables |
477.3 |
470.7 |
0.2 |
6.4 |
|
6.6 |
Of which Currency derivatives |
6.6 |
|
0.2 |
6.4 |
|
6.6 |
Financial liabilities |
17,074.1 |
8,685.3 |
1.6 |
9.4 |
8,377.8 |
8,507.1 |
(1) No financial instruments were transferred between categories in 2021. (2) All of the instruments in this category are financial assets or liabilities designated as measured on initial recognition. * The fair value of the bonds, excluding accrued interest, was established on the basis of the year-end market value (December 31, 2021): for the 2025 bonds quoted 101.5% of par, at €1,015.3 million; for the 2026 bonds quoted 102.66% of par, at €769.9 million; for the 2027 bonds quoted 100.63% of par, at €895.6 million; for the 2027 bonds SL quoted 99.22% of par, at €1,190.7 million; for the 2028 bonds quoted 104.85% of par, at €733.9 million and for the 2029 green bonds quoted 101.06% of par, at €404.3 million. |
- ■items accounted for at fair value through profit or loss, as well as hedging instruments, are measured using a valuation technique based on rates quoted on the interbank market, such as Euribor and exchange rates set daily by the European Central Bank;
- ■financial liabilities are primarily recognized at amortized cost calculated using the effective interest rate method;
- ■the fair value of trade receivables and payables related to manufacturing and sales operations corresponds to their carrying value given of their very short maturities.
Moreover, Faurecia has signed in 2022 two power purchase contracts (PPA) in wind farms in Sweden for a total production of 638 GWh per year (ten years contracts). These contracts, except the component of origin certificates acquisition, are considered as financial instruments according to IFRS9 with a non significant impact on the financial statements of the Group (fair value at level 3).
(in € million) |
2022 |
Breakdown by category of instrument |
||
Impact Income |
Financial |
Financial |
Instruments derivatives |
|
Translation differences on commercial transactions |
(7.4) |
(12.0) |
|
4.6 |
Income on loans, cash investments and marketable securities |
51.6 |
51.6 |
|
|
Finance costs |
(385.3) |
|
(385.3) |
|
Other financial income and expenses |
(188.9) |
|
(185.6) |
(3.3) |
Net income (expenses) |
(530.0) |
39.6 |
(570.9) |
1.3 |
(in € millions) |
2021 |
Breakdown by category of instrument |
||
Impact Income |
Financial |
Financial |
Instruments derivatives |
|
Translation differences on commercial transactions |
19.7 |
19.7 |
|
|
Income on loans, cash investments and marketable securities |
32.0 |
32.0 |
|
|
Finance costs |
(239.3) |
|
(239.3) |
|
Other financial income and expenses |
(47.2) |
|
(48.0) |
0.8 |
Net income (expenses) |
(234.8) |
51.7 |
(287.3) |
0.8 |
As of December 31, 2022, movements in provisions for impairment break down as follows by category of financial asset:
(in € million) |
Balance as |
Additions |
Utilizations |
Reversals |
Change in scope of consolidation and other changes |
Balance |
---|---|---|---|---|---|---|
Doubtful accounts |
(23.0) |
(42.2) |
23.0 |
0.0 |
(7.6) |
(49.9) |
Shares in non-consolidated companies |
(11.6) |
(2.5) |
0.8 |
0.0 |
(9.0) |
(22.3) |
Non-current financial assets |
(9.3) |
(15.3) |
7.6 |
0.0 |
(10.7) |
(27.7) |
Other receivables |
(12.9) |
(8.1) |
0.0 |
0.0 |
(0.6) |
(21.6) |
Total |
(56.8) |
(68.0) |
31.4 |
0.0 |
(28.0) |
(121.4) |
29.2Financial instruments - fair value hierarchy
The Group’s financial instruments that are measured at fair value break down as follows by level of fair value measurement: Level 1 (prices quoted in active markets) for short-term cash investments and Level 2 (measured using a valuation technique based on rates quoted on the interbank market, such as Euribor and exchange rates set daily by the European Central Bank) for currency and interest rate instruments.
Note 30Hedging of currency and interest rate risks
30.1Transactions in foreign currencies and derivatives
Transactions in foreign currencies are converted at the exchange rate prevailing on the transaction date. Receivables and payables are converted at the year-end exchange rate. Resulting gains or losses are recorded in the income statement as operating income or expenses for operating receivables and payables, and under “Other financial income and expenses” for other receivables and payables.
Faurecia uses derivative instruments traded on organized markets or purchased over the counter from first-rate counterparties to hedge currency and interest rate risks. They are recorded at fair value in the balance sheet.
30.2Hedging of currency risks
Currency risks relating to the commercial transactions of the Group’s subsidiaries are managed centrally by Faurecia, except HELLA and its subsidiaries, using forward purchase and sale contracts and options as well as foreign currency financing. Faurecia manages the hedging of currency risks on a central basis, through the Group Finance and Treasury department, which reports to the Executive Management. Hedging decisions are made by a Market Risk Management Committee that meets on a monthly basis.
Currency risks relating to the commercial transactions of the HELLA’s subsidiaries, are managed centrally by HELLA, using forward purchase and sale contracts and options as well as foreign currency financing. HELLA manages the hedging of currency risks on a central basis, through the Treasury department, which reports to the Executive Management.
Currency risks on forecasted transactions are hedged on the basis of estimated cash flows determined when budgets are prepared, validated by Executive Management; these forecasts are updated on a regular basis. The related derivatives are classified as cash flow hedges when there is a hedging relationship that satisfies the IFRS 9 criteria.
Subsidiaries with a functional currency different from the euro are granted inter-company loans in their operating currencies. Although these loans are refinanced in euros and eliminated in consolidation, they contribute to the Group’s currency risk exposure and are therefore hedged through foreign exchange swaps or financing in the concerned currency.
The effective portion of changes in the fair value of instruments used to hedge future revenues is recorded in equity and taken to operating income when the hedged revenues are received.
Changes in the fair value of instruments used to hedge trade receivables and payables are recorded as operating income or expense.
The portion of the change in fair value of these hedges that is ineffective (time value of the hedges) is recorded under “Other financial income and expenses” together with changes in the fair value of instruments used to hedge other receivables and payables except for the changes in the fair value of cash flow hedges which are recorded in amounts to be potentially reclassified to profit or loss.
The foreign exchange exposure of investments in equity (in different currency than euro) is generally not hedged using financial instruments. However, the Group has decided to partially hedge its net investment in India for a total amount of INR 2.29 billion as at December 31st 2022. The amount recognized in OCI is €1.97 million.
2022
Currency exposure (in € million) |
USD |
CZK |
CNY |
RUB |
GBP |
PLN |
MXN |
JPY |
---|---|---|---|---|---|---|---|---|
Trade receivables (net of payables) |
(11.1) |
(17.1) |
(32.5) |
6.7 |
(17.3) |
(21.0) |
0.0 |
44.2 |
Financial assets (net of liabilities)* |
211.7 |
(0.4) |
(93.5) |
(33.5) |
(65.9) |
0.0 |
(0.9) |
137.9 |
Forecast transactions** |
244.9 |
(207.0) |
147.7 |
5.6 |
(11.3) |
(68.6) |
(215.0) |
69.5 |
Net position before hedging |
445.6 |
(224.5) |
21.8 |
(21.2) |
(94.6) |
(89.6) |
(215.8) |
251.6 |
Currency hedges |
(325.3) |
159.5 |
4.0 |
0.0 |
72.4 |
76.5 |
72.3 |
(225.9) |
Net position after hedging |
120.3 |
(65.0) |
25.8 |
(21.2) |
(22.1) |
(13.1) |
(143.5) |
25.7 |
* Including inter-company financing. ** Commercial exposure anticipated over the next 6 months. |
2021
Currency exposure (in € million) |
USD |
CZK |
CNY |
RUB |
GBP |
PLN |
MXN |
JPY |
---|---|---|---|---|---|---|---|---|
Trade receivables (net of payables) |
41.5 |
(19.4) |
(1.9) |
12.2 |
58.5 |
(16.3) |
(47.8) |
26.5 |
Financial assets (net of liabilities)* |
228.6 |
(1.3) |
10.1 |
(30.9) |
(83.3) |
0.0 |
(0.1) |
118.7 |
Forecast transactions** |
138.2 |
(98.0) |
45.4 |
40.3 |
(84.4) |
(75.6) |
(22.4) |
32.0 |
Net position before hedging |
408.3 |
(118.8) |
53.5 |
21.6 |
(109.2) |
(92.0) |
(70.4) |
177.3 |
Currency hedges |
(441.6) |
99.9 |
(3.2) |
26.7 |
67.3 |
116.5 |
49.9 |
(132.0) |
Net position after hedging |
(33.3) |
(18.9) |
50.3 |
48.3 |
(41.8) |
24.6 |
(20.5) |
45.3 |
* Including inter-company financing. ** Commercial exposure anticipated over the next 6 months. |
Hedging instruments are recognized in the balance sheet at fair value. Fair value is determined based on measurements confirmed by banking counterparties.
Information on hedged notional amounts
(in € million) December 31, 2022 |
Carrying amount |
Maturities |
||||
Assets |
Liabilities |
Notional amount* |
< 1 year |
1 to 5 years |
> 5 years |
|
Fair value hedges |
|
|
|
|
|
|
|
0.0 |
(0.1) |
4.0 |
4.0 |
0.0 |
0.0 |
|
4.2 |
(2.1) |
965.4 |
965.4 |
0.0 |
0.0 |
|
24.0 |
(63.0) |
396.2 |
112.5 |
31.4 |
252.3 |
Cash flow hedges |
|
|
|
|
|
|
|
48.1 |
(16.3) |
1,693.6 |
1,554.5 |
139.1 |
0.0 |
|
8.8 |
(0.9) |
376.2 |
201.9 |
174.3 |
0.0 |
Not eligible for hedge accounting |
0.0 |
(0.1) |
4.8 |
4.8 |
0.0 |
0.0 |
|
85.1 |
(82.5) |
|
|
|
|
* Notional amounts based on absolute values. |
|
|
|
|
|
|
(in € million) December 31, 2021 |
Carrying amount |
Maturities |
||||
Assets |
Liabilities |
Notional amount* |
< 1 year |
1 to 5 years |
> 5 years |
|
Fair value hedges |
|
|
|
|
|
|
|
0.1 |
(0.2) |
62.5 |
62.5 |
0.0 |
0.0 |
|
3.6 |
(0.8) |
535.0 |
535.0 |
0.0 |
0.0 |
|
1.7 |
(0.6) |
135.5 |
0.0 |
106.0 |
29.5 |
Cash flow hedges |
|
|
|
|
|
|
|
3.7 |
(5.6) |
486.0 |
486.0 |
0.0 |
0.0 |
|
1.2 |
(0.9) |
188.8 |
188.8 |
0.0 |
0.0 |
Not eligible for hedge accounting |
0.2 |
0.0 |
25.3 |
25.3 |
0.0 |
0.0 |
|
10.5 |
(8.0) |
|
|
|
|
* Notional amounts based on absolute values. |
|
|
|
|
|
|
The sensitivity of Group income and equity as of December 31, 2022 to a fluctuation in exchange rates against the euro is as follows for the main currencies to which the Group is exposed:
Currency exposure |
USD |
CZK |
CNY |
RUB |
GBP |
PLN |
MXN |
JPY |
---|---|---|---|---|---|---|---|---|
2022 |
1.07 |
24.12 |
7.36 |
77.92 |
0.89 |
4.68 |
20.86 |
140.66 |
Currency fluctuation scenario |
5.0% |
5.0% |
5.0% |
5.0% |
5.0% |
5.0% |
5.0% |
5.0% |
Exchange rate after currency depreciation |
1.12 |
25.32 |
7.73 |
81.81 |
0.93 |
4.91 |
21.90 |
147.69 |
Impact on pre-tax income (in € millions) |
(1.89) |
1.19 |
1.98 |
1.53 |
0.94 |
1.05 |
0.59 |
(1.56) |
Impact on other comprehensive income |
10.33 |
(11.18) |
9.29 |
0.00 |
(0.13) |
(5.07) |
(0.48) |
(5.03) |
These impacts reflect (i) the effect on the income statement of currency fluctuations on the year-end valuation of assets and liabilities recognized on the balance sheet, net of the impact of the change in the intrinsic value of hedging instruments (both those qualifying and not qualifying as fair value hedges) and (ii) the effect on equity of the change in the intrinsic value of hedging instruments for derivatives qualifying as cash flow hedges.
30.3Interest-rate hedges
Faurecia manages the hedging of interest rate risks on a central basis. Such management is implemented through the Group Finance and Treasury department, which reports to the Executive Management. Hedging decisions are made by a Market Risk Management Committee that meets on a monthly basis.
HELLA manages the hedging of interest rate risks on a central basis. Such management is implemented through the Group Finance and Treasury department, which reports to the Executive Management.
Changes in the fair value of interest rate hedges are recorded directly in “Other financial income and expenses” when the hedging relationship cannot be demonstrated under IFRS 9, or where the Group has elected not to apply hedge accounting principles.
The table below shows the Group’s interest rate position, with assets, liabilities and derivatives broken down into fixed or variable rates. Financial assets include cash and cash equivalents and interest rate hedges include interest rate swaps as well as in-the-money options.
(in € million) 2022 |
Under 1 year |
1 to 2 years |
2 to 5 years |
More than 5 years |
Total |
|||||
Fixed rate |
Variable Rate |
Fixed rate |
Variable Rate |
Fixed rate |
Variable Rate |
Fixed rate |
Variable Rate |
Fixed rate |
Variable Rate |
|
Financial assets |
|
4,218.7 |
|
7.9 |
|
|
|
15.2 |
|
4,241.8 |
Financial liabilities |
(436.7) |
(1,706.2) |
(607.9) |
(855.0) |
(5,608.4) |
(494.7) |
(1,950.6) |
(521.4) |
(8,603.6) |
(3,577.4) |
Net position before hedging |
(436.7) |
2,512.5 |
(607.9) |
(847.1) |
(5,608.4) |
(494.7) |
(1,950.6) |
(506.2) |
(8,603.6) |
664.5 |
Interest rate hedges |
(401.6) |
401.6 |
(137.0) |
137.0 |
31.4 |
(31.4) |
0.0 |
0.0 |
(507.2) |
507.2 |
Net position after hedging |
(838.3) |
2,914.0 |
(744.9) |
(710.1) |
(5,577.0) |
(526.1) |
(1,950.6) |
(506.2) |
(9,110.7) |
1,171.6 |
(in € million) 2021 |
Under 1 year |
1 to 2 years |
2 to 5 years |
More than 5 years |
Total |
|||||
Fixed rate |
Variable Rate |
Fixed rate |
Variable Rate |
Fixed rate |
Variable Rate |
Fixed rate |
Variable Rate |
Fixed rate |
Variable Rate |
|
Financial assets |
|
4,917.6 |
|
|
|
|
|
|
|
4,917.6 |
Financial liabilities |
(261.6) |
(924.0) |
(283.0) |
(422.8) |
(2,255.9) |
(681.7) |
(3,517.9) |
(37.5) |
(6,318.3) |
(2,066.0) |
Net position before hedging |
(261.6) |
3,993.7 |
(283.0) |
(422.8) |
(2,255.9) |
(681.7) |
(3,517.9) |
(37.5) |
(6,318.3) |
2,851.6 |
Interest rate hedges |
0.0 |
0.0 |
(398.6) |
398.6 |
(137.0) |
137.0 |
29.6 |
(29.6) |
(506.0) |
506.0 |
Net position after hedging |
(261.6) |
3,993.7 |
(681.5) |
(24.3) |
(2,392.9) |
(544.7) |
(3,488.3) |
(67.1) |
(6,824.3) |
3,357.6 |
Cross-currency swaps variable/fixed rate are included in the above detailed position, but their value in the balance sheet as well as the notional amounts are included in the corresponding table for currency hedging instruments in Note 30.2 and not in the interest rate hedging instruments hereafter.
- ■HELLA bonds maturing in May 2024, issued in May 2017 for a total amount of €300 million ;
- ■bonds maturing in June 2025, issued in March 2018 and July 2020 for a total amount of €1,000 million;
- ■bonds maturing in June 2026, issued in March and October 2019 for a total amount of €750 million;
- ■bonds maturing in June 2026, issued in November 2022 for a total amount of €700 million ;
- ■HELLA bonds maturing in January 2027, issued in September 2019 for a total amount of €500 million ;
- ■bonds maturing in June 2027, issued in November 2019 for a total amount of €700 million;
- ■bonds maturing in February 2027, issued in November 2021 for a total amount of €1,200 million;
- ■bonds maturing in June 2028, issued in July 2020 for a total amount of €700 million;
- ■green bonds maturing in June 2029, issued in March 2021 for a total amount of €400 million;
- ■a part of the Schuldscheindarlehen (see Note 26.3) issued in December 2018 and in December 2021 ;
- ■EIB credit facility maturing in 2029 for a total amount of €289 million ;
- ■HELLA Bilaterals maturing in 2032 and 2033 for a total amount of ¥12 billion and ¥10 billion.
The majority of interest rate derivatives as of December 31, 2022 aim at hedging the variable part of the Schuldscheindarlehen against an interest rate increase.
(in € million) December 31, 2022 |
Carrying amount |
Notional amounts by maturity |
|||
Assets |
Liabilities |
< 1 year |
1 to 5 years |
> 5 years |
|
Interest rate options |
0.0 |
0.0 |
0.0 |
0.0 |
0.0 |
Variable rate/fixed rate swaps |
12.5 |
0.0 |
350.0 |
137.0 |
0.0 |
Accrued premiums payable |
0.0 |
0.0 |
0.0 |
0.0 |
0.0 |
Swaption |
0.0 |
0.0 |
0.0 |
0.0 |
0.0 |
|
12.5 |
0.0 |
350.0 |
137.0 |
0.0 |
(in € million) December 31, 2021 |
Carrying amount |
Notional amounts by maturity |
|||
Assets |
Liabilities |
< 1 year |
1 to 5 years |
> 5 years |
|
Interest rate options |
0.0 |
0.0 |
0.0 |
0.0 |
0.0 |
Variable rate/fixed rate swaps |
0.0 |
(3.0) |
0.0 |
487.0 |
0.0 |
Accrued premiums payable |
1.4 |
0.0 |
0.0 |
0.0 |
0.0 |
Swaption |
6.6 |
0.0 |
700.0 |
0.0 |
0.0 |
|
8.0 |
(3.0) |
700.0 |
487.0 |
0.0 |
A part of the Group borrowings being at variable rates as stated in Note 26.4, a rise in short-term rates would therefore have an impact on financial expense.
The sensitivity tests performed, assuming a 100 bp increase in average interest rates compared to the rate curve as of December 31, 2022 show that the effect on net financial expense (before taxes) would not be significant, taking into account the profile of the Group’s borrowings and derivatives in place as of December 31, 2022.
30.4Counterpart risk on derivatives
Faurecia’s counterparty risk connection with its derivatives is not significant as the majority of its derivatives are arranged with banks with strong ratings that form part of its banking pool. The consideration of derivatives compensation agreements existing with counterparts, is summarized as follows:
Financial assets (in € million) |
(a) |
(b) |
(c) = (a) - (b) |
(d) Related amounts not set off in the balance sheet |
(e) = (c) - (d) |
|
Gross amount value (before compensation) |
Gross Amounts compensated (according to IAS 32) |
Net amounts presented in the balance sheet |
Financial instruments |
Collaterals received |
Net amount |
|
Derivatives |
97.7 |
0.0 |
97.7 |
11.9 |
0.0 |
85.8 |
Other financial instruments |
0.0 |
0.0 |
0.0 |
0.0 |
0.0 |
0.0 |
Total |
97.7 |
0.0 |
97.7 |
11.9 |
0.0 |
85.8 |
Financial liabilities (in € million) |
(a) |
(b) |
(c) = (a) - (b) |
(d) Related amounts not set off in the balance sheet |
(e) = (c) - (d) |
|
Gross amount value (before compensation) |
Gross Amounts compensated (according to IAS 32) |
Net amounts presented in the balance sheet |
Financial instruments |
Collaterals received |
Net amount |
|
Derivatives |
82.6 |
2.8 |
79.8 |
11.9 |
0.0 |
67.9 |
Other financial instruments |
0.0 |
0.0 |
0.0 |
0.0 |
0.0 |
0.0 |
Total |
82.6 |
2.8 |
79.8 |
11.9 |
0.0 |
67.9 |
Note 31Commitments given and contingent liabilities
Commitments given
(in € million) |
2022 |
2021 |
---|---|---|
Future minimum lease payments (1) |
16.3 |
124.0 |
Debt collateral: |
|
|
|
2.1 |
2.1 |
Other debt guarantees |
118.1 |
94.5 |
Firm orders for property, plant and equipment and intangible assets |
422.9 |
142.0 |
Other |
1.0 |
1.0 |
Total |
560.4 |
363.6 |
(1) Commitments on future lease payments are considering for 2022 only obligations not reflected in the lease liability, such as payments on contracts corresponding to exemption criteria allowed by IFRS 16 and considered by the Group as well as future payments on signed contracts which execution has not yet started. |
Note 32Related party transactions
Transactions with consolidated entities are eliminated by the consolidation process. Faurecia’s business relations with non-consolidated or Equity consolidated entities are considered as non-significant.
Note 33Management compensation
Total compensation for 2022 awarded to the members of the Board of Directors and the Group Executive Committee serving in this capacity as at December 31, 2022 amounted to €13,837,012 including directors’ fees of €885,045 compared with the 2021 figures of €12,647,356 and €864,629 respectively.
Note 34Fees paid to the Statutory Auditors
|
EY |
Mazars |
||||||
---|---|---|---|---|---|---|---|---|
(in € million) |
Amount (excl.VAT) |
% |
Amount (excl.VAT) |
% |
||||
2022 |
2021 |
2022 |
2021 |
2022 |
2021 |
2022 |
2021 |
|
Audit |
|
|
|
|
|
|
|
|
Statutory and contractual audits |
|
|
|
|
|
|
|
|
Issuer |
2.8 |
0.9 |
35.9% |
17.0% |
1.7 |
0.7 |
26.1% |
15.2% |
Fully consolidated companies |
4.2 |
3.6 |
53.8% |
68.2% |
4.5 |
3.6 |
68.0% |
73.9% |
Sub total |
7.0 |
4.5 |
89.8% |
85.2% |
6.2 |
4.3 |
94.1% |
89.1% |
Other services |
|
|
|
|
|
|
|
|
Issuer |
0.5 |
0.4 |
6.4% |
7.2% |
0.3 |
0.4 |
4.6% |
8.9% |
Fully consolidated companies |
0.3 |
0.4 |
3.8% |
7.6% |
0.1 |
0.1 |
1.4% |
2.1% |
Sub total |
0.8 |
0.8 |
10.2% |
14.8% |
0.4 |
0.5 |
5.9% |
10.9% |
Total |
7.8 |
5.3 |
100.0% |
100.0% |
6.6 |
4.9 |
100.0% |
100.0% |
Other services provided by EY to the Company and its subsidiaries mainly relate to issuance of statements as independent auditors, contractual audit reports, procedures in connection with divestment projects, consultations and comfort letters in connection with a financing operation.
Other services provided by Mazars to the Company and its subsidiaries mainly relate to issuance of statements as independent auditors, verification of the non-financial statement included in management report, contractual audit reports, procedures in connection with divestment projects, consultations and comfort letters in connection with a financing operation.
Note 35Dividends
The Board of Directors has decided to propose to the next Annual Shareholders’ Meeting not to distribute any dividend for the year 2022.
1.3.6.List of consolidated companies as of December 31, 2022
|
Country |
Interest of (%) |
Stake (%) (1) |
---|---|---|---|
I - Fully consolidated companies |
|
|
|
Faurecia |
France |
Holding |
Holding |
South Africa |
|
|
|
Faurecia Interior Systems South Africa (Pty), Ltd |
South Africa |
100 |
100 |
Faurecia Interior Systems Pretoria (Pty), Ltd |
South Africa |
100 |
100 |
Faurecia Emission Control Technologies South Africa (CapeTown) (Pty), Ltd |
South Africa |
100 |
100 |
HELLA Automotive South Africa (Pty) Ltd |
South Africa |
81.6 |
100 |
Germany |
|
|
|
Faurecia Autositze GmbH (a) |
Germany |
100 |
100 |
Faurecia Automobiltechnik GmbH (a) (b) |
Germany |
100 |
100 |
Faurecia Automotive GmbH (a) (b) |
Germany |
100 |
100 |
Faurecia Innenraum Systeme GmbH (a) |
Germany |
100 |
100 |
Faurecia Emissions Control Technologies, Germany GmbH (a) |
Germany |
100 |
100 |
Hug Engineering GmbH (a) |
Germany |
100 |
100 |
Clarion Europa GmbH |
Germany |
100 |
100 |
SAS Autosystemtechnik GmbH (a) (b) |
Germany |
100 |
100 |
SAS Autosystemtechnik Verwaltungs GmbH (a) (b) |
Germany |
100 |
100 |
Forvia Germany GmbH (a) (b) |
Germany |
100 |
100 |
HELLA GmbH & Co. KGaA |
Germany |
81.6 |
100 |
HELLA Innenleuchten-Systeme GmbH |
Germany |
81.6 |
100 |
HELLA Fahrzeugkomponenten GmbH |
Germany |
81.6 |
100 |
HFK Liegenschaftsgesellschaft mbH |
Germany |
81.6 |
100 |
HELLA Aglaia Mobile Vision GmbH |
Germany |
81.6 |
100 |
HELLA Distribution GmbH |
Germany |
81.6 |
100 |
RP Finanz GmbH |
Germany |
81.6 |
100 |
Docter Optics S.E. |
Germany |
81.6 |
100 |
Docter Optics Components GmbH |
Germany |
81.6 |
100 |
HELLA Werkzeug Technologiezentrum GmbH |
Germany |
81.6 |
100 |
HELLA Corporate Center GmbH |
Germany |
81.6 |
100 |
HELLA Gutmann Holding GmbH |
Germany |
81.6 |
100 |
HELLA Gutmann Solutions GmbH |
Germany |
81.6 |
100 |
HELLA Gutmann Anlagenvermietung GmbH |
Germany |
81.6 |
100 |
(1) Cumulated percentages of interest for fully consolidated companies. (a) Application of section 264 (3) HGB (German Commercial Code). (b) Application of section 291(2) HGB (German Commercial Code). |
|||
TecMotive GmbH |
Germany |
81.6 |
100 |
HELLA Geschaftsfuhrungsgesellschaft GmbH |
Germany |
81.6 |
100 |
HELLA Holding International GmbH |
Germany |
81.6 |
100 |
Faurecia Hydrogen Solutions Germany |
Germany |
100 |
100 |
Argentina |
|
|
|
Faurecia Sistemas De Escape Argentina S.A. |
Argentina |
100 |
100 |
Faurecia Argentina S.A. |
Argentina |
100 |
100 |
SAS Automotriz Argentina S.A. |
Argentina |
100 |
100 |
Australia |
|
|
|
HELLA Asia Pacific Pty Ltd |
Australia |
81.6 |
100 |
HELLA Australia Pty Ltd |
Australia |
81.6 |
100 |
HELLA Asia Pacific Holdings Pty Ltd |
Australia |
81.6 |
100 |
Austria |
|
|
|
Faurecia Angell-Demmel GmbH |
Austria |
100 |
100 |
HELLA Handel Austria GmbH |
Austria |
81.6 |
100 |
HELLA Fahrzeugteile Austria GmbH |
Austria |
81.6 |
100 |
Belgium |
|
|
|
Faurecia Automotive Belgium |
Belgium |
100 |
100 |
Brazil |
|
|
|
Faurecia Automotive do Brasil, Ltda |
Brazil |
100 |
100 |
FMM Pernambuco Componentes Automotivos, Ltda |
Brazil |
51 |
100 |
SAS Automotive Do Brazil Ltda. |
Brazil |
100 |
100 |
HELLA do Brazil Automotive Ltda. |
Brazil |
81.6 |
100 |
Canada |
|
|
|
Faurecia Emissions Control Technologies Canada, Ltd |
Canada |
100 |
100 |
Irystec Software Inc. |
Canada |
100 |
100 |
China |
|
|
|
Faurecia Exhaust Systems Changchun Co., Ltd |
China |
51 |
100 |
Changchun Faurecia Xuyang Automotive Seat Co., Ltd |
China |
60 |
100 |
Faurecia - GSK (Wuhan) Automotive Seating Co., Ltd |
China |
51 |
100 |
Faurecia (Wuxi) Seating Components Co., Ltd |
China |
100 |
100 |
Faurecia Tongda Exhaust Systems Wuhan Co., Ltd |
China |
50 |
100 |
Faurecia Honghu Exhaust Systems Shanghai, Co., Ltd |
China |
66 |
100 |
Faurecia (Changchun) Automotive Systems Co., Ltd |
China |
100 |
100 |
Faurecia Emissions Control Technologies Development (Shanghai) Co., Ltd |
China |
100 |
100 |
Faurecia (Shanghai) Automotive Systems Co., Ltd |
China |
100 |
100 |
Faurecia (Qingdao) Exhaust Systems Co., Ltd |
China |
100 |
100 |
(1) Cumulated percentages of interest for fully consolidated companies. (a) Application of section 264 (3) HGB (German Commercial Code). (b) Application of section 291(2) HGB (German Commercial Code). |
|||
Faurecia (China) Holding Co., Ltd |
China |
100 |
100 |
Faurecia (Guangzhou) Automotive Systems Co., Ltd |
China |
100 |
100 |
Faurecia Emissions Control Technologies (Chongqing) Co., Ltd |
China |
72.5 |
100 |
Faurecia Emissions Control Technologies (Yantaï) Co., Ltd |
China |
100 |
100 |
Faurecia (Chengdu) Emissions Control Technologies Co., Ltd |
China |
51 |
100 |
Faurecia (Nanjing) Automotive Systems Co., Ltd |
China |
100 |
100 |
Faurecia (Shenyang) Automotive Systems Co., Ltd |
China |
100 |
100 |
Faurecia (Wuhan) Automotive Components Systems Co., Ltd |
China |
100 |
100 |
Changchun Faurecia Xuyang Interior Systems Co., Ltd |
China |
60 |
100 |
Chengdu Faurecia Limin Automotive Systems Co., Ltd |
China |
100 |
100 |
Faurecia (Yancheng) Automotive Systems Co., Ltd |
China |
100 |
100 |
CSM Faurecia Automotive Parts Co., Ltd |
China |
50 |
100 |
Faurecia NHK (Xiangyang) Automotive Seating Co., Ltd |
China |
51 |
100 |
Faurecia Emissions Control Technologies (Beijing) Co., Ltd |
China |
100 |
100 |
Faurecia Emissions Control Technologies (Nanchang) Co., Ltd |
China |
51 |
100 |
Faurecia Emissions Control Technologies (Ningbo) Co., Ltd |
China |
100 |
100 |
Faurecia Emissions Control Technologies (Foshan) Co., Ltd |
China |
51 |
100 |
Foshan Faurecia Xuyang Interior Systems Co., Ltd |
China |
60 |
100 |
Faurecia PowerGreen Emissions Control Technologies (Shanghai) Co., Ltd |
China |
100 |
100 |
Shanghai Faurecia Automotive Seating Co., Ltd |
China |
55 |
100 |
Changsha Faurecia Emissions Control Technologies Co., Ltd |
China |
100 |
100 |
Dongfeng Faurecia Automotive Interior Co., Ltd |
China |
50 |
100 |
Borgward Faurecia (Tianjin) Auto Systems Co., Ltd |
China |
51 |
100 |
Faurecia Exhaust Systems (Shanghai) Co., Ltd |
China |
100 |
100 |
Faurecia (Jimo) Emissions Control Technologies Co., Ltd |
China |
100 |
100 |
Faurecia (Tianjin) Emission Control Technologies Co., Ltd |
China |
51 |
100 |
Faurecia Yinlun (Weifang) Emission Control Technologies Co., Ltd |
China |
52 |
100 |
Tianjin Faurecia Xuyang Automotive System Co., Ltd |
China |
60 |
100 |
Dongfeng Faurecia Emissions Control Technologies Co., Ltd |
China |
50 |
100 |
Faurecia (Changshu) Automotive System Co., Ltd |
China |
60 |
100 |
Faurecia (Liuzhou) Automotive Seating Co., Ltd |
China |
50 |
100 |
Faurecia Clarion Electronic Fengcheng Co., Ltd |
China |
100 |
100 |
Shenzhen Faurecia Automotive Parts Co., Ltd |
China |
70 |
100 |
Faurecia (Hangzhou) Automotive Systems Co., Ltd |
China |
100 |
100 |
Faurecia (Liuzhou) Automotive Interior Systems Co., Ltd |
China |
50 |
100 |
Faurecia Clarion Electronic Foshan Co., Ltd |
China |
100 |
100 |
Faurecia Chongqing Zhuotong Automotive Interior Systems Co., Ltd |
China |
50 |
100 |
(1) Cumulated percentages of interest for fully consolidated companies. (a) Application of section 264 (3) HGB (German Commercial Code). (b) Application of section 291(2) HGB (German Commercial Code). |
|||
Shanghai Faurecia Automotive Seating component Co., Ltd |
China |
55 |
100 |
Parrot Automotive Shenzhen |
China |
100 |
100 |
HUG Engineering Shanghai Co., Ltd |
China |
100 |
100 |
Faurecia Clarion Electronics (Dongguan) Co. Ltd |
China |
100 |
100 |
Faurecia Clarion Electronics (Xiamen) Co. Ltd |
China |
100 |
100 |
Chengdu Faurecia Xuyang Automotive Seat Co., Ltd |
China |
60 |
100 |
Zhejiang Faurecia Interior & Exterior Systems Co., Ltd |
China |
100 |
100 |
SAS Automotive Systems (Shanghai) Co., Ltd |
China |
100 |
100 |
Faurecia Clarion Electronic Chongqing Ltd |
China |
100 |
100 |
Changchun Faurecia Xuyang Display Technology Co., Ltd |
China |
55 |
100 |
Nanjing Faurecia Emission Control Technology Co.,ltd |
China |
66 |
100 |
Faurecia (Shanghai) Automotive Component Co.Ltd |
China |
100 |
100 |
Faurecia (Jiaxing) Automotive Systems Co., Ltd |
China |
100 |
100 |
Faurecia CLD Safety Technology (Shenyang) Co., Ltd |
China |
65 |
100 |
Faurecia Clarion (Wuhan) |
China |
100 |
100 |
HELLA Shanghai Electronics Co., Ltd |
China |
81.6 |
100 |
HELLA Changchun Tooling Co., Ltd |
China |
81.6 |
100 |
HELLA Corporate Center (China) Co., Ltd |
China |
81.6 |
100 |
Changchun HELLA Automotive Lighting Ltd |
China |
81.6 |
100 |
Beifang HELLA Automotive Lighting Ltd |
China |
81.6 |
100 |
HELLA Trading (Shanghai) Co., Ltd |
China |
81.6 |
100 |
HELLA China Holding Co., Ltd |
China |
81.6 |
100 |
HELLA (Xiamen) Electronic Device Co., Ltd |
China |
81.6 |
100 |
Jiaxing HELLA Lighting Co., Ltd |
China |
81.6 |
100 |
Xian Faurecia Automotive Parts Co., Ltd |
China |
70 |
100 |
Changzhou Faurecia Automotive Parts Co., Ltd |
China |
70 |
100 |
Changchun FAWSN Faurecia Cockpit of Future System Co., Ltd |
China |
50 |
100 |
Faurecia Clarion Electronics Asia Pacific Limited |
China |
100 |
100 |
Chang Ming Co., Ltd |
China |
100 |
100 |
Clarion (H.K.) Industries Co., Ltd |
China |
100 |
100 |
China Taiwan |
|
|
|
Covatech Inc. |
China Taiwan |
100 |
100 |
Clarion (Taiwan) Manufacturing Co., Ltd |
China Taiwan |
100 |
100 |
South Korea |
|
|
|
Faurecia Korea, Ltd |
South Korea |
100 |
100 |
FCM Yeongcheon |
South Korea |
100 |
100 |
FAS Yeongcheon |
South Korea |
100 |
100 |
Docter Optics Asia Ltd |
South Korea |
81.6 |
100 |
(1) Cumulated percentages of interest for fully consolidated companies. (a) Application of section 264 (3) HGB (German Commercial Code). (b) Application of section 291(2) HGB (German Commercial Code). |
|||
HELLA Korea Inc. |
South Korea |
81.6 |
100 |
Faurecia Hydrogen Solutions Korea |
South Korea |
100 |
100 |
Denmark |
|
|
|
AMMINEX Emissions Technology A/S |
Denmark |
100 |
100 |
HELLA Gutmann Solutions A/S |
Denmark |
81.6 |
100 |
HELLA A/S |
Denmark |
81.6 |
100 |
United Arab Emirates |
|
|
|
HELLA Middle East FZE |
United Arab Emirates |
81.6 |
100 |
HELLA Middle East LLC |
United Arab Emirates |
40 |
100 |
Spain |
|
|
|
Asientos de Castilla Leon, S.A. |
Spain |
100 |
100 |
Asientos del Norte, S.A. |
Spain |
100 |
100 |
Faurecia Asientos Para Automovil España, S.A. |
Spain |
100 |
100 |
Faurecia Sistemas De Escape España, SA |
Spain |
100 |
100 |
Tecnoconfort |
Spain |
50 |
100 |
Asientos de Galicia, SL |
Spain |
100 |
100 |
Faurecia Automotive España, SL |
Spain |
100 |
100 |
Faurecia Interior System España, S.A. |
Spain |
100 |
100 |
Faurecia Interior System SALC España, S.L. |
Spain |
100 |
100 |
Valencia Modulos de Puertas, SL |
Spain |
100 |
100 |
Faurecia Emissions Control Technologies, Pamplona, SL |
Spain |
100 |
100 |
Incalplas, SL |
Spain |
100 |
100 |
Faurecia Holding España SL |
Spain |
100 |
100 |
SAS Autosystemtechnik S.A. |
Spain |
100 |
100 |
HELLA España Holdings S. L. |
Spain |
81.6 |
100 |
Manufacturas y Accesorios Electricos S.A. |
Spain |
81.6 |
100 |
HELLA S.A. |
Spain |
81.6 |
100 |
United States |
|
|
|
Faurecia Emissions Control Systems NA, LLC |
United States |
100 |
100 |
Faurecia Automotive Seating, LLC |
United States |
100 |
100 |
Faurecia USA Holdings, Inc. |
United States |
100 |
100 |
Faurecia Emissions Control Technologies, USA, LLC |
United States |
100 |
100 |
Faurecia Interior Systems, Inc. |
United States |
100 |
100 |
Faurecia Madison Automotive Seating, Inc. |
United States |
100 |
100 |
Faurecia Interiors Louisville, LLC |
United States |
100 |
100 |
Faurecia Interior Systems Saline, LLC |
United States |
100 |
100 |
Faurecia Mexico Holdings, LLC |
United States |
100 |
100 |
FNK North America, Inc |
United States |
100 |
100 |
(1) Cumulated percentages of interest for fully consolidated companies. (a) Application of section 264 (3) HGB (German Commercial Code). (b) Application of section 291(2) HGB (German Commercial Code). |
|||
Faurecia North America, Inc. |
United States |
100 |
100 |
Hug Engineering Inc. |
United States |
100 |
100 |
Faurecia DMS |
United States |
100 |
100 |
Clarion Corporation of America |
United States |
100 |
100 |
SAS Automotive Usa Inc. |
United States |
100 |
100 |
Docter Optics Inc. |
United States |
81.6 |
100 |
HELLA Corporate Center USA, Inc. |
United States |
81.6 |
100 |
HELLA Electronics Corporation |
United States |
81.6 |
100 |
HELLA Automotive Sales, Inc. |
United States |
81.6 |
100 |
HELLA Ventures, LLC |
United States |
81.6 |
100 |
France |
|
|
|
Faurecia Sièges d’automobile |
France |
100 |
100 |
Faurecia Industries |
France |
100 |
100 |
ECSA - Études et Construction de Sièges pour l’Automobile |
France |
100 |
100 |
Siedoubs |
France |
100 |
100 |
Sielest |
France |
100 |
100 |
Siemar |
France |
100 |
100 |
Faurecia Seating Flers |
France |
100 |
100 |
Faurecia Investments |
France |
100 |
100 |
Trecia |
France |
100 |
100 |
Faurecia Automotive Holdings |
France |
100 |
100 |
Faurecia Intérieur Industrie |
France |
100 |
100 |
Faurecia Systèmes d’Echappement |
France |
100 |
100 |
Faurecia Services Groupe |
France |
100 |
100 |
Faurecia Exhaust International |
France |
100 |
100 |
Faurecia Exhaust Russia Holding |
France |
100 |
100 |
Sustainable Materials |
France |
100 |
100 |
Faurecia Hydrogen Solutions |
France |
100 |
100 |
Faurecia Ventures |
France |
100 |
100 |
Faurecia Automotive Composites |
France |
100 |
100 |
Hambach Automotive Exteriors |
France |
100 |
100 |
Hennape Six |
France |
100 |
100 |
Faurecia Clarion Electronics Europe S.A.S. |
France |
100 |
100 |
Clarion Europe S.A.S |
France |
100 |
100 |
SAS Automotive France S.A.S.U. |
France |
100 |
100 |
SAS Logistics France S.A.S.U |
France |
100 |
100 |
Cockpit Automotive Systems Rennes S.A.S.U |
France |
100 |
100 |
Ullit |
France |
100 |
100 |
(1) Cumulated percentages of interest for fully consolidated companies. (a) Application of section 264 (3) HGB (German Commercial Code). (b) Application of section 291(2) HGB (German Commercial Code). |
|||
HELLA S.A.S. |
France |
81.6 |
100 |
HELLA Engineering France S.A.S. |
France |
81.6 |
100 |
Great Britain |
|
|
|
Faurecia Automotive Seating UK, Ltd |
Great Britain |
100 |
100 |
Faurecia Midlands, Ltd |
Great Britain |
100 |
100 |
SAI Automotive Fradley, Ltd |
Great Britain |
100 |
100 |
SAI Automotive Washington, Ltd |
Great Britain |
100 |
100 |
Faurecia Emissions Control Technologies UK, Ltd |
Great Britain |
100 |
100 |
Design LED Products, Ltd |
Great Britain |
100 |
100 |
HELLA UK Holdings Limited |
Great Britain |
81.6 |
100 |
HELLA Limited |
Great Britain |
81.6 |
100 |
Hungary |
|
|
|
Faurecia Emissions Control Technologies, Hungary Kft |
Hungary |
100 |
100 |
Clarion Hungary Electronics Kft. |
Hungary |
100 |
100 |
HELLA Hungaria Kft. |
Hungary |
81.6 |
100 |
India |
|
|
|
Faurecia Automotive Seating India Private, Ltd |
India |
100 |
100 |
Faurecia Emissions Control Technologies India Private, Ltd |
India |
74 |
100 |
Faurecia Interior Systems India Private, Ltd |
India |
100 |
100 |
Clarion India Pvt, Ltd |
India |
100 |
100 |
HELLA India Automotive Private Limited |
India |
81.6 |
100 |
HELLA Emobionics Pvt Ltd |
India |
81.6 |
100 |
HELLA India Lighting Ltd |
India |
67.5 |
100 |
Indonesia |
|
|
|
PT Faurecia Clean Mobility Indonesia |
Indonesia |
100 |
100 |
Israel |
|
|
|
Faurecia Security Technologies |
Israel |
100 |
100 |
Italy |
|
|
|
Faurecia Emissions Control Technologies, Italy SRL |
Italy |
100 |
100 |
Hug Engineering Italia S.r.l. |
Italy |
100 |
100 |
HELLA S.p.A. |
Italy |
81.6 |
100 |
Japan |
|
|
|
Faurecia Japan K.K. |
Japan |
100 |
100 |
Faurecia Howa Interiors Co., Ltd |
Japan |
50 |
100 |
Faurecia Clarion Electronics Co., Ltd |
Japan |
100 |
100 |
Clarion Sales and Marketing Co., Ltd |
Japan |
100 |
100 |
Lithuania |
|
|
|
UAB HELLA Lithuania |
Lithuania |
81.6 |
100 |
(1) Cumulated percentages of interest for fully consolidated companies. (a) Application of section 264 (3) HGB (German Commercial Code). (b) Application of section 291(2) HGB (German Commercial Code). |
|||
Luxembourg |
|
|
|
FORVIA Ré |
Luxembourg |
100 |
100 |
Morocco |
|
|
|
Faurecia Équipements Automobiles Maroc |
Morocco |
100 |
100 |
Faurecia Automotive Systems Technologies |
Morocco |
100 |
100 |
Faurecia Automotive Industries Morocco SARL |
Morocco |
100 |
100 |
Mexico |
|
|
|
Faurecia Sistemas Automotrices de Mexico, S.A. de C.V. |
Mexico |
100 |
100 |
Servicios Corporativos de Personal Especializado, S.A. de C.V. |
Mexico |
100 |
100 |
Faurecia Howa Interior Mexico, S.A. de C.V. |
Mexico |
51 |
100 |
Electronica Clarion, S.A. de C.V. |
Mexico |
100 |
100 |
SAS Automotive Systems S.A. De C.V. |
Mexico |
100 |
100 |
HELLA Centro Corporativo Mexico S.A. de C.V. |
Mexico |
81.6 |
100 |
HELLA Automotive Mexico S.A. de C.V. |
Mexico |
81.6 |
100 |
HELLAmex S.A. de C.V. |
Mexico |
81.6 |
100 |
Norway |
|
|
|
HELLA Gutmann Solutions AS |
Norway |
81.6 |
100 |
New Zealand |
|
|
|
HELLA-New Zealand Limited |
New Zealand |
81.6 |
100 |
Netherlands |
|
|
|
ET Dutch Holdings BV |
Netherlands |
100 |
100 |
Faurecia Emissions Control Technologies Netherlands BV |
Netherlands |
100 |
100 |
Hug Engineering BV |
Netherlands |
100 |
100 |
HELLA Finance International BV |
Netherlands |
81.6 |
100 |
HELLA Benelux BV |
Netherlands |
81.6 |
100 |
Poland |
|
|
|
Faurecia Automotive Polska S.A. |
Poland |
100 |
100 |
Faurecia Walbrzych S.A. |
Poland |
100 |
100 |
Faurecia Grojec R&D Center S.A. |
Poland |
100 |
100 |
Faurecia Gorzow S.A. |
Poland |
100 |
100 |
Faurecia Legnica Decoration S.A |
Poland |
100 |
100 |
HELLA Polska Sp. z o.o. |
Poland |
81.6 |
100 |
Portugal |
|
|
|
Faurecia - Assentos de Automovel, Lda |
Portugal |
100 |
100 |
SASAL |
Portugal |
100 |
100 |
Faurecia - SIstemas De Escape Portugal, Lda |
Portugal |
100 |
100 |
EDA - Estofagem de Assentos, Lda |
Portugal |
100 |
100 |
Faurecia Sistemas de Interior de Portugal, Componentes Para Automoveis S.A. |
Portugal |
100 |
100 |
SAS Automotive De Portugal Unipessoal Ltda. |
Portugal |
100 |
100 |
(1) Cumulated percentages of interest for fully consolidated companies. (a) Application of section 264 (3) HGB (German Commercial Code). (b) Application of section 291(2) HGB (German Commercial Code). |
|||
Czech Republic |
|
|
|
Faurecia Exhaust Systems, S.R.O. |
Czech Republic |
100 |
100 |
Faurecia Automotive Czech Republic, S.R.O. |
Czech Republic |
100 |
100 |
Faurecia Interior Systems Bohemia, S.R.O. |
Czech Republic |
100 |
100 |
Faurecia Components Pisek, S.R.O. |
Czech Republic |
100 |
100 |
Faurecia Interiors Pardubice, S.R.O. |
Czech Republic |
100 |
100 |
Faurecia Emissions Control Technologies Mlada Boleslav, S.R.O. |
Czech Republic |
100 |
100 |
Faurecia Plzen |
Czech Republic |
100 |
100 |
SAS Autosystemtechnik S.R.O. |
Czech Republic |
100 |
100 |
Docter Optics s.r.o. |
Czech Republic |
81.6 |
100 |
HELLA Autotechnik Nova s.r.o. |
Czech Republic |
81.6 |
100 |
Romania |
|
|
|
Faurecia Romania S.R.L. |
Romania |
100 |
100 |
Euro Auto Plastic Systems S.R.L. |
Romania |
50 |
100 |
HELLA Romania s.r.l. |
Romania |
81.6 |
100 |
Russia |
|
|
|
OOO Faurecia Interior Luga |
Russia |
100 |
100 |
OOO Faurecia Environmental Solutions - Russia |
Russia |
100 |
100 |
OOO Faurecia Automotive Development |
Russia |
100 |
100 |
OOO Faurecia Automotive Solutions |
Russia |
100 |
100 |
JSC Faurecia Interior Togliatti |
Russia |
100 |
100 |
HELLA OOO |
Russia |
81.6 |
100 |
Singapore |
|
|
|
HELLA Asia Singapore Pte. Ltd |
Singapore |
81.6 |
100 |
Slovakia |
|
|
|
Faurecia Automotive Slovakia S.R.O. |
Slovakia |
100 |
100 |
SAS Automotive S.R.O. |
Slovakia |
100 |
100 |
HELLA Innenleuchten-Systeme Bratislava, s.r.o. |
Slovakia |
81.6 |
100 |
HELLA Slovakia Holding s.r.o. |
Slovakia |
81.6 |
100 |
HELLA Slovakia Signal-Lighting s.r.o. |
Slovakia |
81.6 |
100 |
Slovenia |
|
|
|
HELLA Saturnus Slovenija d.o.o. |
Slovenia |
81.6 |
100 |
Sweden |
|
|
|
Faurecia Interior Systems Sweden AB |
Sweden |
100 |
100 |
Faurecia CREO |
Sweden |
100 |
100 |
Switzerland |
|
|
|
Hug Engineering AG |
Switzerland |
100 |
100 |
Faurecia Switzerland Sàrl |
Switzerland |
100 |
100 |
Faurecia Switzerland Group AG |
Switzerland |
100 |
100 |
(1) Cumulated percentages of interest for fully consolidated companies. (a) Application of section 264 (3) HGB (German Commercial Code). (b) Application of section 291(2) HGB (German Commercial Code). |
|||
Thailand |
|
|
|
Faurecia Interior Systems (Thailand) Co., Ltd |
Thailand |
100 |
100 |
Faurecia Emissions Control Technologies, Thaïland Co., Ltd |
Thailand |
100 |
100 |
Faurecia & Summit Interior Systems (Thailand) Co., Ltd |
Thailand |
50 |
100 |
Clarion Asia (Thailand) Co., Ltd |
Thailand |
100 |
100 |
Tunisia |
|
|
|
Société Tunisienne D’Équipements d’Automobile |
Tunisia |
100 |
100 |
Faurecia Informatique Tunisie |
Tunisia |
100 |
100 |
Turkey |
|
|
|
Faurecia Polifleks Otomotiv Sanayi Ve Ticaret Anonim Sirketi |
Turkey |
100 |
100 |
SAS Otosistem Teknik Ticaret Ve Limited Sirketi |
Turkey |
100 |
100 |
Intermobil Otomotiv Mumessillik Ve Ticaret A.S. |
Turkey |
45.7 |
100 |
Uruguay |
|
|
|
Faurecia Automotive Del Uruguay, S.A. |
Uruguay |
100 |
100 |
Vietnam |
|
|
|
Faurecia Vietnam Haiphong |
Vietnam |
100 |
100 |
HELLA Vietnam Company Limited |
Vietnam |
81.6 |
100 |
II - Companies accounted for by the equity method |
|
|
|
Germany |
|
|
|
Behr-HELLA Thermocontrol GmbH |
Germany |
40.8 |
40.8 |
InnoSenT GmbH |
Germany |
40.8 |
40.8 |
HELLA Pagid GmbH |
Germany |
40.8 |
40.8 |
China |
|
|
|
Changchun Xuyang Faurecia Acoustics & Soft Trim Co., Ltd |
China |
40 |
40 |
Jinan Jidao Auto Parts Co., Ltd |
China |
50 |
50 |
Changchun Faurecia Xuyang Automotive Components Technologies R&D Co., Ltd |
China |
45 |
45 |
Dongfeng Faurecia (Wuhan) Automotive Parts Sales Co., Ltd |
China |
50 |
50 |
Qinhuangdao WKW-FAD Automotive Interior Parts Co., Ltd |
China |
50 |
50 |
Dongfeng Faurecia (Xiangyang) Emissions Systems Co., Ltd |
China |
50 |
50 |
Faurecia Liuzhou Automotive Seating Sales Co., Ltd |
China |
50 |
50 |
Chongqing Guangneng Faurecia Interior Systems Co., Ltd |
China |
50 |
50 |
Faurecia (Liuzhou) Emissions Control Technologies Co., Ltd |
China |
50 |
50 |
Wuhan Clarion Kotei Software Technology Co., Ltd |
China |
25 |
25 |
Beijing BAIC Faurecia Automotive Systems Co., Ltd |
China |
50 |
50 |
Kaishi Faurecia Aftertreatment Control Technologies Co., Ltd |
China |
35 |
35 |
Changchun HELLA Faway Automotive Lighting Co., Ltd |
China |
40 |
40 |
Beijing HELLA BHAP Automotive Lighting Co., Ltd |
China |
40.8 |
40.8 |
(1) Cumulated percentages of interest for fully consolidated companies. (a) Application of section 264 (3) HGB (German Commercial Code). (b) Application of section 291(2) HGB (German Commercial Code). |
|||
HELLA BHAP (Sanhe) Automotive Lighting Co., Ltd |
China |
40.8 |
40.8 |
HELLA BHAP (Tianjin) Automotive Lighting Co., Ltd |
China |
40.8 |
40.8 |
HELLA BHAP Electronics (Jiangsu) Co., Ltd |
China |
40.8 |
40.8 |
HELLA Evergrande Electronics (Shenzhen) Co., Ltd |
China |
40 |
40 |
HELLA MINTH Jiaxing Automotive Parts Co., Ltd |
China |
40.8 |
40.8 |
HELLA Evergrande Electronics (Yangzhou) Co., Ltd |
China |
40 |
40 |
Faway Hainuo Automotive Technology (Changzhou) Co., Ltd |
China |
24.4 |
24.4 |
Beijing SamLip Automotive Lighting Ltd |
China |
20 |
20 |
Spain |
|
|
|
Componentes de Vehiculos de Galicia, S.A. |
Spain |
50 |
50 |
Copo Iberica, S.A. |
Spain |
50 |
50 |
United States |
|
|
|
Detroit Manufacturing Systems, LLC |
United States |
49 |
49 |
DMS leverage lender, LLC |
United States |
49 |
49 |
DMS Toledo, LLC |
United States |
49 |
49 |
Total Network Manufacturing LLC |
United States |
49 |
49 |
France |
|
|
|
Automotive Performance Materials (APM) |
France |
50 |
50 |
Symbio |
France |
50 |
50 |
India |
|
|
|
NHK F. Krishna India Automotive Seating Private, Ltd |
India |
19 |
19 |
Basis Mold India Private Limited |
India |
38 |
38 |
Italy |
|
|
|
Ligneos Srl |
Italy |
50 |
50 |
Japan |
|
|
|
Faurecia - NHK Co., Ltd |
Japan |
50 |
50 |
Malaysia |
|
|
|
Clarion (Malaysia) Sdn. Bhd. |
Malaysia |
45 |
45 |
Mexico |
|
|
|
GMD Stamping Mexico S.A. de C.V. |
Mexico |
49 |
49 |
Portugal |
|
|
|
Vanpro Assentos, Lda |
Portugal |
50 |
50 |
Faurecia Aptoide Automotive, Lda |
Portugal |
50 |
50 |
Turkey |
|
|
|
Teknik Malzeme Ticaret Ve Sanayi AS |
Turkey |
50 |
50 |
(1) Cumulated percentages of interest for fully consolidated companies. (a) Application of section 264 (3) HGB (German Commercial Code). (b) Application of section 291(2) HGB (German Commercial Code). |
1.4.Statutory auditors’ report on the consolidated financial statements for the year ended December 31, 2022
This is a translation into English of the statutory auditors’ report on the consolidated financial statements of the Company issued in French and it is provided solely for the convenience of English-speaking users.
This statutory auditors’ report includes information required by European regulations and French law, such as information about the appointment of the statutory auditors or verification of the information concerning the Group presented in the management report and other documents provided to shareholders.
This report should be read in conjunction with, and construed in accordance with, French law and professional auditing standards applicable in France.
Opinion
In compliance with the engagement entrusted to us by your annual general meeting, we have audited the accompanying consolidated financial statements of Faurecia for the year ended December 31st, 2022.
In our opinion, the consolidated financial statements give a true and fair view of the assets and liabilities and of the financial position of the Group as at December 31st, 2022 and of the results of its operations for the year then ended in accordance with International Financial Reporting Standards as adopted by the European Union.
Basis for Opinion
Audit Framework
We conducted our audit in accordance with professional standards applicable in France. We believe that the audit evidence we have obtained is sufficient and appropriate to provide a basis for our opinion.
Our responsibilities under those standards are further described in the Statutory Auditors’ Responsibilities for the Audit of the Consolidated Financial Statements section of our report.
Independence
We conducted our audit engagement in compliance with the independence requirements of the French Commercial Code (Code de commerce) and the French Code of Ethics for Statutory Auditors (Code de déontologie de la profession de commissaire aux comptes) for the period from January 1st, 2022 to the date of our report and specifically we did not provide any prohibited non-audit services referred to in Article 5(1) of Regulation (EU) No. 537/2014.
Justification of Assessments - Key Audit Matters
In accordance with the requirements of Articles L. 823-9 and R. 823-7 of the French Commercial Code (Code de commerce) relating to the justification of our assessments we inform you of the key audit matters relating to risks of material misstatement that, in our professional judgment, were of most significance in our audit of the consolidated financial statements of the current period, as well as how we addressed those risks.
These matters were addressed in the context of our audit of the consolidated financial statements as a whole and in forming our opinion thereon, and we do not provide a separate opinion on specific items of the consolidated financial statements.
Determination of assets acquired and liabilities assumed recognized in connection with the acquisition of HELLA GmbH & Co. KGAA Group
Risk identified |
|
Our response |
---|---|---|
Faurecia filed a Tender Offer for HELLA GmbH & Co. KGAA shares on September 27th, 2021.
Faurecia completed on January 31, 2022, the acquisition of 79.5% of HELLA, comprising 60% acquired from the family pool and 19.5% as a result of the public tender offer. Faurecia also acquired additional shares on the market, representing 2.09% of HELLA shares as of March 18, 2022. Thus, Faurecia finalized the acquisition of 81,6% of HELLA’s shares for a global purchase price of €5,4 billion.
The Group determined the fair value of the identifiable assets acquired and liabilities assumed of HELLA Group at the acquisition date, in accordance with IFRS 3, as disclosed in Note 10A to the consolidated financial statements.
Following the acquisition, the groups of cash-generating units (“CGU”) were redefined with the maintenance of Seating, Clean Mobility, Interiors and the integration of Lighting (HELLA), Lifecycle solutions and Electronics (Merger of Faurecia Clarion Electronics and HELLA Electronics).
Goodwill determined within the scope of the HELLA’s purchase price accounting amounted to 3,014.0 million euros of which was allocated to the groups of Cash Generating Unit as presented in Note 10B.
We considered the determination of the fair values of the assets and liabilities recognized within the scope of the HELLA’s purchase price allocation to be a key audit matter, given the significance of the amounts in question and the estimates required to determine in particular the fair value of technologies, trademark and customer relationships as well as the measurement of HELLA’s liabilities. |
|
We considered the basis for implementing the purchase price allocation led by the Group and its external experts. In particular, with the support of our asset valuation experts, our work consisted in:
We also assessed the appropriateness of the disclosures provided in Note 10A to the consolidated financial statements. |
Impairment testing of goodwill
Risk identified |
|
Our response |
---|---|---|
The carrying amount of goodwill amounts to 5,260.3 million euros at December 31, 2022. Goodwill is allocated to the six groups of cash generating units (CGUs) corresponding to the Group’s operating segments at which goodwill is monitored for internal management purposes: Seating, Clean Mobility, Interiors, Electronics, Lighting and Lifecycle solutions. In accordance with IAS 36, goodwill is not amortized but is tested for impairment at least once a year and more often if there is an indication that it may be impaired. For the purpose of impairment testing, goodwill is allocated between groups of CGUs. A CGU is defined as the smallest identifiable group of assets that generates cash inflows that are largely independent of the cash inflows from other assets or groups of assets, as described in Note 10B to the consolidated financial statements.
Impairment tests are performed to compare the carrying amount of assets and liabilities by group of CGUs with the higher of their value in use (equal to the present value of the net future cash flows expected) and their fair value including costs of disposal. For a given group of CGUs, an impairment loss is recognized whenever its value then determined falls below its carrying amount.
The cash flow forecasts used to calculate value in use were based on the Group’s 2023-2027 forecasts for Electronics, Lighting and Lifecycle solutions and on the Group’s 2023-2025 forecasts for the other three group of CGU. Those forecasts were established during 2022 last semester. The volume assumptions used in the forecasts are based on external information sources.
As mentioned in Note 10 to the consolidated financial statements, impairment test performed as of December 31, 2022 confirmed goodwill value accounted for in the balance sheet for Seating, Clean Mobility, Interiors, Electronics, Lighting and Lifecycle solutions.
We considered the measurement of the recoverable amount of goodwill to be a key audit matter for the following reasons:
|
|
We assessed the method used by management to determine the recoverable amount of each group of CGUs in order to assess its compliance with IAS 36.
With asset valuation experts part of the audit team, we assessed the key assumptions used by management to determine projected future cash flows and, in particular:
We also assessed the appropriateness of the disclosures on goodwill provided in the notes to the consolidated financial statements. |
Accounting and recoverability of development costs
Risk identified |
|
Our response |
---|---|---|
Net capitalized development costs amount to 2,998.6 million euros at December 31, 2022.
In accordance with IAS 38, development costs incurred in connection with producing and delivering modules for specific customer orders are recorded as an intangible asset pursuant to the conditions set out in Note 11 to the consolidated financial statements.
These capitalized costs are amortized to match the quantities of parts delivered to the customer, over a period not exceeding five years except under exceptional circumstances. Research costs, and development costs that do not meet the above criteria, are expensed as incurred pursuant to the conditions set out in Note 11 to the consolidated financial statements.
As mentioned in Note 10 to the consolidated financial statements, the capitalized development costs are tested for impairment whenever there is an indication that they may be impaired. Impairment tests involve comparing the carrying amount of the tangible and intangible assets allocated to a customer contract with the present value of the net future cash flows expected to be derived from the contract, considering the best estimates of the future sales. We considered the accounting and recoverability of development costs to be a key audit matter for the following reasons:
|
|
With regard to the capitalization of development costs:
With regard to the measurement of the recoverable amount of capitalized development costs:
We also assessed the appropriateness of the disclosures provided on development costs in the notes to the consolidated financial statements.
|
Accounting and recoverability of deferred tax assets
Risk identified |
|
Our response |
---|---|---|
Deferred tax assets amount to 690.5 million euros in the balance sheet at December 31, 2022, while deferred tax liabilities amount to 390.4 million euros.
Deferred income tax assets are recognized only to the extent that it is probable that future taxable profit will be available in the short or medium term against which the temporary differences or the loss carryforward can be utilized, based on the Group’s forecasts.
The assessment of the ability to recover net deferred tax assets as of December 31, 2022 (300.1 million euros) is based on the Group’s forecasts for the long-term recovery of tax losses. The Group’s ability to recover deferred tax assets is assessed by management at the end of the year.
We considered the accounting and the recoverability of deferred tax assets to be a key audit matter due to the importance of the assumptions and judgments used by management to recognize these assets, especially in the crisis evolutive context related to Covid-19, the shortage of electronics components and the military conflict in Ukraine and considering the materiality of their amounts in the consolidated financial statements. |
|
We assessed the consistency of the assumptions used by management to recognize and measure deferred tax assets and their compliance with IAS 12.
With the support of our tax experts, we assessed the probability that the Group will be able to utilize the tax loss carryforwards currently recognized in its balance sheet, in particular with regard to:
We also assessed the consistency of the key data and assumptions underlying the taxable income projections, underlying the recognition and recoverability of deferred tax assets relating to the Tax Loss Carryforward, with the supporting items we otherwise obtained, such as, in particular, the Group’s guidance for the period 2023-2027/2025 presented to the Board of Directors, established in the context of the Covid-19 crisis, the persistent shortage of electronic components and the military conflict in Ukraine.
Lastly, we also assessed the appropriateness of the disclosures on deferred tax assets provided in the notes to the consolidated financial statements.
|
Specific Verifications
We have also performed, in accordance with professional standards applicable in France, the specific verifications required by laws and regulations of the information relating to the Group given in the Board of Directors’ management report.
We have no matters to report as to its fair presentation and its consistency with the consolidated financial statements.
We attest that the consolidated non-financial statement required by Article L. 225-102-1 of the French Commercial Code (Code de commerce) is included in the information relating to the Group given in the management report it being specified that, in accordance with Article L. 823-10 of said Code, we have verified neither the fair presentation nor the consistency with the consolidated financial statements of the information contained therein.
Report on Other Legal and Regulatory Requirements
Format of preparation of the consolidated financial statements intended to be included in the annual financial report
We have also verified, in accordance with the professional standard applicable in France relating to the procedures performed by statutory auditors regarding the annual and consolidated financial statements prepared in the European single electronic format, that the preparation of the consolidated financial statements intended to be included in the annual financial report mentioned in Article L. 451-1-2, I of the French Monetary and Financial Code (Code monétaire et financier), prepared under the Chief Executive Officer’s responsibility, complies with the single electronic format defined in Commission Delegated Regulation (EU) No. 2019/815 of 17 December 2018. Regarding consolidated financial statements, our work includes verifying that the tagging thereof complies with the format defined in the above-mentioned regulation.
On the basis of our work, we conclude that the preparation of the consolidated financial statements intended to be included in the annual financial report complies, in all material respects, with the European single electronic format.
Due to the technical limitations inherent in the macro-tagging of consolidated accounts according to the single European electronic information format, the content of certain tags in the notes may not be returned in the same way as the consolidated accounts attached to this report.
We have no responsibility to verify that the consolidated financial statements that will ultimately be included by your Company in the annual financial report filed with the AMF (Autorité des marchés financiers) agree with those on which we have performed our work.
Appointment of the Statutory Auditors
We were appointed Statutory Auditors of Faurecia by the Annual General Meetings held on May 28, 2019 for MAZARS and on June 17, 1983 for ERNST & YOUNG Audit.
At December 31, 2022, MAZARS were respectively in their fourth year of their engagement and ERNST & YOUNG were in the fourty year of total uninterrupted engagement (which is the twenty-fourth year since securities of the Company were admitted to trading on a regulated market).
Responsibilities of Management and Those Charged with Governance for the Consolidated Financial Statements
Management is responsible for the preparation and fair presentation of the consolidated financial statements in accordance with International Financial Reporting Standards as adopted by the European Union and for such internal control as Management determines is necessary to enable the preparation of consolidated financial statements that are free from material misstatement, whether due to fraud or error.
In preparing the consolidated financial statements, Management is responsible for assessing the Company’s ability to continue as a going concern, disclosing, as applicable, matters related to going concern and using the going concern basis of accounting unless it is expected to liquidate the Company or to cease operations.
The Audit Committee is responsible for monitoring the financial reporting process and the effectiveness of internal control and risks management systems and where applicable, its internal audit, regarding the accounting and financial reporting procedures.
Statutory Auditors’ Responsibilities for the Audit of the Consolidated Financial Statements
Objectives and audit approach
Our role is to issue a report on the consolidated financial statements. Our objective is to obtain reasonable assurance about whether the consolidated financial statements as a whole are free from material misstatement. Reasonable assurance is a high level of assurance, but is not a guarantee that an audit conducted in accordance with professional standards will always detect a material misstatement when it exists. Misstatements can arise from fraud or error and are considered material if, individually or in the aggregate, they could reasonably be expected to influence the economic decisions of users made on the basis of these consolidated financial statements.
As specified in Article L. 823-10-1 of the French Commercial Code (Code de commerce), our statutory audit does not include assurance on the viability of the Company or the quality of management of the affairs of the Company.
As part of an audit conducted in accordance with professional standards applicable in France, the statutory auditor exercises professional judgment throughout the audit and furthermore:
- ■Identifies and assesses the risks of material misstatement of the consolidated financial statements, whether due to fraud or error, designs and performs audit procedures responsive to those risks, and obtains audit evidence considered to be sufficient and appropriate to provide a basis for his opinion. The risk of not detecting a material misstatement resulting from fraud is higher than for one resulting from error, as fraud may involve collusion, forgery, intentional omissions, misrepresentations, or the override of internal control.
- ■Obtains an understanding of internal control relevant to the audit in order to design audit procedures that are appropriate in the circumstances, but not for the purpose of expressing an opinion on the effectiveness of the internal control.
- ■Evaluates the appropriateness of accounting policies used and the reasonableness of accounting estimates and related disclosures made by Management in the consolidated financial statements.
- ■Assesses the appropriateness of Management’s use of the going concern basis of accounting and, based on the audit evidence obtained, whether a material uncertainty exists related to events or conditions that may cast significant doubt on the Company’s ability to continue as a going concern. This assessment is based on the audit evidence obtained up to the date of his audit report. However, future events or conditions may cause the Company to cease to continue as a going concern. If the statutory auditor concludes that a material uncertainty exists, there is a requirement to draw attention in the audit report to the related disclosures in the consolidated financial statements or, if such disclosures are not provided or inadequate, to modify the opinion expressed therein.
- ■Evaluates the overall presentation of the consolidated financial statements and assesses whether these statements represent the underlying transactions and events in a manner that achieves fair presentation.
- ■Obtains sufficient appropriate audit evidence regarding the financial information of the entities or business activities within the Group to express an opinion on the consolidated financial statements. The statutory auditor is responsible for the direction, supervision and performance of the audit of the consolidated financial statements and for the opinion expressed on these consolidated financial statements.
Report to the Audit Committee
We submit to the Audit Committee a report which includes in particular a description of the scope of the audit and the audit program implemented, as well as the results of our audit. We also report significant deficiencies, if any, in internal control regarding the accounting and financial reporting procedures that we have identified.
Our report to the Audit Committee includes the risks of material misstatement that, in our professional judgment, were of most significance in the audit of the consolidated financial statements of the current period and which are therefore the key audit matters that we are required to describe in this report.
We also provide the Audit Committee with the declaration provided for in Article 6 of Regulation (EU) No. 537/2014, confirming our independence within the meaning of the rules applicable in France as set out in particular in Articles L. 822-10 to L. 822-14 of the French Commercial Code (Code de commerce) and in the French Code of Ethics for Statutory Auditors (Code de déontologie de la profession de commissaire aux comptes). Where appropriate, we discuss with the Audit Committee the risks that may reasonably be thought to bear on our independence, and the related safeguards.
1.5.Review of Company’s business and financial results
Faurecia S.E. company is a holding company which directly and indirectly provides financial, accounting, IT, executive management and administrative services to companies in the Group.
Faurecia invoices trademark royalties, calculated as a proportion of the subsidiaries’ sales. These royalties, extended since 2015 to all companies wholly owned by the Group, totaled €64.2 million in 2022, versus €52.3 million in 2021.
Results of operations
The operating profit for the year 2022 is a profit of €18.5 million to be compared to a loss of €24.5 million in 2021.
The net financial income totaled €314.0 million, compared to a net financial income of €218.2 million in 2021.
The variance is mainly due to the increase in dividends received from €208.2 million in 2021 to €277.3 million in 2022. Interest income, net of interest expense, represents €44.1 million, compared to €6.8 million in 2021.
Tax income amounted to €14.3 million, compared with €21.4 million for fiscal year 2021. This corresponds to the tax income recognized from the positive earnings of French subsidiaries that are part of the consolidated tax group.
Net income for the fiscal year showed a profit of €344.3 million (5). This compares with a profit €212.6 million in 2021.
Financial structure and net debt
The main elements of the Group's financing are detailed in note 17 to the financial statements. It should be noted, more specifically, that as a consequence of Hella acquisition on January 31, 2022, the syndicated confirmed bridge loan signed on August 13,2021 for an amount of € 5.5 billion has been drawn up to €2.9 billion in January 2022 and then reimbursed for €2.2 billion during the period, thanks to the proceeds of the June 2022 capital increase as well as of the bond issue of November 2022.
As of December 31, 2022, the Company’s shareholders’ equity, before allocation of profit for the financial year, amounted to €5,081.4 million, compared to €3,520.2 million at the end of 2021. They are in increase of €1,561.2 million, including a capital increase for €1,216.9 million.
As of December 31, 2022, Faurecia’s net debt was €3,812 million taking into account its gross debt, net of cash, marketable securities and net cash advances and intra-Group loans, compared to €2,765 million as of December 31, 2021.
Payables representing €25.6 million included 37 invoices already due which were paid after December 31, 2022; receivables represented €60.5 million as of December 31, 2022, including €8.7 million past due and not settled, mainly with subsidiaries. The late payment analysis table is as follows:
|
Article D. 441 I. 1°: Invoices received, unpaid |
Article D. 441 I. 2°: Invoices issued, unpaid |
||||||||||
---|---|---|---|---|---|---|---|---|---|---|---|---|
0 day (indi- |
1 to 30 |
31 to 60 |
61 to 90 |
91 days or more |
Total (1 day and more) |
0 day (indi- |
1 to 30 |
31 to 60 |
61 to 90 |
91 days or more |
Total (1 days and more) |
|
(A) LATE PAYMENT CATEGORIES |
|
|
|
|
|
|
|
|
|
|||
Number of invoices concerned |
10 |
|
|
|
|
37 |
0 |
|
|
|
|
69 |
Number of invoices concerned (including VAT) |
41,245 |
36,622 |
9,948 |
4,143 |
38,185 |
88,899 |
0 |
7,610,216 |
77,622 |
0 |
971,173 |
8,659,011 |
% of total purchase amount for the fiscal year (including VAT) |
0.03% |
0.03% |
0.01% |
0.00% |
0.03% |
0.07% |
|
|
|
|
|
|
% of sales for the fiscal year (including VAT) |
|
|
|
|
|
|
0% |
3.31% |
0.03% |
0% |
0.42% |
3.76% |
(B) INVOICES EXCLUDED FROM (A) RELATING TO DISPUTED OR UNRECOGNIZED PAYABLES AND RECEIVABLES |
|
|||||||||||
Number of excluded invoices |
1 |
|
|
|
|
|
0 |
|
|
|
||
Total of amount of excluded invoices |
481,079 |
|
|
|
|
|
0 |
|
|
|
||
(C) REFERENCE TERMS OF PAYMENT USED (CONTRACTUAL OR STATUTORY DEADLINE - ARTICLE L. 441-6 OR ARTICLE L. 443-1 OF THE FRENCH CODE OF COMMERCE) |
||||||||||||
Tearms of payment used to calculate late payments |
x Contractual |
|
|
x Contractual |
The carrying amount of investments in subsidiaries and affiliates recognized in the balance sheet at December 31, 2022 came to €8,773.0 million (€6,157.0 million at December 31, 2021).
Business review relating to the Company’s subsidiaries
- ■Following approval from the appropriate regulatory bodies, on January 31, 2022 Faurecia completed the acquisition of 79.5% of HELLA’s share capital. Faurecia also acquired additional shares on the market, representing 2.09% of HELLA’s shares and holds 81.6% of HELLA’s shares at this date.
- ■On February 16, 2022, has been registered Changzhou Faurecia Automotive Parts Co., Ltd a new Chinese subsidiary held at 100% by Shenzhen Faurecia Automotive Parts Co., Ltd (Seating Business Group).
- ■The 40% of the equity held by Faurecia China Holdings C.o, Ltd, in the joint-venture Faurecia (Chongqing) Automotive Parts Co., Ltd, have been sold to the company Changchun Xuyang Industrial (Group) Co., Ltd”. Since February 28, 2022 (date of completion of the divestment’s registration), this entity does not belong anymore to the Faurecia group.
- ■On March 14, 2022, has been registered Xian Faurecia Automotive Parts Co., Ltd. a new Chinese subsidiary held at 100% by Shenzhen Faurecia Automotive Parts Co., Ltd. (Seating Business Group).
- ■Following the signature of a joint-venture agreement on January 12, 2022, the new JV company Changchun Fawsn Faurecia Cockpit Of Future SystEM Co., Ltd. has been registered on May 19, 2022. (Clarion Electronics Business Group)
- Shareholders:
- ■50%: CN20 – Faurecia (China) Holding Co., Ltd;
- ■30%: Changchun Fawsn Group Co., Ltd;
- ■20%: Changchun Fawsn Auto Parts Co., Ltd.
- ■The company Faurecia Emissions Control Technologies (Ningbo Hangzhou Bay New District) Co., Ltd is dissolved and officially deregistered on June 21, 2022.
- ■The 20% of the shares capital held by Electrónica Clarión S.A. de C.V. in the Mexican company Hitachi Astemo San Juan Del Rio S.A. de C.V. have been sold on June 21, 2022 to the company Hitachi Astemo Mexico, S.A. de C.V.
- ■On July 20, 2022, has been registered Faurecia Clarion Electronics (Wuhan) Co., Ltd., a new subsidiary held at 100% by Faurecia Automotive Holdings Co., Ltd. (Clarion Electronics Business Group).
- ■On August 1, 2022 have been incorporated three new French subsidiaries:
- ■Champs Pierreux Un – FR72 held at 100% by FR06 – Faurecia;
- ■Champs Pierreux Deux – FR73 held at 100% by FR06 – Faurecia;
- ■Champs Pierreux Trois – FR74 held at 100% by FR06 – Faurecia.
- These legal entities have no dedicated activity.
- ■On August 29, 2022, has been registered a new legal entity The Drivery Holding GmbH held at 100% by HELLA Aglaia Mobile Vision GmbH.
- ■Since September 5, 2022, Faurecia Automotive Holding has increased its shareholding in Chang Ming Company Limited from 82,03% to 100% further to the acquisition of shares held by the individual shareholders.
- ■On October 07, 2022, all the shares of the company Hennape Un, held at 100% by Faurecia, have been sold to Faurecia Exhaust International and its company name changed to FAURECIA HYDROGEN SOLUTIONS. (Clean Mobility Business Group).
- ■The company Coegent Global Limited was dissolved and officially deregistered on October 14, 2022.
- ■The company Faurecia Automotive Del Uruguay, Ltd is being wound up and will be officially deregistered in 2023.
- ■On November 14, 2022, has been incorporated a new a new subsidiary Faurecia Hydrogen Solutions North America, Inc. held at 100% by Faurecia Hydrogen Solutions.
- ■On December 02, 2022, has been incorporated a new subsidiary Faurecia Hydrogen Solutions Korea, Ltd held at 100% by Faurecia Hydrogen Solutions.
- ■On December 12, 2022, CN20 Faurecia Holdings China has increased its shareholding in the JV company Faurecia (Changshu) Automotive System Co., Ltd up to 60%, the partner Shanghai Dongchang Enterprises Group Co., Ltd holds 40% of the share capital of the company.
- ■On December 12, 2022, the 33.33% stake held by HELLA GmbH & Co. KGaA in the company HBPO Beteiligungsgesellschaft mbH was sold to Plastic Omnium.
- ■The Chinese subsidiary Parrot Automotive Application Products (Shenzhen) Co. Ltd is being wound up and will be officially deregisterd in 2023.
- ■The company HELLA Bekto Industries d.o.o (1353) was dissolved and closed on December 14, 2022.
- ■On December 19, 2022, all the shares of the company Champs Pierreux Un, held at 100% by Faurecia, have been sold to Faurecia Investments. (Seating Business Group).
1.6.Parent company financial statements
1.6.1.Income statement
(in € thousands) |
Notes |
2022 |
2021 |
---|---|---|---|
Services sold |
|
96,589 |
42,481 |
Sales |
|
96,589 |
42,481 |
Outside services |
|
(111,441) |
(146,373) |
Taxes other than on income |
|
(2,685) |
(2,133) |
Salaries and wages |
|
(15,524) |
(4,883) |
Payroll taxes |
|
(7,937) |
(2,435) |
Amortization, depreciation and provisions (net of reversals) and expense transfers |
3 |
(3,591) |
37,215 |
Other income/(expenses) |
4 |
63,061 |
51,583 |
Total operating income and expenses |
|
(78,117) |
(67,026) |
Net operating income |
|
18,472 |
(24,545) |
Financial income |
5 |
790,244 |
454,377 |
Financing costs |
5 |
(476,261) |
(236,186) |
Net financial income (expense) |
5 |
313,983 |
218,191 |
Operating income after net financial income |
|
332,455 |
193,646 |
Non-recurring income |
6 |
739 |
319 |
Extraordinary expenses |
6 |
(3,160) |
(2,828) |
Net non-recurring income |
6 |
(2,421) |
(2,509) |
Employee profit-sharing |
|
(9) |
(12) |
Corporate income tax |
7 |
14,300 |
21,426 |
Net income |
|
344,325 |
212,551 |
1.6.2.Balance sheet as of December 31, 2022
Assets
(in € thousands) |
Notes |
31/12/2022 |
31/12/2021 |
||
Gross amounts |
Depreciation and provisions |
Net amounts |
Net amounts |
||
Intangible assets |
8 |
105 |
25 |
80 |
80 |
Property, plant and equipment |
9 |
961 |
871 |
90 |
82 |
Investments |
10 |
12,096,072 |
215,989 |
11,880,083 |
6,472,880 |
Total fixed assets |
|
12,097,138 |
216,885 |
11,880,253 |
6,473,042 |
Operating receivables |
|
60,485 |
0 |
60,485 |
18,472 |
Other receivables |
11 |
3,263,972 |
0 |
3,263,972 |
2,832,259 |
Marketable securities |
|
|
|
0 |
0 |
and related receivables |
12 |
306,710 |
0 |
306,710 |
2,568,667 |
Cash and cash equivalents |
|
787,027 |
|
787,027 |
552,930 |
Total current assets |
|
4,418,194 |
0 |
4,418,194 |
5,972,328 |
Prepaid expenses |
13 |
2,111 |
|
2,111 |
3,114 |
Unrealized foreign exchange losses |
|
67,991 |
|
67,991 |
31,297 |
Bond redemption premiums |
|
3,813 |
|
3,813 |
5,337 |
Deferred charges |
14 |
45,953 |
|
45,953 |
88,989 |
Total assets |
|
16,635,200 |
216,885 |
16,418,315 |
12,574,107 |
Liabilities
(in € thousands) |
Notes |
31/12/2022 |
31/12/2021 |
---|---|---|---|
Capital stock |
|
1,379,625 |
966,251 |
Additional paid-in capital |
|
1,403,368 |
599,882 |
Statutory reserve |
|
106,125 |
96,625 |
Untaxed reserves |
|
8,939 |
8,939 |
Other reserves |
|
0 |
0 |
Retained earnings |
|
1,839,016 |
1,635,965 |
Net income for the fiscal year |
|
344,325 |
212,551 |
Total shareholders’ equity |
15 |
5,081,398 |
3,520,213 |
Provisions for contingencies and charges |
16 |
28,512 |
16,333 |
Total debt |
17 |
9,139,548 |
7,111,486 |
Operating payables |
18 |
54,102 |
53,729 |
Sundry payables |
18 |
2,069,172 |
1,850,887 |
Total operating payables and other payables |
|
2,123,274 |
1,904,616 |
Prepaid income |
|
145 |
145 |
Unrealized foreign exchange gains |
|
45,438 |
21,314 |
Total equity and liabilities |
|
16,418,315 |
12,574,107 |
1.6.3.Notes to the 2022 parent company financial statements
Contents
Note 1Summary of significant accounting policies
The annual financial statements were established in accordance with the general principles for preparing and presenting annual financial statements (ANC Regulation No. 2014-03 of June 5, 2014), relating to the PCG [Plan Comptable Général (General Accounting Plan)], amended by the regulations of the Comité de la Réglementation Comptable [Accounting Regulations Committee] and the Autorité des Normes Comptables [Accounting Standards Authority]. The main policies applied are as follows:
The Faurecia’s financial statements are presented in euros. Except if specifically specified, amounts are in millions of euros; generally, amounts presented are rounded to the closest unit; consequently, the sum of rounded amounts can present non significant differences to the reported total. Moreover, ratios and variances reported are computed with the detailed amounts and not with the rounded amounts.
1.1Property, plant and equipment
Property, plant and equipment are stated at acquisition or production cost. Property, plant and equipment are depreciated by the straight-line method over the estimated useful lives of the assets, as follows:
- ■buildings: twenty to thirty years;
- ■building improvements, fixtures and fittings:seven to ten years;
- ■other fixtures and fittings: ten years;
- ■office equipment and computers: three to five years;
- ■software: one to three years;
- ■furniture: ten years.
1.2Investments
The shares in subsidiaries and affiliates are composed of long-term investments that enable control of the issuing company or notable influence to be exercised over it, or that establish business relationship with the issuing company.
Gross value is equal to contribution value or cost. A provision is made if the value in use of a security is lower than its entry value. Value in use is based on the subsidiary’s revalued net assets, profitability and future outlook.
For investments intended to be sold, value-in-use estimates also take into account prices at which prior transactions were carried out, if any.
The impacts of Group commitment on carbon neutrality as well as the consequences of governmental policies linked to the global warming are as well part of the assumptions used for these forecasts provided that these are measurable.
1.3Marketable securities and related receivables
1.4Foreign currency transactions
Unhedged payables and receivables in foreign currency are translated at the exchange rate prevailing on the transaction date. At the balance sheet date, they are remeasured at the year-end exchange rate. Gains or losses resulting therefrom are recognized under “Unrealized foreign exchange losses” for unrealized losses and under “Unrealized foreign exchange gains” for unrealized gains. “Unrealized foreign exchange losses” are accrued for up to the non-hedged amount.
1.5Cash and cash equivalents
1.6Provisions for pensions and other post-employment benefits
The vested rights of employees under supplementary pension and retirement bonus plans are determined on an actuarial basis using the projected unit credit method. The valuation takes into account the probability of employees staying with the Company up to retirement age and expected future compensation levels. In cases where the funds are permanently allocated to the benefit plan concerned, their value is deducted from the related liability.
1.7Non-recurring items
Unusual or non-recurring items are included under “Non-recurring income” and “Non-recurring expense”.
1.8Financial instruments
Interest-rate risks are hedged, where appropriate, using financial instruments traded over-the-counter markets with bank counterparties.
Hedging gains and losses are recognized on a symmetrical basis with the loss or gain on the hedged item.
1.9Pensions
In May 2021, the IFRS Interpretation Committee (IFRIC IC) published a decision relating to the allocation of the cost of services associated with a defined benefit plan with the following characteristics:
- ■the definitive acquisition of benefits is subject to presence in the Company at the time of retirement;
- ■the amount of benefits depends on seniority;
- ■this amount is capped at a determined number of consecutive years of service.
The application of this decision leads to the distribution of the projected rights, not over the duration of the presence of the employees in the Company, but over the last years of acquisition of the rights, taking into account, where applicable, the levels of acquisition.
In France, the accounting standards authority has also amended ANC recommendation No. 2013-02 to introduce this accounting method.
Note 2Highlights and post-balance sheet events
2.1Economical context linked to Covid-19, shortage of electronics components and military conflict in Ukraine
In 2022, worldwide automotive production grew by 6.7% vs. 2021, from 77.2 million LVs in 2021 to 82.4 million LVs in 2022. It remains significantly below the 89 millions LVs recorded in 2019, before the Covid crisis. The first-half of the year was down 1.1% year-on-year, mostly impacted by Q1 (down 3.4% vs. Q1 2021) that recorded the outbreak of the war in Ukraine in February, while the second half was up 14.8%, mostly reflecting the very low base of comparison of Q3 2021.
It was penalized by Stop and Gos from OEMs consequent to supply chain disruptions due to the war in Ukraine, by the continued shortage of semiconductors and the Covid developments in China:
- ■China was strongly penalized by the Covid-related restrictions implemented in April and May (Q2 2022 automotive production in China was down 4.7% year-on-year) and then by the increase in Covid cases late 2022, after the decision to end the zero Covid policy (Q4 2022 automotive production in China was down 5.5% year-on-year);
- ■Europe was strongly impacted by Stop & Gos related to supply chain disruptions due to the war in Ukraine and the continuous shortage of semiconductors with H1 2022 automotive production in Europe down 11.3% year-on-year vs. H1 2021, of which -17.5% in Q1 2022;
- ■shortage of semiconductors for the automotive industry continued throughout the year and could gradually ease in 2023, while it is unlikely to resolve entirely before 2024;
- ■lastly, from a macroeconomic standpoint, 2022 has been characterized by additional challenges: high inflation has broadened out across countries, energy supply risks have pushed prices up and interest rates have risen to curb inflation.
2.2HELLA acquisition refinancing
Faurecia has issued on February 1, 2023 €250 million of New Notes, sustainability-linked 7.25% senior notes due 2026. The proceeds of the issuance of the New Notes was used to fully reimburse the Bridge-to-Bond and the Bridge-to-Equity in connection with the HELLA acquisition and for general corporate purposes.
Note 3Depreciation, amortization and provisions (net of reversals) and expense transfers
(in € thousands) |
2022 |
2021 |
---|---|---|
Provision reversals |
0 |
1 |
Expense transfers (1) |
13,453 |
60,858 |
Depreciation and amortization |
(14,403) |
(22,779) |
Provisions for impairment of current assets |
|
|
Provisions for contingencies and charges |
(2,641) |
(865) |
Total |
(3,591) |
37,215 |
(1) Of which: |
|
|
|
13,453 |
54,675 |
Note 4Other income/(expenses)
Note 5Net financial income (expense)
(in € thousands) |
2022 |
2021 |
---|---|---|
Financial income |
|
|
Income from investments in subsidiaries and affiliates (1) |
277,309 |
208,157 |
Other interest and related income |
487,616 |
234,078 |
Net proceeds from sales of marketable securities |
70 |
0 |
Provision reversals (2) |
25,248 |
12,142 |
Total |
790,243 |
454,377 |
Financing costs |
|
|
Interest expense |
443,514 |
227,313 |
Charges to provisions for impairment of investments (3) |
16,700 |
0 |
Charges to other provisions and other financial expenses |
16,045 |
8,873 |
Total |
476,259 |
236,186 |
Net financial income (expense) |
313,984 |
218,191 |
(1) This item corresponds to dividends received from subsidiaries and affiliates |
|
|
|
2,000 |
4,225 |
|
198,919 |
131,185 |
|
5,486 |
7,426 |
|
7,660 |
9,286 |
|
|
32,612 |
|
62,311 |
23,423 |
|
933 |
|
(2) of which: |
|
|
|
17,900 |
6,364 |
|
7,348 |
5,702 |
(3) of which: |
|
|
|
16,700 |
|
Note 6Net non-recurring income/(expense)
(in € thousands) |
2022 |
2021 |
---|---|---|
Non-recurring income |
|
|
Proceeds from management activities |
0 |
(189) |
Proceeds from disposals of fixed assets (1) |
17 |
0 |
Proceeds from disposals of own shares |
672 |
396 |
Provision reversals |
50 |
112 |
Total |
739 |
319 |
Non-recurring expenses |
|
|
On management transactions |
112 |
2,393 |
Carrying amount of fixed and financial assets sold (2) |
70 |
0 |
Cost of own shares sold |
1,248 |
435 |
Depreciation, amortization and charges to provisions |
1,730 |
0 |
Total |
3,160 |
2,828 |
Net non-recurring income / (expense) |
(2,421) |
(2,509) |
(1) Of which proceeds from the sale of investments in subsidiaries and affiliates: |
17 |
0 |
(2) Of which carrying amounts of investments in subsidiaries and affiliates sold or transferred: |
70 |
0 |
Note 7Corporate income tax
Faurecia has elected to file a consolidated tax return. The resulting tax group includes the parent company and its main French subsidiaries. This system allows Faurecia to obtain group relief by offsetting any tax losses recorded by the Company and certain of its subsidiaries against the taxable income of other subsidiaries in the tax group:
Note 8Intangible assets
(in € thousands) |
Concessions, patents and similar rights |
Other intangible assets |
Intangible assets in progress |
Total |
---|---|---|---|---|
Amount as of December 31, 2020 |
80 |
0 |
0 |
80 |
Additions (including own work capital) |
|
|
|
0 |
Disposals |
|
|
|
0 |
Funding of depreciation, amortization and impairment provisions |
|
|
|
|
Depreciation written off on disposals |
|
|
|
0 |
Other movements |
|
|
|
|
Amount as of December 31, 2021 |
80 |
0 |
0 |
80 |
Additions (including own work capital) |
|
|
|
|
Disposals |
|
|
|
|
Funding of depreciation, amortization |
|
|
|
|
Depreciation written off on disposals |
|
|
|
|
Other movements |
|
|
|
|
Amount as of December 31, 2022 |
80 |
0 |
0 |
80 |
Note 9Property, plant and equipment
(in € thousands) |
Land |
Buildings |
Other property, plant and equipment |
Total |
---|---|---|---|---|
Amount as of December 31, 2020 |
52 |
0 |
(12) |
40 |
Additions (including own work capital) |
|
|
|
0 |
Disposals |
|
|
(2) |
(2) |
Funding of depreciation, amortization |
|
|
(68) |
(68) |
Depreciation written off on disposals |
|
|
111 |
111 |
Amount as of December 31, 2021 |
52 |
0 |
30 |
82 |
Additions (including own work capital) |
|
|
18 |
18 |
Disposals |
|
|
|
0 |
Funding of depreciation, amortization |
|
|
(60) |
(60) |
Depreciation written off on disposals |
|
|
50 |
50 |
Amount as of December 31, 2022 |
52 |
0 |
38 |
90 |
Note 10Investments
(in € thousands) |
Gross value |
Provisions |
Carrying amount |
---|---|---|---|
Amount as of December 31, 2020 |
4,671,771 |
221,053 |
4,450,718 |
Acquisitions |
29 |
|
29 |
Capital stock increases |
1,700,000 |
|
1,700,000 |
Charges to and reversals of provisions |
|
(6,364) |
6,364 |
Company liquidation |
|
|
|
Sale of shares |
|
|
0 |
Amount as of December 31, 2021 |
6,371,800 |
214,689 |
6,157,111 |
Acquisitions |
|
|
0 |
Capital increase |
2,614,741 |
|
2,614,741 |
Charges to and reversals of provisions |
|
(1,200) |
1,200 |
Company liquidation |
|
|
0 |
Sale of shares |
(39) |
|
(39) |
Amount as of December 31, 2022 |
8,986,502 |
213,489 |
8,773,013 |
Capital increases mainly concern Faurecia Investments and Faurecia GmbH on 2022 and Faurecia Investments and Faurecia Automotive Holding on 2022
Note 11Receivables
Prepaid and recoverable corporate income tax corresponds to tax credits of €6.8 million, including €4,2 million research tax credit.
Note 12Marketable securities and related receivables
Shares (in € thousands) |
Number of shares |
Amount |
---|---|---|
Amount as at December 31, 2021 |
84,171 |
3,952 |
Use of treasury stock following the conversion of bonds into shares |
|
|
Sale of preferential subscription rights |
|
(417) |
Shares buyback |
|
|
Amount as at December 31, 2022 |
84,171 |
3,535 |
(1) Following the capital increase of June 24, 2022 |
|
|
Note 13Prepaid expenses
Note 14Deferred charges
A bond issue with a nominal value of €700 million issued on November 15, 2022 (maturity date June 15, 2026 - interest rate 7.25%) generated issue costs of which €6.0 million were charged to expenses to be spread over three years.
A bilateral loan of €289 million nominal amount issued on July 25, 2022 (Maturity date July 25, 2029 - interest rate 3.474%) generated issue costs of which €0.5 million were charged to expenses to be spread over 7 years.
A bilateral loan of €50 million nominal amount issued on December 30, 2022 (50% maturing on December 30, 2024, the remainder on December 30, 2025 - EURIBOR 6 months + rate 3.6%) generated issue costs of which €0.7 million were charged to expenses to be spread over 3 years.
A supplement to the Bank of China bilateral loan (maturity date July 5, 2024 – EURIBOR 3 months + rate 0.85%) generated additional issue costs of which €0.2 million were charged to expenses to be spread over 2 years.
A renegotiation of the terms of the bridge loan set up to pre-finance the HELLA acquisition generated additional issuance costs of which €4.7 million were charged to expenses to be spread over 2022
A renegotiation of the terms of the 1.5 billion RCF credit line (not drawn down) generated additional issuance costs of which €1.5 million were charged to expenses to be spread over 3 years.
Note 15Shareholders’ equity
15.1Change in shareholders’ equity
(in € thousands) |
Amount as at 12/31/2021 |
Appropriation decision at the OGM of 05/31/2021 |
Capital stock increase |
Capital stock decrease |
Dividends |
Net income for the fiscal year |
Amount as at 12/31/2022 |
---|---|---|---|---|---|---|---|
Capital stock |
966,251 |
|
413,374 |
|
|
|
1,379,625 |
Additional paid-in capital |
599,882 |
|
803,486 |
|
|
|
1,403,368 |
Statutory reserve |
96,625 |
9,500 |
|
|
|
|
106,125 |
Untaxed reserves |
8,939 |
|
|
|
|
|
8,939 |
Other reserves |
0 |
|
|
|
|
|
0 |
Retained earnings |
1,635,964 |
203,051 |
|
|
|
|
1,839,015 |
Net income for the fiscal year |
212,551 |
(212,551) |
|
|
|
344,325 |
344,325 |
Total |
3,520,213 |
0 |
1,216,860 |
0 |
0 |
344,325 |
5,081,398 |
15.2Capital stock and premiums from equity issues, mergers and acquisitions
As at December 31, 2022, the share capital was €1,379,625,340 divided into 197,089,340 fully paid-up shares of €7 each.
15.3Free share allocation plans
In 2010, Faurecia implemented a share grant plan for executives of Group companies. These shares are subject to service and performance conditions.
In 2021, Faurecia has implemented a unique long term share grant plan (Executive Super Performance Initiative-ESPI) for the members of the Group Executive Committee. executives of Group companies. The acquisition period is 5 years without conservation condition, and the maximum amount is limited to 300% of the yearly fixed wages. These shares are subject to a service and a performance condition, the Total shareholder Return -TSR, compared to a peer group.
Date of Annual Shareholders’ Meeting |
Date of Board meeting |
Maximum number of free shares |
Performance condition |
|
---|---|---|---|---|
reaching the objective |
exceeding the objective |
|
|
|
06/26/2020 |
10/22/2020 |
875,069 |
1,138,079 |
2022 after tax income target as stated in strategic plan when granted, Faurecia earning per share growth compared to a reference group of companies and percentage of diversity men-women within the management population |
05/31/2021 |
10/25/2021 |
1,016,861 |
1,322,794 |
2023 after tax income target as stated in strategic plan when granted, Faurecia earning per share growth compared to a reference group of companies and percentage of diversity men-women within the management population |
06/01/2022 |
07/28/2022 |
1,765,390 |
2,294,250 |
For the CEO: 2024 after tax income target as stated in strategic plan when granted, Faurecia earning per share growth compared to a reference group of companies and percentage of diversity men-women within the management population For the other beneficiaries: 2024 operating income and net cash flow target as stated in strategic plan when granted, Faurecia earning per share growth compared to a reference group of companies, percentage of diversity men-women within the management population and CO2 emissions reduction target |
05/31/2021 |
07/23/2021 |
445,474 |
445,474 |
ESPI plan: Faurecia share relative performance (TSR) compared to a reference group of companies on a yearly basis For the CEO: Faurecia share relative performance (TSR) compared to a reference group of companies on average over 5 years (2021-2026) |
* Net of free shares granted cancelled. |
The performance conditions for the plan attributed by the Board of October 9, 2019 have been partially met, the corresponding shares (81,117), will be distributed in October 2023. For each of the plans presented above, the number of potential free shares has been adjusted following the capital increase in cash performed in June 2022 (see Note 15.1) in compliance with the rules and after approval of the Board, by applying a 1.0788 factor to the initial values.
Note 16Provisions for contingencies and charges
(in € thousands) |
As of 12/31/2022 |
As of 12/31/2021 |
---|---|---|
Provision for contingencies |
|
|
Foreign exchange losses |
14,521 |
6,714 |
Other |
0 |
0 |
Sub-total |
14,521 |
6,714 |
Provisions for charges |
|
|
Provision for pensions and other post-employment benefits (1) |
11,202 |
9,600 |
Other provisions for charges |
2,789 |
19 |
Sub-total |
13,991 |
9,619 |
Total |
28,512 |
16,333 |
(1) Provisions for pensions and other post-employment benefits cover the following costs payable by the Company on retirement of employees:
|
For this last obligation, she is released from her commitments by a deduction of the capital necessary for the service of the annuity that the insurance company, responsible for this service, makes from the fund set up to cover retirement commitments not yet definitively acquired. The Company therefore no longer has any obligation towards former employees.
The actuarial valuation was carried out by independent actuaries. The calculations were made on the basis of a discount rate of 3.90% and an inflation rate of 2.0%.
Executive Committee members holding an employment contract with Faurecia S.E. or one of its subsidiaries also benefit from a defined benefit plan of the additive type for French members and a defined contribution plan for foreign members. The rights acquired as of December 31, 2019 in the additive plan for French members have also been frozen based on the seniority acquired as of that date in accordance with the PACTE Act of May 22, 2019. The rights are revalued according to the evolution of salaries and the corresponding employee charges in these plans.
(in € thousands) |
Amount as at 12/31/2021 |
Additions |
Reversals (surplus provisions) |
Payments to retirement funds |
Amount as at 12/31/2022 |
---|---|---|---|---|---|
Provisions for currency risks |
6,714 |
14,521 |
(6,714) |
|
14,521 |
Provisions for pensions and other employee obligations |
9,600 |
1,601 |
|
|
11,201 |
Other provisions for charges |
21 |
2,769 |
|
|
2,790 |
Total |
16,334 |
18,891 |
(6,714) |
0 |
28,511 |
Note 17Borrowings
27.90% of the Company’s debt is at variable rates. This debt is hedged using interest-rate caps as described in Note 21.1.
The main components of Faurecia financing are described below; financing components at HELLA GmbH & KGaA are also described below as a consequence of HELLA acquisition (see Notes 2.1 &10.A).
Syndicated credit facility
On December 15, 2014, Faurecia signed a syndicated credit facility, with a five-year maturity, for an amount of €1,200 million. This credit facility was renegotiated on June 24, 2016, then on June 15, 2018 in order to extend the maturity to five years from that date. In May 2021, Faurecia has signed with its banks an Amend & Extend agreement of this syndicated credit line enabling the Group to increase the amount up to €1,500 million, as well as indexing its costs on Faurecia’s environmental performance, the interest rate varying depending upon the achievement of the Group’s target of CO2 neutrality for its scopes 1 & 2, and to extend its maturity to 5 years, i.e. May 2026, with two one-year extension options submitted to the banks’ agreement.
On April 26, 2022 Faurecia has proactively renegotiated its covenant for its bank credit lines (ratio Net debt (6)/adjusted EBITDA (7)) and which compliance is a condition affecting the availability of this credit facility. The level of this ratio was not tested for June 30, 2022 and stands at 3.75x for December 31, 2022 (instead of 3.00x) before coming back to 3.0x from June 30, 2023 onwards. As of December 31, 2022, this condition was met.
This credit facility includes some restrictive clauses on asset disposals (disposal representing over 35% of the Group’s total consolidated assets requires the prior approval of banks representing two-thirds of the syndicate) and on the debt level of some subsidiaries.
Syndicated bridge loan
On August 13, 2021, Faurecia signed a syndicated confirmed bridge loan for an amount of €5.5 billion in order to secure the financing of the HELLA acquisition, this credit facility being refinanced mainly through bonds issues and bank loans, to the exception of the €800 million part to be refinanced through a capital increase (bridge to equity).
On January 26, 2022 Faurecia has drawn €2.9 billion on this bridge loan, of which €500 million corresponding to a three years loan granted by the banks of the syndicated bridge loan.
On April 26, 2022 Faurecia has proactively renegotiated its covenant for its bank credit (ratio Net debt (1)/adjusted EBITDA (2)) and which compliance is a condition affecting the availability of this credit facility. The level of this ratio was not tested for June 30, 2022 and stands at 3.75x for December 31, 2022 (instead of 3.0x) before coming back to 3.0x from June 30, 2023 onwards.
During the year 2022, Faurecia has reimbursed in total €2.2 billion on this bridge loan, by using especially the proceeds of the €700 million capital increase launched on June 3, 2022 as well as the ones from various debts issuance further described below.
As of December 31, 2022, the bridge loan was drawn up to €705 million of which €100 million for the bridge to equity with a maturity on Faurecia’s hand on February 13, 2023, €105 million for the bridge to bond with a maturity on August 13, 2023 and €500 million of Term loan with a maturity on August 13, 2024. The bridge to bond and bridge to equity were fully reimbursed at the beginning of February 2023 (see Note 2.5).
Schuldscheindarlehen
Faurecia has signed on December 17, 2018 a private placement under German Law (Schuldscheindarlehen) for a total amount of €700 million. This transaction is structured into several tranches in EUR and USD, at fixed and variable rates, with maturities of 4, 5 and 6 years, i.e. December 2022, 2023 and 2024. €378 million have been received on December 20, 2018 and the remaining amount has been received in early January 2019. The USD tranches have been partially converted in EUR resources through long term cross-currency swaps.
On June 21, 2021 Faurecia has reimbursed by anticipation €226.5 million of the variable rate tranche of the Schuldscheindarlehen with 2022 maturity. On December 20, 2022 Faurecia has reimbursed €58.5 million of the fixed rate tranche of the Schuldscheindarlehen with 2022 maturity.
Faurecia has signed on December 17, 2021 a private placement under German Law (Schuldscheindarlehen) including ESR performance criteria for a total amount of €700 million. This transaction is structured into several tranches in EUR and USD, at fixed and variable rates, with maturities of 2.5, 4, 5 and 6 years, i.e. July 2024 and January 2026, 2027 and 2028. €435 million have been received on December 22, 2021 and the remaining amount has been received in early January 2022. The USD tranches have been partially converted in EUR resources through long term cross-currency swaps.
¥30 billion credit facility
On February 7, 2020, Faurecia has signed a credit facility in Yen for an amount of ¥30 billion, with a five-year maturity, aiming at refinancing on a long-term basis the debt of Clarion Co. Ltd. The credit facility comprises two tranches of ¥15 billion each, one being a loan and the other one a renewable credit line.
The maturity of the credit line has been extended from February 2025 to February 2026 by exercising the first extension option.
On April 26, 2022 Faurecia has proactively renegotiated its covenant for its bank credit lines (ratio Net debt (8)/adjusted EBITDA (9))and which compliance is a condition affecting the availability of this credit facility. The level of this ratio was not tested for June 30, 2022 and stands at 3.75x for December 31, 2022 (instead of 3.0x) before coming back to 3.0x from June 30, 2023 onwards. As of December 31, 2022, this condition was met.
European Investissement Bank (EIB) credit facility
On July 1, 2022, Faurecia signed a credit facility for an amount of €315 million, with a seven-year maturity with the European Investment Bank (EIB). This credit facility aims at financing investments in R&D, production and deployment of the hydrogen technology for mobility applications, advanced systems for driving assistance and driver control systems. It is composed of two tranches: (i) one for an amount of €289 million (ii) one for an amount of €26 million.
This credit facility includes a covenant on the ratio Net debt (1)/adjusted EBITDA (2) which compliance is a condition affecting the availability of this credit facility, identical to the syndicated credit facility and which cannot exceed 3.75x for December 31, 2022 and 3.0x from June 30, 2023 onwards. As of December 31, 2022, this condition was met. It includes as well some restrictive clauses on asset disposals and on the debt level of some subsidiaries.
In compliance with IAS 20, the difference between the market rate for a comparable loan at initial date and the interest rate for this loan has been recognized as a grant; it is recognized in P&L against the costs that the grant aims to compensate over the loan duration.
2025 bonds
On March 8, 2018, Faurecia issued bonds for an amount of €700 million due June 15, 2025, carrying annual interest of 2.625%, payable on June 15 and December 15 each year, as from June 15, 2018.
These bonds include a covenant restricting the additional indebtedness if the EBITDA after certain adjustments is lower than twice the gross interest costs, and restrictions on the debt similar to those of the syndicated credit loan.
The proceeds of these bonds have been used to redeem the €700 million bonds due June 15, 2022, carrying annual interest of 3.125%, issued in March and April 2015.
The bonds are listed on the Global Exchange Market of Euronext Dublin (previously Irish Stock Exchange).
An additional issue for €300 million of these 2025 bonds has been done on July 31, 2020. These additional bonds have been issued at 97.50% of the par, which corresponds to a yield to maturity of 3.18%.
SLB 7.25% 2026 bonds
On November 15, 2022, Faurecia issued bonds for an amount of €700 million due June 15, 2026, carrying annual interest of 7.25%, payable on June 15 and December 15 each year, as from June 15, 2023.
These bonds are subject to the same restrictions than the 2029 bonds and base the 2025 objectives of CO2 emission reduction on scope 1 & 2. On the “Sustainable Linked Financing Framework” published in October 2021 and approved by the ISS ESG. The non compliance to these objectives involves a step up of the bonds interest in 2026.
2026 bonds
On March 27, 2019, Faurecia issued bonds for an amount of €500 million due June 15, 2026, carrying annual interest of 3.125%, payable on June 15 and December 15 each year, as from June 15, 2019.
In order to prefinance the acquisition of 50% of SAS shares, an additional issue for €250 million of these 2026 bonds has been performed on October 31, 2019. These additional bonds have been issued at 104.50% of the par, which corresponds to a return at issuance of 2.40%.
2027 2.375% bonds
On November 27, 2019, Faurecia issued bonds for an amount of €700 million due June 15, 2027, carrying annual interest of 2.375%, payable on June 15 and December 15 each year, as from June 15, 2020.
The proceeds of these bonds have been used to refinance the €700 million bonds due June 15, 2023 carrying annual interest of 3.625%, issued on April 1, 2016.
This refinancing has been done through a tender offer through which 2023 bond holders could exchange their bonds against new 2027 bonds. The rate of exchange has reached 76%. The bonds that were not tendered in this offer have been redeemed in accordance with the offering memorandum. The settlement of these two operations has taken place respectively on November 25 and November 28, 2019.
The bond premium for bonds tendered in the offer is amortized over the duration of the new 2027 bonds; the bond premium for bonds redeemed by anticipation has been expensed in the year 2019.
On February 3, 2021, an additional issue for €190 million of these 2027 bonds has been performed via a private placement. These bonds have been issued at 100.75% of the par, which corresponds to a return at issuance of 2.26%.
2027 SLB 2.75% bonds
On November 10, 2021, Faurecia issued bonds for an amount of €1,200 million due February 15, 2027, carrying annual interest of 2.75%, payable on June 15 and December 15 each year, as from June 15, 2022.
These bonds are subject to the same restrictions than the 2029 bonds and base the 2025 objectives of CO2 emission reduction on scope 1 & 2. On the “Sustainable Linked Financing Framework” published in October 2021 and approved by the ISS ESG. The non compliance to these objectives involves a step up of the bonds interest in 2026.
2028 bonds
On July 31, 2020, Faurecia issued bonds for an amount of €700 million due June 15, 2028, carrying annual interest of 3.75%, payable on June 15 and December 15 each year, as from December 15, 2020.
These bonds are subject to the same restrictions than the 2027 bonds. The bonds are listed on the Global Exchange Market of Euronext Dublin.
Green bonds 2029
Faurecia issued on March 22, 2021 green bonds for an amount of €400 million due June 15, 2029, carrying annual interest of 2.375%. The proceeds will be used to finance or refinance the Group’s investments in the hydrogen mobility, for both hydrogen storage and distribution systems and in fuel cell stacks and systems through Symbio, its joint venture with Michelin. The Green Bond Framework has been reviewed by ISS ESG, environmental rating agency.
These bonds are subject to the same restrictions than the 2028 bonds. The bonds are listed on the Global Exchange Market of Euronext Dublin.
Finally, during the year 2022, Faurecia regularly issued commercial papers with a maturity up to one year for investors located mainly in France. As of December 31, 2022, the outstanding amount was €694.4 million.
During the year 2022, Standard & Poor’s has downgraded its outlook from stable to negative to Faurecia on May 24, 2022 to its BB grading. Fitch has downgraded its outlook from stable to negative to Faurecia July 29, 2022 to its BB+ grading.
Note 18Operating payables and other liabilities
(in € thousands) |
31/12/2022 |
31/12/2021 |
---|---|---|
Trade payables |
25,565 |
39,485 |
Other operating payables |
28,537 |
14,244 |
Subtotal operating payables |
54,102 |
53,729 |
Cash advances from subsidiaries |
2,066,045 |
1,846,770 |
Other liabilities |
3,127 |
4,117 |
Subtotal other payables |
2,069,172 |
1,850,887 |
Total |
2,123,274 |
1,904,616 |
Note 19Deferred taxes
- ■temporary differences between the recognition of income and tax purposes;
- ■tax loss carry forwards of the tax group;
- ■tax savings arising from the use of tax losses of subsidiaries in the tax group which will have to be restored to them if and when they return to profit.
Deferred taxes are computed based on the tax rate for the year in which they are expected to reverse.
(in € thousands) |
31/12/2022 |
31/12/2021 |
---|---|---|
Deferred taxes relating to the tax savings |
|
|
arising from using losses in tax-group subsidiaries |
(550,491) |
(515,854) |
Subtotal, deferred tax liabilities |
(550,491) |
(515,854) |
Tax paid on taxable income that is not yet recognized |
(1,810) |
(1,893) |
Charges recognized that are deductible for tax purposes in future years |
5,421 |
5,146 |
Future tax savings on tax loss carry forwards of the tax group |
332,652 |
329,966 |
Subtotal, deferred tax assets |
336,263 |
333,219 |
Net deferred tax (liabilities)/assets |
(214,228) |
(182,635) |
Note 20Financial commitments
Endorsements, sureties and guarantees include commitments to subsidiaries and direct and indirect equity investments for an amount of €169.2 million (€169.2 million as of December 31, 2021).
Note 21Financial instruments used to hedge market risks
21.1Interest-rate hedges
The Company manages interest rate hedging centrally. This management is implemented by the Faurecia group’s Finance And Treasury department, under the responsibility of general management. Management decisions are taken within a market risk management committee which meets monthly.
The hedges arranged comprise mainly euro-denominated interest rate swaps, designed to hedge interest payable on variable rate borrowings.
21.2Foreign exchange hedges
The Company centrally covers the foreign exchange risk of its subsidiaries, linked to their commercial operations, by means of forward or optional foreign exchange transactions as well as financing in foreign currencies. This centralized management is implemented by the Faurecia group Finance And Treasury department, under the responsibility of general management. Management decisions are taken within a market risk management committee which meets monthly. Derivatives purchased for subsidiaries are retroceded to the subsidiaries when they are unwound.
- ■Future transactions are hedged on the basis of forecast flows established during the preparation of budgets approved by General Management; these forecasts being updated regularly.
- ■Currency risk on inter-company loans and borrowings to/from subsidiaries outside the eurozone that are denominated in the subsidiaries’ functional currency but referenced in euros is hedged through swaps.
- ■Currency risk on external borrowings is hedged by means of cross currency swap.
At 31/12/2022 (in millions) |
Net position |
Equivalent (in € millions) |
Fair value of derivatives (in € millions) |
|
Buyer |
Seller |
|||
CAD |
0.0 |
5.9 |
4.1 |
0.0 |
DKK |
0.0 |
234.2 |
31.5 |
0.0 |
GBP |
58.9 |
0.0 |
66.4 |
-0.8 |
JPY |
0.0 |
21,646.9 |
153.9 |
1.2 |
USD |
113.5 |
0.0 |
106.4 |
8.1 |
MXN |
2,000.0 |
0.0 |
95.9 |
1.1 |
CNY |
668.7 |
0.0 |
90.9 |
1.0 |
SEK |
0.0 |
33.5 |
3.0 |
0.0 |
CHF |
0.0 |
15.4 |
15.6 |
-0.1 |
ZAR |
0.0 |
360.2 |
19.9 |
-0.5 |
* Note: these are foreign exchange swaps that cover intra-group deposits and loans. |
|
Note 22Average headcounts
Note 23Compensation
In 2022, total attendance fees paid to directors amounted to €885,045 compared with €864,629 in 2021.
1.6.4.Five-year financial summary
(in €) |
2022 |
2021 |
2020 |
2019 |
2018 |
---|---|---|---|---|---|
1 – Capital stock at end of period |
|
|
|
|
|
a) Capital stock |
1,379,625,380 |
966,250,607 |
966,250,607 |
966,250,607 |
966,250,607 |
b) Number of ordinary shares outstanding |
197,089,340 |
138,035,801 |
138,035,801 |
138,035,801 |
138,035,801 |
c) Maximum number of future shares to be created: by exercising stock options |
0 |
0 |
0 |
0 |
0 |
2 – Operations and results for the fiscal year |
|
|
|
|
|
a) Sales excluding tax |
96,589,000 |
42,481,000 |
34,843,000 |
30,146,000 |
33,439,165 |
b) Income before tax, employee profit-sharing, depreciation, amortization and provisions |
300,815,183 |
196,816,636 |
(330,269,884) |
462,414,608 |
440,662,106 |
c) Corporate income tax (1) |
(14,290,638) |
(21,414,822) |
(9,303,708) |
(31,436,160) |
(31,692,192) |
d) Employee profit-sharing |
0 |
0 |
0 |
0 |
(0) |
e) Income after tax, employee profit-sharing depreciation, amortization and provisions |
344,325,258 |
212,551,344 |
(122,782,135) |
477,124,055 |
415,679,804 |
f) Total dividend (2) (3) |
0 |
0 |
138,035,801 |
0 |
172,544,751 |
3 – Earnings per share |
|
|
|
|
|
a) Income after tax and employee profit-sharing, but before depreciation, amortization and provisions |
1.49 |
1.29 |
(2.45) |
3.15 |
3.40 |
b) Income after tax, employee profit-sharing, depreciation, amortization and provisions |
1.75 |
1.54 |
(0.89) |
3.46 |
3.01 |
c) Net dividend per share |
0.00 |
0.00 |
1.00 |
0.00 |
1.25 |
4 – Personnel |
|
|
|
|
|
a) Average number of employees during the fiscal year |
9 |
8 |
8 |
9 |
8 |
b) Total payroll for the fiscal year |
15,523,622 |
4,884,197 |
12,332,626 |
16,239,993 |
19,920,220 |
c) Total employee benefits paid for the fiscal year (social security, other social benefits, etc.) |
7,937,716 |
2,434,566 |
1,890,759 |
4,187,781 |
5,109,349 |
(1) Amounts in parentheses represent tax savings recognized under the tax consolidation agreement. (2) The 2022 dividend is pending approval by the Ordinary General Meeting of the proposed appropriation of 2022 net income. (3) The part of the 2022 dividend corresponding to shares that the Company holds on its own behalf at the payment date will be allocated to “Retained earnings”. |
1.6.5Subsidiaries and affiliates
(in € thousands) |
Capital |
Reserves and retained earnings before appropriation of net income |
Share of capital stock owned as a% |
Gross carrying amount of investment |
Net carrying amount of investment |
Outstanding loans and advances granted by the Company and not yet paid |
Amounts of guarantees and securities given by the Company |
Sales excluding sales tax from the last fiscal year |
Profit or loss (-) from the previous year-end |
Dividends received by the Company during fiscal year or to be received |
Exchange rates used for non- French subsidiaries and affiliates |
---|---|---|---|---|---|---|---|---|---|---|---|
I. Detailed information |
|||||||||||
A. Subsidiaries (at least 50% of capital stock owned by the Company) |
|||||||||||
Faurecia investments |
238,702 |
1,312,931 |
100.00 |
1,480,395 |
1,480,385 |
161,316 |
0 |
0 |
(525,514 |
198,919 |
|
Faurecia Automotive Belgium |
10,000 |
8,207 |
100.00 |
60,196 |
41,463 |
5,493 |
0 |
0 |
6,722 |
0 |
|
Faurecia USA Holdings Inc. |
15 |
366,927 |
85.03 |
600,699 |
600,699 |
280,931 |
0 |
49,698 |
(59,910) |
0 |
|
ET Dutch Holdings B.V. |
18 |
263,187 |
100.00 |
610,550 |
610,550 |
96,553 |
0 |
698 |
102,469 |
0 |
|
Faurecia Automotive Holdings |
62,311 |
900,878 |
100.00 |
1,618,260 |
1,618,260 |
231,966 |
0 |
206,288 |
49,884 |
62,311 |
|
Faurecia Exhaust International |
7,301 |
18,270 |
100.00 |
82,301 |
82,301 |
339,384 |
0 |
0 |
(76,334) |
0 |
|
Faurecia Services Groupe |
40 |
11 |
100.00 |
46 |
0 |
1 |
0 |
394,677 |
(1,254) |
2,000 |
|
Faurecia Honghu Exhaust Systems Shanghai |
6,023 |
86,871 |
59.97 |
1,212 |
1,212 |
0 |
0 |
30,433 |
22,001 |
8,056 |
EUR 1 = 7,3282 CNY BS / 7,4663 CNY PL (*) |
Faurecia Holdings Espana |
3,010 |
340,594 |
60.59 |
514,183 |
497,483 |
109,934 |
0 |
0 |
3,667 |
0 |
|
Hennape six |
1,100,010 |
(110,247) |
100.00 |
1,100,010 |
922,000 |
324,561 |
0 |
0 |
(869,313) |
0 |
|
Faurecia participation GmbH |
2,053,461 |
561,244 |
100.00 |
2,614,770 |
2,614,770 |
2,911,029 |
0 |
189 |
(65,952) |
0 |
|
B. Affiliates (10%-50% of capital stock owned by the Company) |
|||||||||||
Faurecia Automotive Espana S.L. |
7,138 |
741,180 |
10.66 |
76,449 |
76,449 |
0 |
0 |
41,246 |
36,372 |
933 |
|
Faurecia Automotive GmbH |
146,420 |
122,748 |
25.81 |
225,184 |
225,184 |
128,373 |
0 |
7,705 |
(12,980) |
0 |
|
Faurecia Tongda Exhaust System (Wuhan) Co, Ltd |
4,791 |
11,823 |
50.00 |
2,217 |
2,217 |
0 |
0 |
30,229 |
3,871 |
5,766 |
EUR 1 = 7,7367 CNY BS / 7,73673 CNY PL |
II. Summarized information |
|||||||||||
Subsidiaries and affiliates not included in Section A |
|
|
|
30 |
30 |
0 |
|
|
|
0 |
|
Subsidiaries and affiliates not included in Section B |
|
|
|
|
|
|
|
|
|
|
|
TOTAL |
|
|
|
8,986,502 |
8,773,003 |
4,589,540 |
|
|
|
277,985 |
|
* Note: BS (Balance Sheet); PL (Profit & Loose). |
1.7.Statutory Auditors’ report on the financial statements for the year ended December 31, 2022
This is a translation into English of the statutory auditors’ report on the financial statements of the Company issued in French and it is provided solely for the convenience of Englishspeaking users.
This statutory auditors’ report includes information required by European regulations and French law, such as information about the appointment of the statutory auditors or verification of the management report and other documents provided to the shareholders.
This report should be read in conjunction with, and construed in accordance with, French law and professional auditing standards applicable in France.
Opinion
In compliance with the engagement entrusted to us by your annual general meeting, we have audited the accompanying financial statements of Faurecia SE for the year ended December 31st, 2022.
In our opinion, the financial statements give a true and fair view of the assets and liabilities and of the financial position of the Company as at December 31st, 2022 and of the results of its operations for the year then ended in accordance with French accounting principles.
Basis for Opinion
Audit Framework
We conducted our audit in accordance with professional standards applicable in France. We believe that the audit evidence we have obtained is sufficient and appropriate to provide a basis for our opinion.
Our responsibilities under those standards are further described in the Statutory Auditors’ Responsibilities for the Audit of the Financial Statements section of our report.
Independence
We conducted our audit engagement in compliance with the independence requirements of the French Commercial Code (Code de commerce) and the French Code of Ethics for Statutory Auditors (Code de déontologie de la profession de commissaire aux comptes) for the period from January 1st, 2022 to the date of our report, and specifically we did not provide any prohibited non audit services referred to in Article 5(1) of Regulation (EU) No. 537/2014.
Justification of Assessments Key Audit Matters
In accordance with the requirements of Articles L. 823-9 and R. 823-7 of the French Commercial Code (Code de commerce) relating to the justification of our assessments, we inform you of the key audit matters relating to risks of material misstatement that, in our professional judgment, were of most significance in our audit of the financial statements of the current period, as well as how we addressed those risks.
These matters were addressed in the context of our audit of the financial statements as a whole and in forming our opinion thereon, and we do not provide a separate opinion on specific items of the financial statements.
Assessment of the value in use of equity interests
Risk identified |
|
Our response |
The balance of equity interests as at December 31, 2022 amounted to 8 773 m€, representing 53% of the assets on the balance sheet.
As stated in Note 1.2 to the financial statements, the gross value of these investments is equal to contribution value or cost. An impairment loss is recorded if the value in use of these interests falls below their entry value.
Value in use is based on the revalued net assets, profitability and the future outlook of the interest. Where appropriate, when the future sale of certain investments is being planned or considered, data from previous transactions are taken into account along with other evaluation criteria.
We deemed the assessment of the value in use of equity interests to be a key audit matter due to the materiality of these assets to the balance sheet and the inherent uncertainty of specific inputs applicable to the assessment of their value in use, in particular the likelihood of achieving the discounted cash flows forecast by management in its forecasts, especially in the crisis evolutive context related to COVID-19, the shortage of electronics components and the military conflict in Ukraine. |
|
We assessed the methods used by management to determine the value in use of each of these equity interests.
We obtained management’s most recent forecasts and the impairment tests for each of the significant equity interests in order to assess the valuations based on forecasts.
With asset valuation experts part of the audit team, we assessed the key assumptions considered in the crisis evolutive context related to COVID-19, the shortage of electronics components crisis and the military conflict in Ukraine context and used to determine expected future cash flows and in particular:
For the valuations based on historical data, we examined the consistency of the equity values used with the financial statements of the entities concerned and considered whether any adjustments to equity were based on documentary evidence. |
Specific Verifications
We have also performed, in accordance with professional standards applicable in France, the specific verifications required by laws and regulations.
Information given in the management report and in the other documents with respect to the financial position and the financial statements provided to the shareholders
We have no matters to report as to the fair presentation and the consistency with the financial statements of the information given in the management report of the board of Directors’ and the other documents with respect to the financial position and the financial statements provided to the shareholders.
We attest the fair presentation and the consistency with the financial statements of the information relating to payment deadlines mentioned in Article D. 441-6 of the French Commercial Code (Code de commerce).
Report on Corporate Governance
We attest that the Board of Directors’ Report on Corporate Governance sets out the information required by Articles L. 225-37-4, L. 22-10-10 and L. 22-10-9 of the French Commercial Code (Code de commerce).
Concerning the information given in accordance with the requirements of Article L. 22-10-9 of the French Commercial Code (Code de commerce) relating to the remuneration and benefits received by, or allocated to the directors and any other commitments made in their favor, we have verified its consistency with the financial statements, or with the underlying information used to prepare these financial statements and, where applicable, with the information obtained by your Company from companies controlled thereby, included in the consolidation scope. Based on these procedures, we attest the accuracy and fair presentation of this information.
With respect to the information relating to items that your Company considered likely to have an impact in the event of a takeover bid or exchange offer, provided pursuant to Article L. 22-10-11 of the French Commercial Code (Code de commerce), we have agreed this information to the source documents communicated to us. Based on these procedures, we have no observations to make on this information.
Other information
In accordance with French law, we have verified that the required information concerning the purchase of investments and controlling interests and the identity of the shareholders and holders of voting rights has been properly disclosed in the management report.
Report on Other Legal and Regulatory Requirements
Format of preparation of the financial statements intended to be included in the annual financial report
We have also verified, in accordance with the professional standard applicable in France relating to the procedures performed by statutory auditors regarding the annual and consolidated financial statements prepared in the European single electronic format, that the preparation of the financial statements intended to be included in the annual financial report mentioned in Article L. 451-1-2, I of the French Monetary and Financial Code (Code monétaire et financier), prepared under the Chief Executive Officer’s responsibility, complies with the single electronic format defined in Commission Delegated Regulation (EU) No. 2019/815 of 17 December 2018.
On the basis of our work, we conclude that the preparation of the financial statements intended to be included in the annual financial report complies, in all material respects, with the European single electronic format.
Due to the technical limitations inherent in the macro-tagging of consolidated accounts according to the single European electronic information format, the content of certain tags in the notes may not be returned in the same way as the consolidated accounts attached to this report.
We have no responsibility to verify that the financial statements that will ultimately be included by your Company in the annual financial report filed with the AMF (Autorité des marchés financiers) agree with those on which we have performed our work.
Appointment of the Statutory Auditors
We were appointed Statutory Auditors of Faurecia by the Annual General Meetings held on May 28, 2019 for MAZARS and on June 17, 1983 for ERNST & YOUNG Audit.
As at December 31, 2022, MAZARS and ERNST & YOUNG and Young were fourth year and the fourty year of total uninterrupted engagement (which is the twenty-four year since securities of the Company were admitted to trading on a regulated market).
Responsibilities of Management and Those Charged with Governance for the Financial Statements
Management is responsible for the preparation and fair presentation of the financial statements in accordance with French accounting principles and for such internal control as Management determines is necessary to enable the preparation of financial statements that are free from material misstatement, whether due to fraud or error.
In preparing the financial statements, Management is responsible for assessing the Company’s ability to continue as a going concern, disclosing, as applicable, matters related to going concern and using the going concern basis of accounting unless it is expected to liquidate the Company or to cease operations.
The Audit Committee is responsible for monitoring the financial reporting process and the effectiveness of internal control and risk management systems and where applicable, its internal audit, regarding the accounting and financial reporting procedures.
Statutory Auditors’ Responsibilities for the Audit of the Financial Statements
Objectives and audit approach
Our role is to issue a report on the financial statements. Our objective is to obtain reasonable assurance about whether the financial statements as a whole are free from material misstatement. Reasonable assurance is a high level of assurance, but is not a guarantee that an audit conducted in accordance with professional standards will always detect a material misstatement when it exists. Misstatements can arise from fraud or error and are considered material if, individually or in the aggregate, they could reasonably be expected to influence the economic decisions of users made on the basis of these financial statements.
As specified in Article L. 823-10-1 of the French Commercial Code (Code de commerce), our statutory audit does not include assurance on the viability of the Company or the quality of management of the affairs of the Company.
As part of an audit conducted in accordance with professional standards applicable in France, the statutory auditor exercises professional judgment throughout the audit and furthermore:
- ■Identifies and assesses the risks of material misstatement of the financial statements, whether due to fraud or error, designs and performs audit procedures responsive to those risks, and obtains audit evidence considered to be sufficient and appropriate to provide a basis for his opinion. The risk of not detecting a material misstatement resulting from fraud is higher than for one resulting from error, as fraud may involve collusion, forgery, intentional omissions, misrepresentations, or the override of internal control.
- ■Obtains an understanding of internal control relevant to the audit in order to design audit procedures that are appropriate in the circumstances, but not for the purpose of expressing an opinion on the effectiveness of the internal control.
- ■Evaluates the appropriateness of accounting policies used and the reasonableness of accounting estimates and related disclosures made by Management in the financial statements.
- ■Assesses the appropriateness of Management’s use of the going concern basis of accounting and, based on the audit evidence obtained, whether a material uncertainty exists related to events or conditions that may cast significant doubt on the Company’s ability to continue as a going concern. This assessment is based on the audit evidence obtained up to the date of his audit report. However, future events or conditions may cause the Company to cease to continue as a going concern. If the statutory auditor concludes that a material uncertainty exists, there is a requirement to draw attention in the audit report to the related disclosures in the financial statements or, if such disclosures are not provided or inadequate, to modify the opinion expressed therein.
- ■Evaluates the overall presentation of the financial statements and assesses whether these statements represent the underlying transactions and events in a manner that achieves fair presentation.
Report to the Audit Committee
We submit to the Audit Committee a report which includes in particular a description of the scope of the audit and the audit program implemented, as well as the results of our audit. We also report significant deficiencies, if any, in internal control regarding the accounting and financial reporting procedures that we have identified.
Our report to the Audit Committee includes the risks of material misstatement that, in our professional judgment, were of most significance in the audit of the financial statements of the current period and which are therefore the key audit matters that we are required to describe in this report.
We also provide the Audit Committee with the declaration provided for in Article 6 of Regulation (EU) No. 537/2014, confirming our independence within the meaning of the rules applicable in France as set out in particular in Articles L. 822-10 to L. 822-14 of the French Commercial Code (Code de commerce) and in the French Code of Ethics for Statutory Auditors (Code de déontologie de la profession de commissaire aux comptes). Where appropriate, we discuss with the Audit Committee the risks that may reasonably be thought to bear on our independence, and the related safeguards.
2Risk factors & Risk management
This section describes the parties involved in FORVIA Group's Enterprise Risk Management program (ERM) and the main risk factors to which the Group believes it is exposed as of the date of this Universal Registration Document. However, other risks that the Group is not aware of at the date of this Universal Registration Document, or which are not considered to date as likely to have a significant unfavorable impact for the Group, its Business Groups, its financial position, its results or its outlook, may exist or occur. It is one vision of Faurecia and HELLA Global Risk Leadership team.
2.1.Methodology and description of the main risk factors and their management
The Group operates its activities in an environment that is constantly changing. It is therefore exposed to risk factors that could result in events whose probability of occurrence and/or severity could adversely affect the achievement of its objectives in the short, medium or long term.
Methodology
The Group works every year on a risk tolerance mapping through a global approach that is broken down into several stages:
- the definition of the Group’s context and associated objectives; this forward-looking strategy phase is carried out at the beginning of the year as part of the strategic plan. Thanks to a bottom-up approach, for each product line, the deliverable is formalized with a SWOT analysis and a risk tolerance mapping. This includes three key elements:
- ■the uncertainties related to the global environment and the automotive sector,
- ■the threats, known or unknown, that could affect the Group’s objectives,
- ■the opportunities associated with the threats identified in order to achieve the Group’s objectives,
- A version is then consolidated by business groups with the entries of its product lines to form a Strategic risk mapping that represents the net impact in function of the time horizon; a final version is then consolidated for the Group;
- the risk assessment of which the Group is aware, with three phases:
- ■risk identification which is approached via various methods, including surveys and interviews with the main stakeholders at Group and business level,
- ■risk analysis by the causes and consequences to better qualify the risk parameters using a qualitative method,
- ■risk assessment using the prioritization method described below,
- the risk processing is done using 4 different levers so called 4T (terminate or avoid, treat or reduce, transfer or share or/and then tolerance the residual risk) and this thanks to risk control tools that apply for:
- ■the probability of occurrence with control measures, to anticipate the occurrence of any known and possible event,
- ■the impact (or severity) with appropriate mitigation plans, to limit the effects of any adverse event as far as possible.
The Group’s risk mapping changes each year according to the external and internal context. It is submitted to the Risk Committee for approval.
- ■the corruption risk mapping in application of the provisions of the Sapin II law;
- ■the extra-financial performance risk mapping in the context of the Non-Financial Performance Declaration.
Since 2022, more granular risk analyzes have been carried out at the level of functions, Business Groups or regions, and these feed into the Group’s vision. They also give more autonomy to the operational teams thanks to the deployment of tools and help to raise their awareness of risk management and culture. The result is formalized in the form of risk tolerance maps. They are specific to the scope in question and are accompanied by risk mitigation measures and plans.
The link between risk management and internal control is described in Section 2.2.2.2. “Internal control” in this section.
The assessment of the main risks takes into account the control measures implemented to reduce the risk (the risk is net or residual) and is based on a simplified risk tolerance mapping with a three-level scale:
- ■impact or severity (low/medium/high) which is characterized by financial, operational, reputational, human and/or legal criteria;
- ■the probability of occurrence (low/medium/high) which is characterized by a frequency.
In 2022, the Group created the ABC Risk class method to better control risk (see paragraph 2.2.4 RISK department).
The simplified mapping of the main risk factors is shown below. The different risk factors included in this matrix are detailed in this section. The risk mapping is an internal tool to manage these risk factors. It is validated by the Audit Committee and by the Board of Directors.
In addition to the simplified mapping of the main risks above, the following table provides a summary of the risk factors and the associated measures of control. The categories below are not set out in order of importance. However, within each category, the risk factors are set out in decreasing order of importance as determined by the Group at the date of this Universal Registration Document on the basis of an assessment of their probability and potential impact, taking into account mitigating measures (net risk). The assessment made by the Group of this ranking in terms of importance may however be modified at any time, in particular, in response to new events outside or within the Group. Moreover, even a risk that is currently considered to be of lesser importance could have a significant impact on the Group should it occur at a future date.
Other risks of which the Group is currently unaware, or which it does not consider significant at the date of this Universal Registration Document, could also affect its business.
Risk factors |
Main risk control measures |
Probability |
Impact |
Related Section |
|
---|---|---|---|---|---|
Operational & industrial risks |
|
|
2.1.1 |
||
|
Supply-chain disruptions & supplier failure |
|
●●● |
●●○ |
2.1.1.9. |
|
Risk associated with the automotive supplier business |
|
●●● |
●●○ |
2.1.1.3. |
|
New product launches & program management |
|
●●○ |
●●● |
2.1.1.5. |
NFPD |
Talent acquisition & retention |
|
●●○ |
●●○ |
2.1.1.12. |
NFPD |
Climate Transition & its impact on the economy |
|
●●○ |
●●○ |
2.1.1.2. |
|
Loss of a site due to industrial or natural events |
|
●●○ |
●●○ |
2.1.1.8. |
|
External growth & integration of HELLA |
|
●○○ |
●●● |
2.1.1.4. |
|
Pandemic |
|
●○○ |
●●● |
2.1.1.7. |
NFPD |
Site environmental impact |
|
●●○ |
●○○ |
2.1.1.11. |
NFPD |
Product Quality & Safety |
|
●○○ |
●●○ |
2.1.1.6. |
|
Security and reliability of information systems, data & embedded software |
|
●○○ |
●●○ |
2.1.1.1. |
NFPD |
Safety at work |
|
●○○ |
●●○ |
2.1.1.10. |
Financial & market risks |
|
|
|
2.1.2. |
|
|
Risk related to raw material & inflation of costs |
|
●●○ |
●●● |
2.1.2.4. |
|
Liquidity risk |
|
●●○ |
●●○ |
2.1.2.1. |
|
Customer credit risk |
|
●●○ |
●●○ |
2.1.2.5. |
|
Interest rate risk |
|
●●○ |
●○○ |
2.1.2.2. |
|
Currency risk |
|
●●○ |
●○○ |
2.1.2.3. |
Legal, regulatory & reputational risks |
|
|
2.1.3. |
||
|
Regulatory developments & geopolitical tensions |
|
●●● |
●●○ |
2.1.3.1. |
NFPD |
Business ethic |
|
●●○ |
●●● |
2.1.3.5. |
|
Intellectual property |
|
●●● |
●○○ |
2.1.3.4. |
NFPD |
Sustainable supply-chain |
|
●●● |
●○○ |
2.1.3.3. |
|
Significant litigation |
|
●●○ |
●●○ |
2.1.3.2. |
Note: The abbreviation NFPD indicates that this risk presents non-financial challenges, which are described in detail in Chapter 4 “Non-Financial Performance.” Identification of the primary CSR risks & opportunities is based on CSR risk mapping produced by the Group to supplement Group risk mapping. A risk universe (and the associated descriptions) was thus defined during a process that included consultations with internal and external stakeholders. Identified risks were rated by stakeholders. The risks selected are those with high criticality during this rating phase and have been approved by the Group’s Risk Committee. |
2.1.1.Operational & industrial risks
2.1.1.1.Security and reliability of information systems, data & embedded software
|
|
Probability ●○○ |
Impact ●●○ |
---|---|---|---|
IDENTIFICATION AND DESCRIPTION OF RISK |
|
POTENTIAL IMPACT ON THE GROUP |
|
Given that the Group (and, more generally, the industry as a whole) has been implementing its digital transformation for several years now, information systems are incredibly important for day-to-day operations. The Group relies upon the capacity, reliability and security of its IT, data protection and security infrastructure, as well as its ability to expand and update it in response to the changing needs of its business. The Group’s information systems can be vulnerable to damage from computer viruses, natural disasters, unauthorized access, cyberattacks and other similar disruptions. In particular, the Group is facing the risks relating to (i) failures of computer equipment used in plant production, (ii) breaches of confidentiality of know-how and personal data, and in general (iii) the integrity and availability of information systems, particularly those contributing to business processes related to ordering, supply and invoicing or to digital products and services marketed by the Group. In addition, certain of the Group’s products or components such as infotainment, Advanced Driver Assistance Systems (ADAS), Android system embedded applications, cloud computing applications or wireless chargers that also connect with smartphones, contain complex information technology systems, software and/or data connectivity features and may be vulnerable to unauthorized access aimed at gaining control of, changing the functionality of or gaining access to data stored in or generated by these products. Finally, this remote access control can lead to significant handling of the vehicle, which could endanger the safety of passengers. |
|
Any system failure, accident, security breach or delivery of a flawed digital product or service could result in disruptions to the Group’s operations. There could be multiple potential impacts on the Group depending on the type of incident that occurs, including:
Despite the numerous investments made in this field in both human and financial resources, any major interruption or loss of sensitive data could impact the Group’s business and have a material adverse effect on its operations, financial condition and reputation. For example, to the extent that any disruption or security breach results in inappropriate or unlawful disclosure of confidential, proprietary, customer or supplier information, it could cause significant damage to the Group’s reputation, affect the Group’s relationships with its customers and suppliers or lead to claims or fines against the Group, including within the framework of the General Data Protection Regulation (GDPR) to which it is subject. In addition, the Group may be required to incur significant costs to remedy damage caused by these disruptions or protect against security breaches in the future. |
|
|
|
|
|
RISK MANAGEMENT |
|
|
|
Particular attention has been paid to the protection of data and IT systems for the past several years. The strategic plan to prevent, detect and control Information Systems security risks continued throughout 2022 and primarily covered the following aspects:
Centralized management systems, such as SAP and Oracle Hyperion Financial Management (HFM), provide means to check the integrity and traceability of data as well as the separation of tasks for all entities and domains. They are subject to regular audits. Finally, since 2020, new sites were evaluated according to the TISAX standard in force in the automotive industry to certify the security of the Group’s Information Systems.
In 2022, the Group created a transversal organization with Faurecia and HELLA competences, based on the three lines of defense to protect systems in terms of cybersecurity. With regard to embedded products, the Group has implemented standards as of the design stage in order to secure them:
|
2.1.1.2.NFPD Climate transition & its impact on the economic system
|
|
Probability ●●○ |
Impact ●●○ |
---|---|---|---|
Identification and description of risk |
|
Potential impact on the Group |
|
With transport accounting for approximately one quarter of global CO2 emissions, and passenger vehicles accounting for approximately 10% of global CO2 emissions, the automotive industry has a responsibility to reduce greenhouse gas emissions and its environmental impact. Climate change, and businesses’ responses to these emerging threats, are under increasing scrutiny by governments, regulators and the public alike. The automotive sector is subject to regulatory constraints related to CO2 emissions, including European Regulation 2019/631, which includes an additional obligation to reduce the emissions of new passenger cars by 37.5% between 2021 and 2030. The automotive sector may be strongly impacted in the future by the introduction of stricter regulations on climate issues, particularly in the area of vehicle life cycle analysis. Regulations on the life cycle carbon footprint of vehicles would have a direct impact on the products and solutions that Faurecia provides. The Group’s greenhouse gas footprint comes from its own direct and indirect emissions (scopes 1 & 2), more predominantly from the controlled upstream and downstream value chain (scope 3), and especially from purchasing. To accelerate the climate transition, the public authorities are expected to constrain this total footprint with new taxes and regulations. In addition, more extensive regulations aimed at reducing emissions of NOx in urban areas and CO2 globally could lead to an increase in demand for vehicles that emit less pollution. Consumer behavior may also evolve as a result of greater environmental awareness, encouraging new models of mobility and vehicle ownership as well as the purchase of more eco-friendly vehicles. Finally, extreme weather-related events (such as floods, cyclones and storms) may impact production facilities located near rivers or basins, which could disrupt production and thereby lead to customer delays and, potentially, loss of business. A study on the evolution of climate change and the associated potential physical risks for the Group was carried out in 2022 and an adaptation plan is planned for 2023 on both Faurecia and HELLA industrial sites. |
|
Failure to anticipate, identify and manage risks associated with the climate transition risk could have a significant impact on the Group’s financial condition, business and reputation. Furthermore, the Group’s operations may be interrupted due to the loss, closure or suspension of its production facilities, whether as a result of extreme weather-related events or failure to comply with more stringent regulations. |
|
|
|
|
|
Risk management |
|
|
|
On the basis of the most rigorous and conclusive scientific facts, the Group has established a climate transition roadmap validated in June 2022 by the Science-Based Targets initiative (SBTi) net zero standard for FORVIA, which is compatible with the reduction required to maintain global warming at 1.5°C. FORVIA’s roadmap is in line with the Paris Agreement and the most ambitious of the thresholds proposed by the SBTi. It will be implemented in three stages:
To achieve these objectives, the Group is working with experts and investing in energy efficiency projects at its production plants. The first stage of the program will consist of (i) reducing the energy consumed through the adoption of innovative digital solutions targeting energy efficiency as well as heat recovery and (ii) the purchase or production of renewable energies or low-carbon fuels at all of the Group’s industrial parks around the world. The roadmap is monitored by the Vice President in charge of Climate Strategy and the Sustainable Transformation, who reports to the member of the Executive Committee in charge of strategy. In order to achieve the project’s objectives, the Group has partnered with global specialist groups with expertise in sustainable transformation, including Engie, Schneider Electric, Edp, Green Yellow Accenture, KPMG and Deloitte. These partnerships cover all Faurecia plants worldwide and are extended to HELLA sites. In 2022, the Group:
Additional details relating to this project are available in Chapter 4 “Non-Financial Performance” of this Universal Registration Document. The results of the study on climate change and its impact on the Group will enable the development of an action plan to anticipate the effects on the Group’s industrial footprint for both Faurecia and HELLA industrial sites. |
2.1.1.3.Risk associated with the automotive supplier business
|
|
Probability ●●● |
Impact ●●○ |
---|---|---|---|
Identification and description of risk |
|
Potential impact on the Group |
|
The Group’s business is the manufacture and sale of original automotive equipment and aftermarket automotive components for its automaker customers. The global automotive supply industry is highly competitive and there can be no assurance that the Group’s products will be able to compete successfully with those of its competitors, including new competitors entering the markets served by the Group. The Group's sales are directly related to the level of sales of each of its customers in their respective markets, which depends on many factors, including (i) the overall level of consumption of goods and services in a given market, (ii) confidence levels of the economic actors in each market, (iii) buyers’ access to credit for vehicle purchases and (iv) any existing governmental aid programs, such as programs to support the automotive industry or vehicle purchase incentive programs. The success of the Group's products is also related to the commercial success of the models marketed by its customers for which the Group produces components and modules. Sales of car models with combustion engines in particular may be negatively affected by increased regulation, such as more stringent emissions tests or the exclusions of such vehicles from city centers, or by an acceleration in the adoption of electric vehicles by consumers. In addition, developments in the automotive sector could accelerate the concentration of various manufacturers and lead to the eventual disappearance of certain vehicle brands or models for which the Group produces equipment.
|
|
There is a direct correlation between the Group’s sales and operating income and the performance of the automotive sector in the main regions in which the Group and its customers are present, particularly in Europe (which represented 45% of the Group’s sales in 2022), Asia (27% of the Group’s sales in 2022) and Americas (28% of the Group’s sales in 2022) as well as the commercial success of the models marketed by its customers for which the Group produces components and modules. In addition, the cyclical nature of the automotive industry can have a significant impact on the Group’s sales and results. Furthermore, the orders placed with the Group are binding supply contracts for open orders without any guarantees of minimum volume. The orders are generally based on the life cycle of the particular vehicle model, and there can be no certainty as to how long a given vehicle model will remain in production. At the end of a vehicle’s life cycle, there can be no guarantee that the Group’s products will be utilized for the replacement model. The Group could therefore be required to make certain investments in supply contracts that may not be offset by customer order volumes, thereby generating a significant impact on the Group’s operating income. More generally, a shift in market share away from the vehicles for which the Group produces components and modules (particularly internal combustion engine vehicles) could have a material adverse effect on the Group’s business, financial position and results of operations. In addition, the current shortage of semiconductors has had an adverse impact on vehicle production levels, which in turn has had a direct impact on the Group’s sales (see risk factors 2.1.1.9 “Supply-chain disruptions & supplier failure” and 2.1.2.4 “Risk related to raw materials & inflation of costs”). |
|
Risk management |
|
|
|
Given its market share and diversified international presence, the Group has a natural potential to assess its customer risk. Faurecia and HELLA thus seeks to optimize the quality and diversity of its customer portfolio. In 2022, the Group did business with around 90 customers. In addition to historical Group customers (e.g. Stellantis, Renault-Nissan ‒ Mitsubishi, Volkswagen, FORD, etc.), the Group is now also working with new entrants in the mobility business as well as several local actors, for example in China. The Group is working to reduce its exposure to sales of internal combustion motor vehicles from around 18% in 2022 to about 10% in 2025. The Group also relies on the diversification of its sales by region by vehicle brand and model. In addition, each business monitors the competition on an ongoing basis so that it can respond in the best possible way to calls to tender from automakers and, in particular, to their specific demands for the sale of complex equipment. In this way, Faurecia and HELLA stay competitive through innovation and efficiency in the development of products. As purchases of components and raw materials account for more than 60% of the sales of an automotive supplier, risk factors related to supply-chain failure and raw materials are detailed in Sections 2.1.1.9 “Supply-chain disruptions & supplier failure” and 2.1.1.4 “Risk related to raw materials & inflation of costs”, respectively. |
2.1.1.4.External growth & integration of HELLA
|
|
Probability ●○○ |
Impact ●●● |
---|---|---|---|
Identification and description of risk |
|
Potential impact on the Group |
|
As part of its external growth policy, the Group has made, and may make in the future, acquisitions of varying sizes, some of which have been and may be significant on a Group-wide scale. In August 2021, the Group announced its proposed business combination with HELLA, which develops and manufactures lighting and electronic components and systems for the automotive industry. The transformational HELLA acquisition was completed on January 31, 2022, following the acquisition of 60% of HELLA’s shares from its family shareholders and the voluntary cash tender offer launched by Faurecia on September 27, 2021 at the end of which Faurecia acquired an additional 19.5% of HELLA’s shares. At the date of publication of this document, Faurecia held 81.6% of HELLA’s capital stock. HELLA represented 25.6% of the Business Combination’s consolidated sales for the financial year ended December 31, 2021, and preliminary goodwill associated with the combination is estimated at €3,014 million at December 31, 2022 (for more information on the acquisition, please refer to Chapter 6 “Information about HELLA”, Section 6.1 “Description of the HELLA acquisition” of this Universal Registration Document. There are several risks inherent to acquisitions which could occur, including, in particular:
|
|
The benefits expected from future or completed acquisitions may not be realized within the anticipated time frames and/or at the levels expected and, consequently, may significantly affect the Group’s business, financial position and results of operations. The expected benefits of the HELLA acquisition in particular will depend upon the successful integration of HELLA’s activities into the Group’s. Companies may face significant difficulties when implementing an integration plan. Some of these difficulties may be unforeseeable or outside of the Group’s control or the control of HELLA, notably with respect to differences in norms, controls, procedures and rules, corporate culture, the history of technological investments and the organization of the Group and HELLA, and the need to integrate and harmonize the various operating systems and procedures that are specific to each group, such as financial and accounting systems and other IT systems. The costs the Group incurs in integrating HELLA or trying to realize anticipated synergies may be substantially higher than our current estimates and may outweigh any benefit. Furthermore, if the assumptions and estimates used by the Group to value the acquisition prove to be inaccurate, it could result in an impairment of the goodwill recorded in respect of the transaction.
|
|
Risk management |
|
|
|
The Board of Directors determines the Group’s major priorities and strategies. Executive Management oversees these strategies and allocates the resources necessary to carry them out. The policy of external growth is supported by the team in charge of Business Development, under the responsibility of the Group’s Executive Vice President in charge of strategy. Targets are being identified as part of a selection process led by the Strategy department with the help of external specialized consulting firms. A set of documents comprising analyses of the market, competitors, Business Plans and risks is used as part of the decision-making process. Negotiations and determination of the valuation of the target are carried out by this same department. Major acquisition decisions are made by the Group’s Board of Directors in accordance with the provisions of the Board’s internal rules. The Business Development team is also very closely involved in the life of the entities resulting from external growth transactions (joint ventures, acquisitions) and thus takes part in their decision-making bodies. A post-acquisition integration plan covering all aspects of the relevant entity (human resources, purchasing, sales, R&D, production, etc.) is systematically drawn up and monitored on a regular basis, including at the highest levels of the organization. Following the merger agreement with HELLA, an Integration Committee was created to facilitate and oversee the process of integrating HELLA into the Group. |
2.1.1.5.New product launches & program management
|
|
Probability ●●○ |
Impact ●●● |
---|---|---|---|
Identification and description of risk |
|
Potential impact on the Group |
|
Most of the contracts entered into by Faurecia at December 31, 2022 were awarded after a call for tenders put out by an automaker to supply complex equipment, to which the Group responded in the form of a Request for Quotation. Every contract entered into with a customer constitutes a “program” whose production phase, which follows the development phase, may last up to ten years, although there is no minimum duration for a program. In 2022, the Group managed a portfolio of approximately 1,125 programs for both Faurecia and HELLA. Over the course of its life cycle, a program faces various risks such as a shortage of qualified operators and workers, problems with component availability or quality, problems related to the quality of the assembly or transportation of finished products or difficulties linked to the rate of work imposed by the customer.
|
|
If the Group fails to identify and manage risks in connection with the bidding for and establishment of new programs, or fails to appropriately monitor its operational and financial performance, the Group’s gross margins could be adversely affected, which could have a material adverse effect on its business, financial condition and results of operations. Furthermore, depending on the difficulties encountered over the course of the life cycle of a program, customers’ satisfaction with a program may be negatively impacted, which could have significant consequences on the reputation of the Group as well as its financial results (sales and/or operating margins).
|
|
Risk management |
|
|
|
The Program Management Core System lays out a strict succession of steps for the entire duration of a program, from bid processing to the end of product life. As part of the bid procedure, a risk assessment is completed in order to determine in advance, based on a list of 15 preset criteria, the nature and level of the risks that should be eliminated during the program’s development phase. A specific organization with managers and an action plan is followed for each critical program. Program reviews are carried out monthly within each division and business to define and monitor action plans, including the plans to eliminate the execution risks that are identified during the acquisition phase. Programs deemed “high risk” are also subject to review by the Group’s Executive Management. Each program is subject to a prospective financial analysis and is being monitored through Key Performance Indicators updated monthly. There is a management alert system on top of those indicators which is used to report and corrective any significant deviations as soon as possible. Since 2021, for each program identified as critical, audits have been carried out on the industrial parks affected by these launches before the mass production phase. The purpose of this measure is to better assess the maturity of the launch phase and ensure a good ramp-up for the customer concerned. In 2022, Faurecia deployed its program risk management methodology within HELLA. |
2.1.1.6.NFPD Product quality & safety
|
|
Probability ●○○ |
Impact ●●○ |
---|---|---|---|
Identification and description of risk |
|
Potential impact on the Group |
|
With approximately 1,125 active programs in portfolio in 2022, Faurecia and HELLA supplie a very large number of vehicle components with a potential impact on driver and passenger safety. The products manufactured by the Group could present quality problems in relation to customer expectations as well as compliance with applicable regulations, particularly those relating to safety. In addition, a number of the Group’s products (such as infotainment, Android system embedded applications or wireless chargers that connect with smartphones) include embedded software which is obtained from third-party providers. If the software provided by the Group’s suppliers is defective, the product may not function as intended.
|
|
Faulty products that are delivered or manufactured may adversely affect the production process for customer systems, subject the Group to legal proceedings and commercial or contractual disputes or result in the incurrence of additional costs that have repercussions on the Group’s business, results or financial position. In particular, the Group may be exposed to product liability or warranty claims if its products actually or allegedly fail to perform as expected or the use of its products results, or is alleged to result, in bodily injury and/or property damage. The Group may incur significant costs to defend these claims or experience product liability losses. Large product liability claims, if made, could exceed the Group’s insurance coverage limits, and further insurance may not continue to be available on commercially acceptable terms or at all. Further, any proven or alleged instances of inferior product quality or damage caused by the Group’s products could damage its reputation and brand image, reduce customer satisfaction and/or cause new or existing customers to be less willing to conduct business with the Group. In addition, in the event of the failure or suspected failure of products designed by the Group, the latter may be forced to recall and exchange them. The future cost associated with providing product warranties and/or bearing the cost of repair or replacement of such products could have a material adverse effect on the Group’s business, financial condition and results of operations. |
|
|
|
|
|
Risk management |
|
|
|
The Group manages product quality and safety risks from the new order acquisition phase to manufacturing in the plants. The Quality department oversees this operation at each stage of the process. It is present in all levels of the organization, from the multidisciplinary team developing new programs or production plants up to the Group’s management structure. In 2018, the Group initiated its Total Customer Satisfaction program, which takes into account both Group performance and the perception its customers have of the Group. This program aims to obtain a global picture of customer satisfaction, both in terms of performance and perception, across the entire value chain from order-taking to the start of production. In addition to quality indicators, Group customers’ comments are now collected immediately and transparently via a dedicated digital application. Customer feedback is processed via a Customer Relationship Management (CRM) tool and allows the Group to track the speed and quality of responses made by it. In 2020, it launched a structured approach in order to improve the quality perceptions of its customers. The Faurecia Excellence System is defining how production and operations are being organized. It has been built to improve quality, cost, delivery and safety on a continuous basis. It helps to guarantee the operational performance of the Group’s production plants around the world, thanks to common working methods and a shared language. In 2018, the Group decided to improve this system, and this improved version was implemented throughout 2019 and 2020. In 2021, the Group centralized its FMS (Faurecia Management Systems) teams in order to simplify and harmonize its systems (One System), audits (One Audit) and teams (One Team). As part of this process, the Group recently acquired a database in order to centralize all documents and construct an integrated system of audits. For major problems, a management alert system is used. The Group’s management continuously deploys a structured problem-solving culture (contact within 24 hours, identification of the main causes, etc.). Finally, the Group’s industrial management includes a team of auditors that is independent of the operational organization of the businesses, and which conducts reviews on both production plants and R&D centers. They use a precise and rigorous questionnaire to assess the application and maturity of enforcement of the Faurecia Excellence System. Each site is classified according to four levels: poor, satisfactory, excellent, benchmark. If a site is rated poor, it is required to prepare a corrective action plan which is presented directly to the Group Chief Executive Officer with a view to reaching a satisfactory level within a maximum of three months. Since 2022, Faurecia and HELLA Quality teams are working in close coordination to share their best practices and continue to grow total customer satisfaction. In particular, the role of the HELLA product integrity team shall strengthen the risk management process. |
2.1.1.7.Pandemic
|
|
Probability ●○○ |
Impact ●●● |
---|---|---|---|
Identification and description of risk |
|
Potential impact on the Group |
|
In March 2020, the Coronavirus (Covid-19) pandemic and its global development has generated many significant health threats in the countries where the Group operates and is causing the gradual implementation of public measures restricting the movement of goods and people. The pandemic has disrupted and could continue to disrupt, or even prevent, in the short or long term, the operation of all or some of the Group’s production plants and R&D centers located in impacted areas, including as a result of a decline in demand for the products of the Group’s customers. The pandemic may similarly impact the industrial parks or the points of sale of all or some of the Group’s customers and suppliers located in impacted areas. The Group cannot guarantee that this type of event will not reoccur in the future, whether due to a new wave of Covid-19, a new variant or another virus.
|
|
A pandemic could have multiple significant impacts concerning:
The consequences of these impacts has included, and may continue to include, the partial or total shutdown of production parks, which has led, and may continue to lead, to delays in the execution of contracts, or the postponement of decisions regarding the placing of orders, or even their cancellation. The effects of Covid-19 materially impacted the Group’s sales in the year ended December 31, 2021 and may continue to have a material adverse impact on sales for the coming years. The shortage of semiconductors linked to the Covid-19 pandemic had an impact on the Group’s volumes (see risk factors 2.1.1.9. « Supply-chain disruptions & supplier failure » and 2.1.2.4. « Risk related to raw materials »). The extent of the impact of the Covid-19 pandemic, or any such similar pandemic in the future, on the Group’s business and financial performance, including its ability to execute the Group’s near-term and long-term operational, strategic and capital structure initiatives, will depend on future developments, including the duration and severity of the pandemic, which are uncertain and cannot be predicted. |
|
Risk management |
|
|
|
The management of the Covid-19 crisis has led the Group to adopt various measures:
Both Faurecia and HELLA teams synchronize monthly regarding this risk factor. |
2.1.1.8.Loss of a site due to industrial or natural events
|
|
Probability ●●○ |
Impact ●●○ |
---|---|---|---|
Identification and description of risk |
|
Potential impact on the Group |
|
The Group has approximately 290 industrial parks and 66 R&D centers located in 44 different countries. Some of the Group’s plants are highly specialized in terms of manufacturing, and it would therefore be difficult to set-up alternative solutions within a short period of time in the event of a major incident. In addition, some of Group plants are located in “high-risk” areas in terms of natural disasters (earthquakes, flooding, etc.). The main causes identified that could potentially lead to the loss of a major industrial park are:
|
|
These various risks may result in the Group incurring additional costs, which could have a material adverse effect on its business, financial condition and results of operations. The total or partial loss of a major industrial park could lead to a supply disruptions affecting one or more customers with major consequences for the automotive industry value chain. An event of this kind would also have consequences on the Group’s sales and operating margins. Such loss or damage may not be fully insured or could exceed the Group’s insurance coverage limits, which could have an adverse effect on the Group’s financial position. |
|
Risk management |
|
|
|
The Group has drawn up an industrial risk prevention policy, aimed at limiting potential losses from fire or natural disasters, in partnership with its insurer. The Group’s industrial risk prevention policy is based on the following:
|
2.1.1.9.Supply-chain disruptions & supplier failure
|
|
Probability ●●● |
Impact ●●○ |
---|---|---|---|
Identification and description of risk |
|
Potential impact on the Group |
|
The Group uses a large number of suppliers based in different countries for its raw materials and basic parts supplies. As of December 31, 2022, the Group had made total purchases (direct and indirect, excluding monoliths catalytic converters) of €16.8 billion with more than 25,000 suppliers. Given its business, the Group could be impacted in the event of supply-chain failures, for example, following a major loss at a supplier’s production park, a health crisis, production quality issues, delivery of lower than required quantities or a liquidation or even bankruptcy. Furthermore, the global supply-chain chain has experienced disruptions as the result of a general lack of production capacity for certain raw materials and components, such as the current shortage of semiconductors, which has had an adverse impact on vehicle production levels. These shortages can be exacerbated by external factors, such as the Covid-19 pandemic, climate events, such as winter storms in the southern of the United States, and accidents such as fires at a supplier. But also the global economic recovery which has created and may continue to create pressure on demand for raw materials and components as well as geopolitical tensions (see also the risk factor 2.1.3.1 “Regulatory developments & geopolitical tensions”). As a result, production downstream of the global supply-chain can be disrupted. |
|
If one or more of the Group’s main suppliers were to go bankrupt or experience an unforeseen stock-out, quality problems, social unrest, a strike or any other incident disrupting its supplies for which it were liable, this could cause delays, impact the Group’s production output or image, or lead to additional costs that would affect the Group’s business, results and overall financial position. In addition, should the Group or one of its suppliers or service providers default at any stage of the manufacturing process, the Group could be held liable for failure to fulfill its contractual obligations or for technical problems. If the Group is unable to obtain sufficient or competitively priced raw materials and components to meet customer demand, this could result in potential disruptions in the supply-chain or a reduction in the number of cars produced, which could have a material adverse effect on the Group’s business, results and financial condition. |
|
Risk management |
|
|
|
The Group’s Purchasing department closely monitors the quality and reliability of suppliers’ production operations as well as their credit status and sustainability in order to ensure that the Group’s supply chain is secure through the following measures:
This risk review is carried out as early as the supplier selection process and is subject to regular reassessment. It may lead to a refusal to include the supplier in the Group panel or to an end of the relationship with the supplier in the event of high risk. The Group has a supplier risk analysis tool, which enables it to better anticipate all natural, geopolitical and solvency risks on a single platform used by Faurecia and HELLA teams. Faurecia & HELLA’s purchasing teams organize regular reviews of supplier-related risks at the Group, Business and Division levels. They also work with suppliers to define action plans to reduce the risks identified in each of them. They thus help suppliers to develop and reduce their industrial and financial risks, in particular through operational support to improve their performance in terms of production, quality, logistics and cost control. They also support suppliers in their international expansion. A specific coordination by main commodities has been implemented to strenghten to leverage the supplier panel and actions. The general purchasing conditions per country have been harmonised for the Group and will be implemented in 2023 by Faurecia and HELLA teams. In 2022, a task force was created in the context of the energy crisis in Europe to anticipate any energy shortage in the value chain and thus ensure the continuity of the Group’s operations. Paragraph 4.2.2.1 refers to energy shortage response deployed by FORVIA. |
2.1.1.10. NFPD Safety at work(1)
|
|
Probability ●○○ |
Impact ●●○ |
---|---|---|---|
Identification and description of risk |
|
Potential impact on the Group |
|
As of December 31, 2022, the Group employed around 101,700 operators worldwide, i.e. approximately 65% of its total headcount for both Faurecia and HELLA. As part of the Group’s production activities, personnel are exposed to a variety of risks, including accidents, occupational illnesses or illnesses related to the workplace environment in general that may affect their health or physical safety. |
|
The key potential impacts on the Group concern the harm caused to the individual(s) in question. Insufficient management of workplace conditions could also impact the Group’s reputation as well as its finances in the event of financial penalties associated with this harm. |
|
Risk management |
|||
Safety at work is one of the key elements of the excellence initiative embodied by the Faurecia Excellence System (FES). The Group’s policy on health and safety at work at the day-to-day level centers around two main goals: safeguarding staff health and improving their safety at work. Faurecia has a dedicated organization in charge of this topic at every level of the organization. The change in the frequency rate of work-related accidents is analyzed in order to measure the effectiveness of actions carried out in this area. After each accident, a “Quick Response Continuous Improvement” (QRCI) analysis is performed using a problem-solving method based on best practices in terms of solving quality problems to ensure that the primary causes of the accident are understood, that corrective actions have been effective and that preventative measures are implemented and shared across the various sites. Since 2018, the Group has structured its approach to prevention around Seven Fundamental Safety Principles for all employees, and in particular operators and the employees of external contractors. Most occupational illnesses reported by Group employees involve musculoskeletal disorders. To reduce this, the Group has taken steps for several years to take into consideration the strain caused by workstations and to remedy the situation as far as possible. Ergonomic analysis of workstations is part of the Faurecia Excellence System tools. This subject is systematically included in the design of products and production tools. It is checked during production plant audits. These reviews, the effectiveness of which was significantly improved by the use of digital technology augmented by artificial intelligence, assists the implementation of solutions to improve manufacturing workstations. Since 2022, Faurecia and HELLA HSE teams are working in coordination to deploy the processus of Faurecia and better control safety at work risk together. Since 2022, the Faurecia and HELLA HSE teams are working to converge their processes to better manage workplace at work risk and to deploy the Faurecia Excellence System throughout the Group. |
2.1.1.11. NFPD Site environmental impact
|
|
Probability ●●○ |
Impact ●○○ |
---|---|---|---|
Identification and description of risk |
|
Potential impact on the Group |
|
In light of its industrial activities, as well as the use of a large number of potentially polluting products and materials in the context of the product manufacturing process, the Group may be exposed to environmental risks such as the risk of accidental pollution or any risk related to the tightening of environmental regulations. The Group could also be exposed to operational risks related to poor energy management (generating excessive CO2 emissions) or poor management of raw materials or waste. |
|
Any failure to comply with environmental regulations could cause damage to the Group’s reputation and generate a significant financial impact (including in the form of criminal law sanctions as well as lost of opportunities). Accidental pollution could also require the Group to incur significant costs for the decontamination of the sites impacted. |
|
Risk management |
|||
In 2017, the Group formalized an environmental policy under which it commits to reducing the environmental impact of its facilities. Environmental risk analysis and control are based on ISO 14001. The Environment Committee, which holds monthly meetings and is chaired by the Group Operations department and includes business experts, implements and manages the Group’s environmental policy. Each business has appointed an HSE Officer, who is assisted by (i) a network of HSE managers at the division level (mainly regional) and (ii) HSE coordinators at each Faurecia site. They bring their expertise to plant management. They are also responsible for applying procedures and ensuring compliance with regulations and Faurecia standards. HELLA teams are working in close coordination with Faurecia ones to standardise methods. The amount of investments reported by the sites for environmental protection, reducing damages and the value of the provisions recorded for environmental contingencies is indicated in Chapter 4 “Extra-Financial Performance” of this Universal Registration Document. Moreover, the Group has transferred a portion of the risk to the insurance market in order to hedge against damage that may result from environmental pollution. |
2.1.1.12. NFPD Talent acquisition & retention
|
|
Probability ●●○ |
Impact ●●○ |
---|---|---|---|
Identification and description of risk |
|
Potential impact on the Group |
|
The Group’s strategy focuses on four main mobility priorities which are based on safety, sustainability, advanced technological solutions and personalized experiences. The development of products connected to these four strategic priorities requires the use of previously-unseen technologies in the automotive sector and therefore requires specialized resources with expertise in these new technologies. The Group could experience difficulties in attracting and retaining the necessary talents able to provide the skills required for the development or production of its innovative products or services, particularly if the automotive industry is considered less attractive to younger generations. In addition, the Group must compete with other companies for suitably qualified personnel, including technical and engineering personnel. |
|
If positions remain unfilled for too long, if turnover rates are too high or if diversity is not sufficient, the level of motivation and productivity of the teams, as well as the cost of recruiting, training and integrating new employees, could be impacted. In addition, the loss of the Group’s management team or key individuals (for example, during the integration of an acquisition) could have a negative effect on its operations. Such risks could also slow down the Group’s development and innovation and have a negative impact on its results and reputation. |
|
Risk management |
|||
The Group defines and deploys several policies and actions related to recruitment, development and compensation to ensure it recruits and retains talent. These actions are adapted according to the country of operation. Talent recruitment In 2022, the Group continued to focus on recruiting recent graduates and early-career skilled professionals in order to ensure that the Group recruits and retains the talents of the future. Throughout this process, the Group has established preferential partnerships with more than 100 schools, post-secondary institutions and universities in the many countries where the Group operates. The Group uses the international volunteering in business (IVB) program as a key to achieving its recruitment goals among recent graduates. The number of IVB participants recruited by the Group has been continuously increasing for the past several years. Since 2022, the Group has launched an artificial intelligence solution to facilitate recruitment and has deployed a specific digital app to discover the Group, its values, strategy and organisation and improve integration. All new hires benefit from a personal induction program enabling them to find out more about the Company and its values, strategy and organization. Talent development To prepare the managers of tomorrow, talent identification starts as early as possible in the Group. After a period during which employees successfully demonstrate their talents, the Group offers employees diverse career paths to help them continue to realize their full potential. These paths include cross-functional and cross-divisional mobility, project-based work and short-term assignments. The plan aims to help employees step out of their comfort zone and provide them with general management skills. Experts are also recognized according to a specific process. The Group offers a large catalog of training courses. In 2022, the Faurecia University trained more than 8,300 employees, and its online training (Learning Lab) exceeded its first million hours of delivered training since it was initially set-up in 2016. This offer is available at HELLA since 2022. Recognition The Group’s compensation policy is subject to an annual review by specialized firms in order to ensure competitiveness with the local market. Compensation depends on several elements related not only to individual performance, but also team performance. The variable portion of compensation rises increasingly with the level of responsibility exercised. These various subjects are monitored through dedicated Key Performance Indicators (KPI). In 2022, Faurecia was awarded the Top Employer label (India - Top Employer Institute), the Happy Trainees label (Group - ChooseMyCompany) and the "DRH International" trophy for our innovations in digitalizing on-boarding and introducing artificial intelligence (Award of Human Capital Leaders). Faurecia is ranked as the "most attractive company" by engineering students (France, Universum) and is one of the Top 100 employers for undergraduate students in the UK (RateMyPlacement). For more information on efforts to promote diversity in talent attraction and development, please refer to Section 4.2.6 of Chapter 4 of this Universal Registration Document. |
|||
|
2.1.2.Financial and market risks
2.1.2.1.Liquidity risk
|
|
Probability ●●○ |
Impact ●●○ |
---|---|---|---|
Identification and description of risk |
|
Potential impact on the Group |
|
To finance its investments and other cash requirements, the Group is obliged to access capital sourced from both financial institutions and financial markets.
|
|
A worldwide economic downturn and/or disruptions of the credit markets could reduce the Group’s access to capital or liquidity necessary for its operations and executing its strategic plan. If the Group’s access to these resources were to become constrained significantly, or if costs of capital increased significantly due to lowered credit ratings, prevailing industry conditions, the volatility of the capital markets or other factors, the inability to access such resources could have an adverse impact on the profitability of the Group and on its financial condition, results of operations or cash flows. |
|
Risk management |
|
|
|
The Group’s liquidity is ensured mainly by its bond issues and its syndicated credit facility. Between 2018 and 2022, the Group made several bond issues, for a total amount of €5,640 million, maturing between June 2025 and June 2029. Faurecia also holds a €1.5 billion line of credit with its banks that is scheduled to reach maturity at the end of May 2026. As of December 31, 2022 this credit facility was not drawn. This credit line includes only one covenant, related to consolidated financial ratios: Net debt/EBITDA must be lower than 3.00 with the exception of December 31, 2022 when the ration Net Debt/EBITDA must be lower than 3.75. Compliance with this ratio is a condition affecting the availability of this credit facility. The various components of Faurecia’s long-term debt and the maturities of the Group’s liquidities are described in Notes 26.2 and 26.3 to the consolidated financial statements. As is noted in Note 26.3 to the consolidated financial statements, as of December 31, 2022, Faurecia was compliant with the financial ratio required by the syndicated credit facility. Details of the HELLA integration financing transaction can be found in Chapter 1, Notes 26.3 to the consolidated financial statements. In the context of the HELLA acquisition, Faurecia entered into a €5.5 billion bridge loan in August 2021. This facility was fully refinanced on 2 February 2023 via various capital market transactions in 2021, 2022 and 2023. The various components of Faurecia's long-term debt and the Group's overall liquidity schedule are detailed in Notes 26.2 and 26.3 to the consolidated financial statements. As indicated in Note 26.3 to the consolidated financial statements, as of December 31, 2022, the financial ratio imposed by the syndicated credit facility was met. On February 20, 2023, during the presentation of the 2022 annual results, the Group confirmed its objective of achieving a total of €1 billion in disposals of non-strategic assets by the end of 2023, including the part already carried out in the second half of 2022. This program of disposals of non-strategic assets is part of the Group’s debt reduction plan following the acquisition of the majority interest in HELLA. Recent information on the progress of this program are available Chapter 1 under recent events. |
Ratio |
Limit |
Carrying amount at 31/12/2022 |
---|---|---|
Net debt*/Adjusted EBITDA** |
<3.75*** |
2.6 |
* Consolidated net debt. ** Operating income plus depreciation, amortization and funding of provisions for impairment of property, plant and equipment and intangible assets, corresponding to the past 12 months. *** Ratio exceptionally raised from 3 to 3.75 following negotiations with our banks in April 2022. The constraint decreases to 3 on June 30, 2023. |
2.1.2.2.Interest rate risk
|
|
Probability ●●○ |
Impact ●○○ |
---|---|---|---|
Identification and description of risk |
|
Potential impact on the Group |
|
As a significant portion of the Group’s debt is at variable rates, it is exposed to significant risks related to changes in interest rates. At December 31, 2022, before taking into account the impact of interest rate hedges, this portion represented 29.1%. |
|
Any significant variation in interest rates combined with a poor application of the hedging policy for these rates would lead to an increase in finance costs and could have a noticeable impact on the Group’s financial results. |
|
Risk management |
|
|
|
The Group adopts a centralized approach to managing the hedging of interest rate risk. Such management is implemented through the Group Financing and Treasury department, which reports to the Executive Management. Hedging decisions are made by a Market Risk Management Committee that meets on a monthly basis. As a significant part of the borrowings (syndicated credit facility if drawn down, short- and medium-term financing, commercial paper) are at variable rates, the aim of the Group’s interest rate hedging policy is to reduce the impact on earnings from changes in short-term rates. The Group’s interest rate position based on the nature of the instruments used and the sensitivity of interest expense to short-term rates are disclosed in Note 30 to the consolidated financial statements. Before taking into account the impact of interest rate hedges, 29.4% of the Group’s financial debt was on a variable rate as of the end of December 2022, compared with 24.6% as of year-end 2021. The variable-rate financial debt primarily consists of short-term debt. The main components of long-term fixed rate debt are:
|
2.1.2.3.Currency risk
|
|
Probability ●●○ |
Impact ●○○ |
---|---|---|---|
Identification and description of risk |
|
Potential impact on the Group |
|
Given (i) its international presence in a large number of countries outside of the Euro zone, particularly due to the location of some of its production parks and (ii) the fact that certain subsidiaries purchase raw materials and other supplies or sell their products in a currency other than their functional currency, the Group is faced with the risk of exchange rate fluctuations. This risk arises when Group subsidiaries have sales or costs denominated in a currency other than their functional currency. The Group is also subject to currency risk linked to the contribution of the subsidiaries, whose accounting currency is not the euro, to the consolidated results of the Group. The sales, results and cash flows of these subsidiaries, when converted into euros, are sensitive to fluctuations in their accounting currency against the euro. |
|
Excessive fluctuations in exchange rates could have a negative impact on the Group’s financial results. |
|
Risk management |
|
|
|
Note 30.2 of the notes to the consolidated financial statements gives a detailed description of the underlying foreign exchange positions and the derivatives hedging them. This note also provides a detailed description of the sensitivity of the Group’s earnings and shareholders’ equity to fluctuations in the euro exchange rate of the main currencies to which the Group is exposed. The Group centrally hedges the foreign exchange rate risk of Faurecia and its subsidiaries in relation to their commercial transactions centrally by means of forward or optional foreign exchange transactions and foreign currency financing. This centralized management is implemented by Faurecia’s Finance and Treasury department, under the responsibility of the Executive Management. The management decisions are taken within a Market Risk Management Committee which meets monthly. Future transactions are hedged on the basis of forecast cash flows established during the preparation of budgets validated by Executive Management; these forecasts are regularly updated. Subsidiaries whose functional currency is not the euro are granted intra-group loans in their functional currencies. As these loans are refinanced in euros, and although eliminated on consolidation, they nevertheless contribute to the Group’s exposure to foreign exchange risk. This risk is hedged by means of foreign exchange swaps or financing in the currency in question. |
2.1.2.4.Risk related to raw material & inflation of costs
|
|
Probability ●●○ |
Impact ●●● |
---|---|---|---|
Identification and description of risk |
|
Potential impact on the Group |
|
The Group is exposed to raw material risk directly through its raw materials purchases and indirectly through components purchased from its suppliers. In 2022, direct raw materials purchases (thermoplastic resins, steel, and semi-conductors) and the raw materials share of indirect purchases of parts made of these same raw materials accounted for about 45% of the Group’s total purchases. Their prices are subject to fluctuations, the underlying causes of which are linked to structural supply capacity, demand, international geopolitical relations. In 2022, rising inflation also contributed to the increase in the costs of purchased components in consideration of energy, transport and labor. The energy crisis in Europe as a consequence of the war in Ukraine is an aggravating factor for the cost of energy in this geographical area. To the extent that the Group’s sales contracts with customers do not include systematic price indexation clauses linked to the price of its raw materials, Faurecia is exposed to risks related to unfavorable fluctuations in raw material prices. The Group does not use derivatives to hedge its purchases of raw materials or energy. In addition, the Covid-19 crisis has put pressure on supplies of raw materials with a potential impact on prices, including risks related to shortages of semiconductors (which are present in numerous Group products) that are expected to continue through part or all of 2023 at a minimum. With regard to inflation, sales contracts with customers do not include an indexation clause based on cost parameters. |
|
The Group’s sales, as well as its operating and net income, could be adversely affected if the prices of the raw materials it uses, notably steel and plastics, were to rise steeply. The same is true for the increase in inflation-related costs. The Group may be unable pass on all such price increases to its customers, and the impact could be reflected in the Group’s financial results. If the Group is unable to secure a sufficient quantity of semiconductors or, in Europe sufficient energy supplies for its industrial parks and/or those of its suppliers, it could be exposed to operational losses as well as customer claims seeking indemnification (mass production or launch phase). Bottlenecks in the value chain, which are mainly the result of a general shortage of certain electronic components and have been amplified by external factors over which the Group has limited control, could result in higher costs (transportation, raw materials, energy, workforce, quality assurance and disruptions to the production process) which may affect the Group’s financial results. These risks could also affect customer-supplier relationships. Automakers could require the creation of larger safety stocks, followed by revising existing contractual arrangements. Impacts from such changes to customer-supplier relationships could affect the Group’s financial results. A change of 10% to 20% in the price of raw materials, would have an impact from 50 bps to 100 bps on the Group’s operating income. |
|
Risk management |
|
|
|
Efforts are made to reduce this exposure by continually negotiating conditions with customers and strictly managing inventories. Faurecia does not use derivatives to hedge its purchases of raw materials or energy. The Group’s exposure to this risk remains limited since a large proportion of the raw material price fluctuations are subject to an indexation mechanism or frequent renegotiation with most of its customers on a “pass-through basis.” Group’s remaining exposure is, therefore, around 10% of the total exposure to raw material costs. In the event of significant variations in raw materials prices, specific negotiations going beyond the usual indexation mechanisms are implemented to further reduce exposure to the risk of rising prices. Following the Covid-19 crisis, specific actions were implemented, particularly in terms of diversification of the panel of raw material suppliers but also in terms of the management of safety stocks and monitoring the impacts of cost increases related to inflation and their impact on customers. The Group is actively working to minimize these risks through a proactive approach to supplier risk management. This approach includes (i) a multi-sourcing strategy, to the extent it remains a viable solution in terms of technical and economic feasibility, while using the existing qualified panel, and (ii) some methods deployed on an ongoing basis by the Group to identify alternative products available on the market. |
2.1.2.5.Customer credit risk
|
|
Probability ●●○ |
Impact ●●○ |
---|---|---|---|
Identification and description of risk |
|
Potential impact on the Group |
|
In view of the economic context in the automotive sector (the emergence of new stakeholders, a decrease in volumes, increasingly stringent environmental standards, etc.), the Group cannot rule out the possibility that one or more of its customers may not be able to honor certain agreements or suffer financial difficulties. In 2022, the Group’s five largest customers accounted for 56.7% of sales, as follows: Volkswagen (18.3%), Stellantis (13.4%), Ford (8.7%), Renault-Nissan-Mitsubishi group (7.9%) and Chinese OEMs (8.4%). |
|
The failure to recover a trade receivable in the event of a payment default (for example, resulting from a customer bankruptcy) could have a negative impact on the Group’s financial results. |
|
Risk management |
|
|
|
Trade accounts receivable are monitored on a regular basis by the Group’s Finance department. In late 2019, a range of measures for assessing customer credit risk was put in place, enabling in particular this risk to be assessed whenever a new customer is acquired. As of December 31, 2022, late payments of the Group represented €240 million, or 0.9% of consolidated sales for the fiscal year. Details of trade accounts receivable and other receivables are provided in Note 18 to the consolidated financial statements. |
2.1.3Legal, regulatory & reputational risks
2.1.3.1.Regulatory developments & geopolitical tensions
|
|
Probability ●●● |
Impact ●●○ |
---|---|---|---|
Identification and description of risk |
|
Potential impact on the Group |
|
Due to the international nature of its business activities, the Group is exposed to economic, political, fiscal, legal and other types of risks in the countries in which it operates. These may result in particular from heightened geopolitical tensions (including those between the U.S. and China and between Russia and Ukraine), regional instability or the imposition of trade barriers and protectionist policies in various countries. At December 31, 2022, the Group operated in 44 countries and generated 45% of its sales in Europe, Middle East and Africa, 27% in Asia, and 28% in Americas. The risks to which Faurecia is exposed include:
|
|
Inadequate planning or preparations for regulatory decisions or changes made to legal requirements could have a significant negative impact (particularly regarding finances) on the Group’s business and results of operations. For example, the government authorities in a country in which Faurecia operates could update standards that apply to the Group’s products, which could have negative consequences for the Group’s operating income. These risks may be further exacerbated by macroeconomic trends and developments, such as trade tensions between various regions, which could lead to unfavorable changes in trade policies that apply to the Group’s products. These developments could have a material adverse effect on the Group’s business, financial condition and results of operations. |
|
Risk management |
|
|
|
The Group relies on the expertise of its Legal, Tax and Finance departments, which consistently monitor legislation and regulations in France and abroad via local intermediaries (employees, networks of lawyers, tax specialists, etc.). The Strategy department integrates a monitoring unit that analyzes regulatory aspects in terms of sustainability and has a direct link to the activities . It can anticipate changes that might affect the design of the Group’s products. Regular reviews are carried out regarding changes which may have a significant impact on the Group’s business, and specific measures are taken to hedge the associated risks. The Group assesses the risk of the countries in which it operates. To do this, it relies on the tool of an external service provider, which produces a risk mapping by country, classified according to a three-color code representing the level of external risk. The method is based on several criteria that are fundamental to the automotive supplier business. Faurecia and HELLA teams are synchronizing the geopolitical tensions risks. |
2.1.3.2.Significant litigation
|
|
Probability ●●○ |
Impact ●●○ |
---|---|---|---|
Identification and description of risk |
|
Potential impact on the Group |
|
Given its key role and the nature of manufacturing in the global automotive industry, the Group may become the target of litigation or claims filed by its customers, suppliers, end-users or government authorities or become subject to class action lawsuits. These lawsuits, claims and proceedings typically arise in the normal course of business and include claims pertaining to product liability, product safety, environmental, safety and health, intellectual property, employment, commercial and contractual matters and various other matters. The Group may also be subject to investigations by various regulatory authorities regarding compliance with local laws in certain jurisdictions. |
|
The frequency and outcome of such lawsuits, investigations, claims or proceedings cannot be predicted with certainty. Major litigation could have a negative impact on the Group’s financial position that is greater than the Group anticipates or cause harm to the Group’s image. |
|
Risk management |
|
|
|
Adequate provisions have been set aside to cover litigation facing the Group, in accordance with the facts and information available at the balance sheet date. Note 24.2 to the appendix of the consolidated financial statements as of December 31, 2022 gives a description of ongoing significant claims and litigation and indicates the total amount of provisions for litigation. Litigation is tracked quarterly at the Group level and monthly at the business level through reporting prepared by the Legal department. Preventative measures, in particular via the provision of training to core teams, negotiation of contractual terms and proactive identification of potential legal risks are implemented on a continuous basis. Since 2022, the same process has been in place to monitor HELLA litigations. |
2.1.3.3.NFPD Responsible value chain
|
|
Probability ●●● |
Impact ●○○ |
---|---|---|---|
Identification and description of risk |
|
Potential impact on the Group |
|
The Group pays particular attention to the risks related to fundamental rights (child labor, forced labor, non-respect for union freedom, environmental damages, etc.) relevant to its activities, all of its suppliers and subcontractors. Due to a large number of suppliers (more than 25,000 in more than 60 countries during 2022), the Group cannot exclude the existence, and may not be aware, of bad practices within its suppliers, in terms of respect for the environment, business ethics, labor law or human rights and fundamental freedoms. |
|
If one of the Group’s suppliers has failed, or is suspected of having failed to comply with environmental standards, business ethics, labor law, or human and fundamental rights, or if the Group’s integrity on these issues is called into doubt, it could have significant consequences for its reputation, business activity and financial position. |
|
Risk management |
|
|
|
The Group’s Purchasing department has established a policy of sustainable buying, called “Buy Beyond,” which reflects the Group’s commitment to comply with the requirements of the Law No. 2017-399 of March 27, 2017, related to the duty of care. This policy consists, in particular, in systematically reviewing suppliers that are part of the Group production process prior to their selection. For existing suppliers, selection among the main suppliers is complete. This analysis is conducted through a partner of the Group, EcoVadis, and addresses the following areas:
Since 2019, the EcoVadis supplier evaluation requires a minimum score. In an effort to achieve continuous improvement, this score has changed over the years, rising from 30 out of 100 in 2019 and to 40 out of 100 in 2022. Moreover, supplier quality audits, which are a prerequisite to joining the Group’s panel of suppliers, also include CSR requirements. The Group is committed to building close, long-term relationships with its suppliers, based on mutual growth and benefit. It requires its suppliers to abide by the Buy Beyond purchasing policy by enforcing, within their own organization and their own global supply chain, the Code of Conduct for suppliers and subcontractors, which was implemented by Faurecia in 2013 and which is always included in the mandatory bidding documents sent to suppliers. The responsible purchasing policy is described in further detail in Chapter 4 “Extra-Financial performance”, Section 4.3.4 "Responsible supply-chain" of this Universal Registration Document. Lastly, the Group has an external whistle-blowing system that makes it possible to report any breaches related to human rights and fundamental freedoms, or to individual health and safety as well as the environment. This process is being harmonized between Faurecia & HELLA in order to cover the entire supplier base of the Group. |
2.1.3.4.Intellectual property
|
|
Probability ●●● |
Impact ●○○ |
---|---|---|---|
Identification and description of risk |
|
Potential impact on the Group |
|
The Group conducts an active R&D policy and stresses protection of the resulting innovations. To this end, the Group files patents and designs for technologies, products and processes in many countries. In particular, 759 new patent applications and 743 territorial extensions were filed by the Group in 2022 for a total of 1,502 patent applications filed. There are more than 14,300 patents in the patent portfolio. Due to these significant volumes, the Group may be exposed to infringement of its intellectual property rights by third parties. Moreover, given its active innovation policy, the Group may also be exposed to the involuntary infringement of intellectual property rights held by third parties (unpublished or unidentified rights).
|
|
Such events are likely to negatively impact the Group’s business and results, as well as its image and the quality of its products. The Group cannot rule out the risk that its intellectual property rights may be disputed by a third party, including by non-practicing entities or “patent trolls”, on the grounds of preexisting rights or for any other reason, whether or not founded. The use of new technologies also entails the risk of infringing upon patents of other companies. The materialization of such a risk could have a financial impact as a result of claims for damages or loss of business income and harm the Group’s reputation. The Group may also be required to modify its products or processes or negotiate rights of use with third parties generating significant financial consequences. Furthermore, for countries outside France, the Group cannot be sure of holding or obtaining intellectual and industrial property rights offering the same level of protection as those in France. |
|
Risk management |
|
|
|
In order to support and accompany its innovation policy and reinforce the protection of its rights, the Group has a centralized organization that handles all technical and legal issues relating to intellectual property. Bi-monthly committee meetings organized for each business allow strategic decisions to be made to protect transactions with all stakeholders. Twice a year, Intellectual Property Management Committees define the strategies for the businesses and their application, as well as the resources necessary. The Group files patents and designs for technologies, products, and processes in many countries. The Group also protects its name and certain product ranges via trademark law. For example, the Faurecia trademark is protected in all countries of interest to the Group and this protection is monitored. The Group has a large and solid portfolio of intellectual property rights. It is supported by in-house teams of experts and specialists and a global network of advisers, who conduct searches of existing patents and technology watches and monitor the competition, as well as analyses of third-party rights regarding ongoing projects. The Group undertakes actions to prevent, terminate and penalize infringements of its intellectual property rights. For instance, the Group may act against third parties that use its patents, know-how, designs and models or trademarks without its authorization, or it may file challenges or actions for invalidation against third-party patents whose issue the Group does not deem justified. |
2.1.3.5.NFPD Business ethics
|
|
Probability ●●○ |
Impact ●●● |
---|---|---|---|
Identification and description of risk |
|
Potential impact on the Group |
|
The Group’s organization is decentralized and located in many countries. Each of these countries may have anti-corruption legislation that is potentially extra-territorial in scope. This is the case with regard to the Sapin II law in France, the Bribery Act in the United Kingdom and the Foreign Corrupt Practices Act in the United States. In addition, given the specific nature of the automotive sector (in particular, the presence of a reduced number of stakeholders in certain markets), the Group may also be exposed to antitrust risks (for example, cartel arrangements). Although the Group has a number of company-wide policies and measures, including the “Code of Ethics”, which addresses the latest requirements of applicable French anti-corruption legislation, there can be no assurance that violations of the Group’s internal corporate governance requirements will not occur. |
|
These regulations, some of which are quite recent, and the specific nature of the sector mean that the Group is exposed to sanctions in the event of non-compliance, which could in turn have a material adverse effect on the Group’s business, financial condition and results of operations. In addition, should the Group’s integrity in these matters be called into question, this could have significant consequences on its reputation and commercial activity. |
|
Risk management |
|
|
|
Faurecia’s ethical commitments are formalized and detailed in the Code of Ethics, which establishes the essential rules of conduct and ethics applicable to all personnel as well as its partners. This Code of Ethics is given to each new employee, is available in a range of languages and may also be accessed on the Group’s website and intranet. All Group employees are responsible for complying with the Code of Ethics and, if applicable, ensuring that it is circulated and complied with. The Group also has a Code of Conduct for the prevention of corruption. It contains internal rules that are widely distributed to employees. These rules cover in particular the following subjects: gift and hospitality policy; donations and sponsorship; conflict of interest management (via an electronic tool). HELLA has a separate code of ethics and in 2022 it adopted a code of conduct for the prevention of corruption similar to the one of Faurecia. Since 2015, Faurecia has a Compliance department. This is under the responsibility of the Chief Compliance Officer, who reports to the Group’s General Counsel and Secretary of the Board. The Compliance department relies on regional compliance officers for the Americas (United States, Canada, Mexico, Brazil and Argentina), Asia and the EMEA region (Europe, Middle East and Africa). It also relies on a network of compliance leaders who serve as contacts in each operational division of the businesses. A compliance program with:
Faurecia and HELLA work closely together to define and implement a common compliance programme that meets international standards, including the requirements of the Sapin 2 Law. |
2.2.Contributors and global risk program
The Audit Committee, which is tasked with overseeing the effectiveness of the risk management program and the internal control system (which are not limited to accounting and financial risks), informs the Board of Directors of the main actions taken by the Group in this domain. Risk contributors provide information to the Audit Committee which conducts a formal annual review of the global risk management program and the internal control system.
The following diagrams provide a summary of the organization and processes of risk management & control within the Group.
2.2.1.Operational departments
The Group’s Executive Committee examines the major operational risks inherent to the Group’s business during the monthly meetings of the Operations Committee, and at least once per year it reviews the risk mapping prepared by the Group’s Risk Committee.
The Executive Management of each business (Business Group) is responsible for identifying and managing the operational risks inherent to its business, which are examined by the respective Operations Committee and Risk Committee. The operational and support functions direct and lead the actions, including risk management, necessary to achieve the Group’s objectives.
2.2.2.Functional departments
Focusing on their specific fields, the Group’s functional departments are responsible for complying and ensuring compliance with current regulations and standards, improving their processes and working with the other departments in order to improve cross-functional processes. They monitor the performance of the operating entities and provide coordination and support to the divisions and sites reporting to them. Each manager is responsible for assessing risks with regard to the processes for which he is responsible and is directly involved in their mitigation and the implementation of internal control measures.
2.2.2.1.Finance department
Principles applied to the preparation of financial statements
The Group Finance department, which reports to the Chief Executive Officer, is responsible for outlining the rules and procedures, consolidating the financial statements, managing cash and financing, and carrying out management control, internal control and internal audits.
- ■determining the Group’s accounting and financial standards in accordance with IFRS as adopted by the European Union and the tax provisions and accounting standards specific to each country, and ensuring compliance with them;
- ■preparing the annual parent company financial statements, the monthly consolidated financial statements and, more specifically, the interim and annual financial information to be reported;
- ■outlining, improving and ensuring enforcement of the internal control procedures needed to produce reliable accounting information. These procedures include a generalization of the permanent inventory process completed by physical inventory takings at least once a year, the strict separation of tasks, and thorough monitoring of access to the various accounting transactions as a function of the different businesses;
- ■managing and improving the information systems used to produce accounting and financial data.
The Country or Regional Chief Financial Officers who manage the shared financial service centers report to the Group’s Finance department. They are responsible for:
- ■the production of the financial and accounting statements for all the units within their scope, in compliance with IFRS and local standards, and the closure dates set by the Group;
- ■compliance with and improvements to the internal control procedures specific to their scope;
- ■strengthening the role and skills of the accounting function;
- ■close collaboration with operational sites within their scope in order to work with them to solve internal control issues and to improve the overall effectiveness of the financial process.
This organization between, on one hand, shared services responsible for producing the financial statements and complying with the standards, and on the other, the controllers considered as co-pilots for the management of operational entity, enables a real separation of tasks and a better development of skills in each role, resulting in better overall effectiveness and reduced risk of fraud.
- ■completeness of transaction processing;
- ■transaction compliance with applicable accounting principles;
- ■periodic review of assets.
Financial reporting process
The goal of the reporting processes is to provide all the financial and non-financial information needed to manage the Group and disclose the financial statements in accordance with applicable accounting standards and the rules decreed by the Autorité des Marchés Financiers (AMF). A “reporting” glossary describes all the content of the reporting data. Procedures explain how this must be carried out.
Monthly reporting
The Oracle HFM (Hyperion Financial Management) and PBCS (Planning and Budgeting Cloud Service) consolidation systems are used for the monthly reporting of both financial information (income statement and balance sheet data) and non-financial information (such as indicators relating to quality, production, purchasing, safety, human resources, etc.). Each business unit reports its final results of operations four days after the end of the month in accordance with Group standards. Every month, the Operations Committee reviews the operational performance and action plans of each Business Group.
Budget and strategic plan
The Group draws up a year sales plan each year, in which programs play an essential role. This plan determines the Group’s business outlook by business and product line, and the Group’s resources and profitability. It is consolidated using the same tools as for monthly reporting and it is also used to define the budgetary targets for the following year.
In order to effectively anticipate short-term changes and improve responsiveness, monthly reporting includes a rolling forecast for the income statement and cash flow statement for the current and subsequent quarters.
Information systems
For process and data management purposes, the Group uses a unique management software package based on SAP. This solution is common to all sites (except recent acquisitions, of which HELLA) and enables standardization and digitization to occur at a faster pace. All management processes (orders, inventory, flow of parts, receiving, shipping, accounting, etc.) are supported by this solution.
Moreover, the Group relies on this software package to accelerate digitization in numerous areas such as management of workshops and transportation, measuring customer satisfaction, managing maintenance, etc. Work is in progress to enable all of this data to be used by artificial intelligence tools to optimize the processes. An analysis is also underway to define any changes to be expected concerning the architecture of the Group’s information systems, as part of the integration of HELLA.
2.2.2.2.Internal control
Within the Group, internal control is a mechanism that encompasses a set of resources, behaviors, training, procedures and actions, the overall purpose of which is to mitigate risks (prevention and protection) that may:
- ■have an impact on the financial and accounting information published by the Group;
- ■cause damage to the Group’s image and reputation;
- ■expose the Group to regulatory or legal sanctions from the various jurisdictions and competition authorities of the countries in which it operates;
- ■threaten the Group’s employees and ecosystem (risk of natural disasters, epidemics, environmental risks);
- ■prevent the Group’s customers from producing, delay their production or hinder their product and service performance (critical equipment breakdown, quality risks, delays in products development);
- ■prevent the Group from being able to continue to finance its operations (cash flow crisis);
- ■threaten the confidentiality of the information held by the Group on its own behalf (intellectual property, data on technologies, financial data) or with regard to its employees (personal data).
By helping to prevent and control risks that could negatively impact the Group in attaining its goals, the risk management and internal control program plays a key role in conducting and steering its various business activities. However, no risk management and internal control system can provide an absolute guarantee that the Group’s objectives will be achieved. In fact, inherent limits exist to any risk management and internal control program, notably due to the uncertainties of the outside world, the exercise of judgment or shortcomings that may arise due to technical or human failure.
Scope
The Group’s internal control system is deployed throughout the Company and its fully consolidated subsidiaries and covers a larger scope than the procedures related to the preparation and processing of accounting and financial information.
Internal control missions
- ■participating in projects to improve cross-functional processes (transportation, protection of the access and rights associated with IT applications, improving IT tools, etc.);
- ■mobilizing the Group’s employees around a common vision of the main risks and making them aware of the risks inherent to their business activity;
- ■training on internal control, some of which are now offered by Faurecia University (Faurecia’s internal training center), including online training modules. Please note that the “basic” module is mandatory for all Group executives;
- ■preparation for COSO certification, which is an internal control standard defined by the Committee of Sponsoring Organization of the Treadway Commission. Faurecia’s primary contributors in internal control all hold COSO certification;
- ■self-assessment campaigns for all corporate management cycles (business management, direct and indirect purchases, inventory management, management of property, plant and equipment, payroll management, tracking of standard costs, information system management, management of expats and other personnel transfers, etc.). A self-assessment questionnaire addressing the most important control items for operational sites (plants and Research & Development centers) was deployed in 2017 in order to help these sites strengthen their internal control system (methods of proof, identification of weaknesses and corresponding action plans). Since 2018, the scope of the self-assessment has been extended to the registered office and administrative centers, in order to comprehensively cover Faurecia’s business activities. This questionnaire is reviewed annually; a self-assessment program was rolled out in 2019 to strengthen control over development costs, volumes and other assumptions used for the Business Plans;
- ■regular communication with operational entities, functional departments and the Executive Committee to make all business lines aware of current priority issues (fraud, improvement actions, best practices, etc.);
- ■monitoring of “high” and “critical” recommendations raised by internal audit as part of their assignments;
Internal control representatives are present at several levels of the organization (Group, activities, divisions, shared financial service centers) in order to support the approach without taking on the responsibilities of operations management.
Procedures
Internal control is based on a set of principles and procedures: the Group’s culture (Being Faurecia), which is based on six key values and on the Code of Ethics, the Management Code and the Faurecia Excellence System, which represents the operational focus, defining the ways of working for the Group’s employees right around the world and structuring the Group’s identity.
The documentation on which the internal control system is based is therefore made up of the following items, which can all be accessed on the Group’s intranet:
- ■Manager Empowerment, which defines six general cross-functional principles for managers in certain key areas: Acquire a new program; Assess Managers and Professionals; Decide on Capital Expenditures; Decide on Exceptional Items; Manage Managers and Professionals Compensation; Staff Managers and Professional positions;
- ■the Faurecia Core Procedures are set out within nine processes developed by each Group division respecting a common general framework, and apply to all subsidiaries controlled by the Group. They are regularly updated and continually enhanced. The nine processes are as follows:
- ■Production Control and Logistics,
- ■Purchasing,
- ■Quality and HSE (Health, Safety and Environment),
- ■PMS (Program Management System) and Engineering,
- ■Sales and Marketing,
- ■Communication,
- ■Finance,
- ■Human Resources,
- ■Information Technology;
- ■Faurecia’s Alert Management System (AMS) immediately informs activities management teams and, if necessary, the Group Executive Committee of any problems encountered in production and program management. This system also ensures a prompt and structured response including problem-solving and capitalization of the solution is achieved by the organization.
Governance
Internal control reports on its work and sustains the connection between the disciplines in the form of the Internal Control Governance Committee, which holds monthly meetings chaired by the Group Chief Financial Officer. This Committee also includes the Chief Risk Officer, the Deputy Chief Financial Officer, the Director of Internal Audit, the General Counsel, the Chief Compliance Officer, and the Chief Financial Officers of the businesses.
Its work is also regularly reviewed by the Audit Committee of the Board of Directors and the Executive Committee.
In 2022, the Faurecia and HELLA teams launched an analysis to harmonize the internal control process between the two teams.
2.2.2.3.Internal Audit
The Internal Audit department assesses the effectiveness of the internal control and governance mechanism and checks that Group procedures are in compliance with local laws and regulations. It defines its missions on the basis of the Group’s risk mapping and an independent risk assessment.
The Internal Audit department is under the responsibility of the Group’s General Secretary, with an option to directly alert the Chief Executive Officer and the Chairman of the Audit Committee. It submits the audit program for approval once a year to the Chief Executive Officer, the Chief Financial Officer and the Audit Committee. It regularly reports to them on the results of its audit assignments and the measures taken to achieve its audit objectives. It reports to the Audit Committee at least twice per year on the result of its work and its schedule of activities.
Located at the Group’s registered office, it also has regional teams based in France, the United States and China.
It conducts its assignments wholly independently and systematically substantiates its findings with specific facts that have been duly verified. It follows up on its recommendations that have been sent to the audited sites via (i) an online audit tool or (ii) by an on-site follow-up if deemed necessary.
The Internal Audit department has an Internal Audit Charter, which was last reviewed in December 2022 and which defines its roles and purpose, its field of competence and the audit methodology used for its assignments.
2.2.2.4.Risk Management department
Enterprise RISK MANAGEMENT program (ERM)
Risk management is handled by the Group Risk Committee, which is chaired by the Chief Financial Officer. The main tasks of the Risk Committee are to update risk mapping, ensure that the corresponding control (causes) and mitigation (consequences) plans are established and implemented and, more broadly, ensure that risks are monitored regularly.
The Group Risk Committee meets quarterly. The Chief Financial Officer, the Deputy Chief Financial Officer, the Chief Risk Officer, the Director of Internal Audit, the General Counsel and the Chief Compliance Officer are also members of this committee. A representative, called Risk sponsor, of each major Group function, Business Groups and main regions, as well as Risk managers of risk management bodies (insurance, loss prevention, CSR, Financial controlling, Quality, Purchasing, HSE, etc.) also sit on this committee. The Risk Champions, responsible for each risk, are invited to participate according to the agenda to present the risk management action plans.
The Group Risk Committee’s work is also reviewed at least once a year by the Audit Committee and the Board of Directors. The risks monitored by this committee are associated with personal safety, quality, program management, IT systems, the reliability of supplies, asset protection and fire risk, exposure of industrial parks to certain types of natural disasters, the reliability of financial information, compliance and the environment. In addition to an annual review of the entire risk management system, the Audit Committee also conducts an in-depth review of a specific risk several times a year.
In an effort of continuous improvement of the Enterprise Risk Management program, the Group risk mapping is reviewed regularly and the integration of new risks is submitted to the Group Risk Committee and the Audit Committee.
The Group has appointed a Chief Risk Officer who reports to the Group General Counsel and Secretary of the Board of Directors. He is in charge of the Enterprise Risk Management program, which is based on the ISO 31000 standard.
He leads a network of Risk sponsors who report directly to a member of the Executive Committee and who represent each of the three pillars of the Enterprise Risk Management program:
Each Risk sponsor has one or more Risk champions who cover one or more risks in the system. They are responsible for coordinating the Enterprise Risk Managment program within their function, business group or region. The internal network thus deployed provides comprehensive coverage of the Group in terms of risk management in order to protect and create value on both Faurecia and HELLA.
The Enterprise Risk Management program was designed to cover all categories of risks, regardless of their exposure and impact, whether strategic, financial, social, legal, operational or reputational.
Each year, the Group launches a risk assessment campaign covering the 3 pillars with Group Management, with two objectives:
- ■identify any new risks (emerging risks);
- ■update the mapping of tolerance for known risks (existing risks).
This approach makes it possible to prepare the organization and raise its awareness of risk management in order to update the Group’s risk register, called the “risk universe” each year, and to standardize the working framework for all of the Group’s lines of defense.
The Enterprise Risk Management program has also been described into two procedures (Faurecia Core Procedures); the associated process, called ERM, is built using a step-by-step approach and provides the method to be followed by the Global Risk Leadership team, both functionally and operationally, with the Group’s businesses and regional representatives, who are all in charge to deal with risk.
The risk register enables a close monitorinf of the subjects analysed by the Group Risk Committee. It was set up in 2017 and, since 2018, it is accessible remotely using a dedicated IT solution developed in-house in real-time to share the information between the various lines of defense: the risk universe, risk sheets, risk assessment with associated parameters and risk tolerance mapping. Finally, quarterly reporting and monitoring are carried out using more than 100 risk indicators (which assess the threat and the level of danger or risk appetite) as well as the main measures of control and risk mitigation plans.
In 2020, in addition to the usual work, the risk universe was extended to cover the new emerging risks. An analysis of the specific risks linked with our three historical businesses was carried out in order to feed the Group’s risk mapping, but also to provide a risk-based thinking vision by Buiness Groups, giving them more autonomy on an Operational Risk Management standpoint.
In 2021, in order to strengthen anticipation, the Group introduced a risk assessment approach embedded into its strategic planning process. This approach combines not only work on the definition of threats (value protection) but also on opportunities (value creation). Thanks to a bottom-up approach by business and by product line, the assessment of potential net impacts was combined with a time scale of 15 years, to identify future risks in a strategic risk mapping.
In 2022, in order to strengthen risk management, the Group Risk Committee implemented a new method for dealing with risks more efficiently. It tiers them into three classes and is called the “ABC risk class”. It is based on the principle that each risk is broken down into two elements: threat and opportunity. For each class, the ratio between the threats on the one hand, and the possibilities of seizing new opportunities on the other hand is inversely proportional. Each of the classes therefore addresses different stakeholders in the organization to better manage the risk.
- ■A | Disruptive: risk-taking, generally by top management, that engage the corporate strategy and the future of the company;
- ■B | Unpredictable: which cause is exogenous and for which the organization must be prepared with the expertise of the functional teams;
- ■C | Preventable: at the heart of the business they are operational risks by nature and well known, these risks must be prevented by the operational entities and processed with the "4T's" methodology detailed in chapter 2.1 under Methodology.
As part of the HELLA integration, HELLA’s risk management team works closely with Faurecia’s one to better deal with FORVIA risks.
2.2.2.5.Compliance department
Compliance program
Organization
The Compliance department was created in 2015. Its matrix structure relies on functional and operational resources, which allows for wide distribution of its annual plan. The Chief Compliance Officer determines program priorities that arise from the risk analysis of the previous compliance plan. Regional Compliance Officers (RCOs) drive the compliance program in the regions in which the Group operates: Americas (United States, Canada, Mexico, Brazil and Argentina), Asia and EMEA (Europe, Middle East and Africa). The Compliance department also relies on a network of contact people, called Compliance Leaders, in each operational division of the businesses. As part of the identification and monitoring of non-compliance risks, the compliance team works closely with the Chief Risk Officer and members of functions in the second (finance, internal control, IT, etc.) and third (internal audit and external audit) lines of defense.
Frame of Reference
The Group is a signatory of the United Nations Global Compact. Consequently, the Group is committed to aligning its operations and strategy with 10 universally accepted principles in the areas of human rights, labor standards, the environment and the fight against corruption. This commitment is reasserted in the Code of Ethics, which is updated on a regular basis, specifically (i) as part of the roll-out of the “Being FORVIA” program intended to strengthen the Group culture and thereby contribute to long-term value creation, and (ii) to integrate the changes resulting from the provisions of the Sapin II law. Moreover, the Management Code, established to guide the day-to-day management of the teams, customers and suppliers, translates many of the principles set out in the Code of Ethics into operational terms. The Management Code is given to each new employee and is available in the Group’s main working languages. It can also be accessed on the Group’s corporate website and intranet.
The Code of Ethics is structured around four topics: respect of fundamental rights, development of economic and social dialog, skills development, and ethics and rules of conduct. It forms part of the Faurecia Core Procedures and aims to develop accountability and employee empowerment.
Furthermore, the Group has an anti-corruption Code of Conduct and a best practice guide concerning anti-competitive practices. It contains internal rules that are widely distributed to employees. These rules cover the following subjects: policy on gifts and hospitality, donations and sponsorships, managing conflicts of interest (via an electronic tool) and the “golden rules” of competition law.
The functions of the second line of defense regularly monitor risks to prevent and fight against corruption at Faurecia. The Compliance and Legal departments assess the risks before and/or after acquisition operations. Accounting controls to prevent and identify acts of corruption are carried out by Compliance, Internal Control and the Finance Directors of the countries concerned. In addition, Internal Audit conducts assignments relating to the existence and effectiveness of the Group’s anti-corruption program. These missions cover a sample of transactions selected by the audit.
Lastly, internal rules exist in relation to the risk tracking system for the Group’s third parties and their co-contractors, as applicable.
Training and Communication
In order to maintain the Group’s strong culture of ethics and compliance, the Compliance department introduced a training program tailored to risks that targeted populations may encounter.
The training and communication program on ethical rules and compliance relies on various internal communication mechanisms. There is a core of mandatory online training (MOOC) focusing in particular on ethics, competition rules and the fight against corruption. In order to maintain a strong compliance culture, the Group Compliance department has implemented different training sessions accessible to all employees of the Group (FORVIANS including temporary employees, interns, consultants, etc.). These trainings are Faurecia tailored and include the risks that may face targeted population. The pedagogical approach promotes interactive training using short videos and animations. Moreover, the Group has prepared and disseminated practical guides and an online training.
Periodic hard-copy and electronic publications, as well as blogs and intranet communities, provide opportunities for the Group to communicate more widely about its internal rules.
Moreover, Regional Compliance Officers and Compliance Leaders regularly organize, at industrial parks and within divisions of the Business Groups, on-site training or communication sessions to ensure a close culture of ethics and compliance. These training sessions also occur, in particular, in the context of audit duties conducted by the Internal Audit.
Governance
The measures taken by the Group to prevent breaches, (particularly in the area of corruption), as well as areas for improvement, are regularly presented and discussed at the various bodies in which the compliance function participates.
On the Group level, the Chief Executive Officer chairs a quarterly committee, which is steered by the compliance function. Its main missions and strategic decisions are discussed and approved within this body.
The Group’s Chief Financial Officer chairs the quarterly Risk Committee meetings, which is steered by the Risk department. The main risks identified and monitored by the compliance function are in particular presented and discussed in this Committee.
Furthermore, Compliance Leaders facilitate quarterly Compliance Committee meetings, which are chaired by the manager of each of the Business Groups. They deploy and facilitate the compliance program at each level of the Group’s activities in conjunction with priorities defined at the Group level.
Finally, each Regional Compliance Officer oversees one or several quarterly Compliance Committee meetings to present the actions and results of the compliance program in their region
Whistle-blowing procedure
Faurecia implemented a whistle-blowing system (“Speak Up”), revamped as part of its compliance with the Sapin II and Duty of Care laws and the General Data Protection Regulation (EU GDPR). Thus, any Group employee (FORVIANS including temporary employees, interns, consultants, etc.) as well as any person and entity are called upon to express their concerns or report a breach of the Code of Ethics, the Code of Conduct for the prevention of corruption, internal policies and procedures or the law, by reporting it to the Company’s management:
- ■either via the internal whistle-blowing procedure: any Group employee may share their concerns or indicate unethical behavior to their line manager, to someone in Human Resources, or a compliance team member;
- ■or through a dedicated whistle-blowing hotline: this channel may be used specifically for the most serious cases mentioned above. This mechanism offers enhanced protection through “legal confidentiality”. The dedicated whistle-blowing hotline is accessible via a website: https://faurecia.ethicspoint.com/.
All cases are initially analyzed to determine whether there is sufficient evidence to initiate an investigation, if necessary. After analysis, the lessons learned are regularly shared with the functions concerned. To this end, Compliance department has created a library that gathers all cases according to the following main categories: human resources (inappropriate behavior, discrimination, harassment, etc.), finance (compliance with accounting rules, fraud), conflicts of interest (selection of suppliers, non-declaration), violation of internal processes, environment and safety, corruption, compliance with competition rules, etc. This periodic reporting guarantees the anonymity of the protagonists.
Compliance communicates widely on the Speak up process, procedures and training. All alerts are received by the Chief Compliance Officer and the General Counsel who, where applicable, together with Regional Compliance Officers provide legal protection for the whistleblower. Alerts can be entered into the tool in the desired language by the whistle-blower. The tool is configured in the main Faurecia languages. Upon receipt of the alert, an investigation procedure is initiated in order to best ensure its management in accordance with applicable internal and local rules. At the end of the investigation, corrective actions can be taken. The Compliance department monitors the implementation of these actions and periodically reports on the trends identified.
2.2.2.6.Legal department
The Legal department consists of a team located in France and in the main countries where the Group operates. It is based on an organization based on three pillars:
- ■lawyers specializing in certain areas (competition, mergers & acquisitions, intellectual property, company law, information technology);
- ■general legal experts in each product line - Business Group (seats, interiors, clean mobility, electronics, lighting and after-sales);
- ■general legal experts in the Group’s main regions (Americas, Europe and the Middle East, Asia and China),
Thanks to these various skills, a constant legal watch and the implementation of control and reporting processes, the Legal department protects and ensures the security of the Group's operations.
2.2.3.External stakeholders
- ■the Statutory Auditors;
- ■third-party organizations which carry out the following certification processes for the entire Group over a three-year cycle:
- ■environment (ISO 14001),
- ■quality (ISO TS/IATF);
- ■engineers from fire and property insurance companies who conduct a biennial audit on each of the Group’s sites to:
- ■assess fire risks and any potential impact on production and customers,
- ■check whether the prevention and protection measures in place are adequate,
- ■issue recommendations to reduce risks.
2.3.Insurance and risk coverage
The Group's asset protection policy is based on the implementation and ongoing adaptation of a policy of (i) preventing industrial risks and (ii) transferring the main insurable risks to the insurance market.
In addition, given the trend in claims and the unfavorable trend in the insurance market - in particular the increase in deductibles - Faurecia is de facto its own insurer to a certain extent. The Group has set up a captive reinsurance company based in Luxembourg in order to further structure this self-insurance. The Group obtained approval from the Luxembourg Insurance Commission in May 2021 and Forvia-Ré is now active in the Group's liability, property and casualty and business interruption insurance programs.
2.3.1.Fire, property damage and business interruption insurance
The Group has taken out a fire, property damage and business interruption insurance policy with a co-insurance group of major insurers led by FM Global.
Buildings and equipment are insured as replacement values. The guarantees are organized around a Master policy which directly covers the risks located in the area of freedom to provide services and local policies for subsidiaries located outside this area.
The premium rates applicable to exposed capital (direct damage and annual gross margin) depend directly on the Highly Protected Risk (HPR) classification assigned to the site, after audit by the insurer.
- ■June 2019: destruction following a fire at the plant belonging to the FCM supplier Modulo in Poland;
- ■November 2019: a fire in a workshop used for the manufacturing of flooring and trim and door panels in the Abrera plant in Spain following an outbreak of a fire on a painting production line.
These claims and general developments in the insurance market have led to a significant tightening of the program’s terms and conditions:
- ■a sharp increase in deductibles, particularly for major sites that are poorly protected or exposed to high natural risks;
- ■increase in the premium;
- ■increase in the deductible for failures, and reduction in the level of coverage provided for indirect failures (tier-2 and above suppliers, customer suppliers).
- ■monitoring by the Risk Committee of the fire protection action plans of the most vulnerable main sites;
- ■the launch of an analysis and a monitoring of the fire and natural risks of our main suppliers, in particular through the precise location of their production plants;
- ■the launch of a technical and an economic evaluation of the costs of securing sites exposed to a high risk of flooding, earthquakes, wind or snowfall.
The renewal of the Property & Casualty policy in July 2022 was affected by an indexation of values in countries affected by inflation. Actions to improve the reliability of reported values are underway to mitigate this effect.
Lastly, the increase in climatic hazards could increase claims related to natural events or trigger other events (heat waves, water scarcity, etc.) likely to affect the Group’s operations. A comprehensive analysis of the industrial park portfolio was carried out by an external partner in 2022, with the aim of anticipating the likely impacts of climate change on the most vulnerable industrial parks. Based on this risk analysis, an adaptation plan will be rolled out to the sites concerned from 2023.
Damage insurance is supplemented by builder’s risk insurance and insurance covering the transportation of goods or equipment and political risk.
A consolidation project of the various regional transport policies is currently ongoing. A call for tenders was launched to renew the Transport policy and was won by AXA XL, which became the Group’s insurer on January 1, 2022. Prevention actions are underway to control claims in countries affected by recurrent claims.
2.3.2.Liability insurance
Since January 1, 2022, Allianz became the leader of the co-insurance program that covers Faurecia's civil liability. Civil liability insurance covers operational liability and product liability after delivery, including the risk of recall. Liability insurance takes the form of a Master policy combined with local policies taken out in countries where Faurecia has subsidiaries.
The Group's civil liability insurance plan also includes specific policies such as civil liability insurance for environmental damage or damage coverage due to accidents or occupational illnesses of personnel.
Several major claims were filed in the United States and Europe between 2014 and 2019. A surge in claims for physical injuries following an accident has also been recorded in the United States. This increase in claims affects the terms of the liability insurance plan.
Since 2019, it has been observed that the recent high loss experience as well as the tightening of market conditions lead to a sharp increase in the deductibles applicable in case of recall and in insurance premiums.
The acceleration of the Faurecia Hydrogen Solutions division requires the extension of insurance coverage to this new line of products and the associated industrial risks. To this end, information workshops for civil liability insurers were conducted to present these activities and work on risk prevention recommendations.
2.3.3.HELLA insurance
HELLA has set up an insurance program to cover the main risks related to its business. The Insurance departments of Faurecia and HELLA are working together to roll out a joint Group insurance program.
3Corporate governance
The information below constitutes the chapter relating to the corporate governance report as provided for by the last paragraph of Article L. 225-37 of the French Commercial Code.
Some of the information forming an integral part of the corporate governance report, as required by Articles L. 22-10-8 and L. 22-10-10 of the French Commercial Code, is included in other chapters of this Universal Registration Document. The cross-references included in this section indicate the chapter of this Universal Registration Document in which the relevant information can be found.
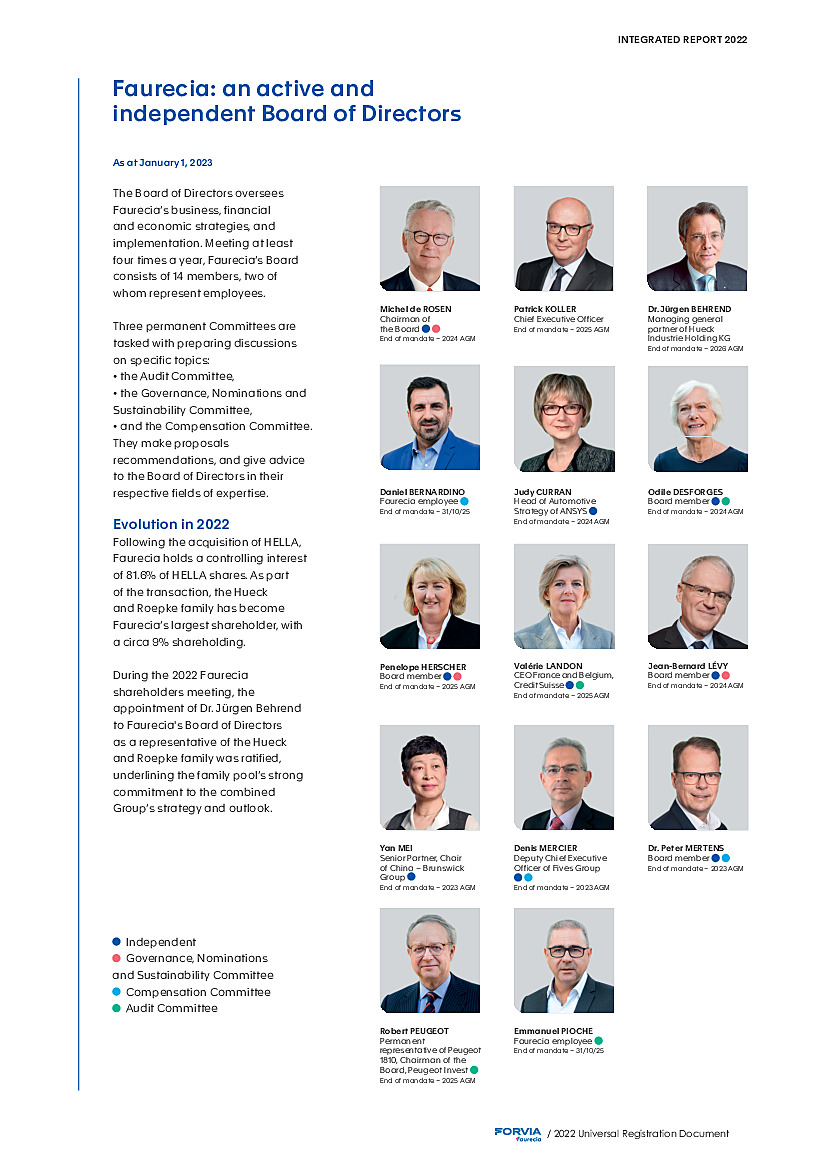
3.1.Board of Directors
3.1.1.Summary presentation of the Board of Directors and key figures
The diagram below summarizes the composition of the Board of Directors and the Committees (permanent) at the date of this Universal Registration Document:
The table below presents the key figures of the Board of Directors at the date of this Universal Registration Document.
3.1.2.Composition of the Board of Directors
3.1.2.1.General information on the composition of the Board of Directors
In accordance with the Company’s bylaws, Faurecia’s Board of Directors comprises at least three members and a maximum of 15 members, excluding Board members representing employees, appointed in accordance with Article L. 225-27-1 of the French Commercial Code.
Board members are appointed for a term of four years by the General Meeting, on the basis of proposals made by the Board of Directors, acting on the basis of recommendations made by the Governance, Nominations and Sustainability Committee. They may be re-elected and can be dismissed at any time by the General Meeting. Neither the bylaws nor the internal rules of the Board of Directors contain rules for staggered terms of office. However, in practice, appointments are renewed on a staggered basis, which helps avoid reappointing Board members all at once.
In addition, the Company has two Board members representing employees appointed pursuant to Article L. 225-27-1 of the French Commercial Code, in accordance with the following terms and conditions of the bylaws: one Board member representing employees is appointed by the labor union that obtained the most votes in the first round of the elections referred to in Articles L. 2122-1 and L. 2122-4 of the French Labor Code, and a second Board member representing employees is appointed by the European Employee Representation Council. They are also appointed for a term of four years.
The table below sets out and completes the information given in the above graph and in the key figures regarding the composition of the Board of Directors and the Specialized Committees (permanent) at the date of this Universal Registration Document.
|
Age |
Gender |
Nationality |
Number of shares |
Number of corporate offices in listed companies (excluding Faurecia) |
Independence |
Date of first appointment |
End of corporate office |
Length of time on Board |
Committees |
---|---|---|---|---|---|---|---|---|---|---|
1. Executive corporate officers |
||||||||||
Michel de ROSEN, Chairman of the Board of Directors |
72 years |
M |
|
12,565 |
2 |
Yes |
GM of May 27, 2016 |
GM in 2024 |
7 years |
Member of the Governance, Nominations and Sustainability Committee |
Patrick KOLLER, Chief Executive Officer and Board member |
64 years |
M |
|
149,386 |
2 |
No |
GM of May 30, 2017 |
GM in 2025 |
6 years |
- |
2. Board members appointed by the Meeting |
||||||||||
Jürgen BEHREND |
74 years |
M |
|
200,151 |
0 |
No |
GM of June 1, 2022 |
GM in 2026 |
9 months |
- |
Judy CURRAN |
61 years |
F |
|
500 |
2 |
Yes |
BoD meeting of February 18, 2022 |
GM in 2024 |
1 year |
- |
Odile DESFORGES |
73 years |
F |
|
664 |
1 |
Yes |
GM of May 27, 2016 |
GM in 2024 |
7 years |
Chairwoman of the Audit Committee |
Penelope HERSCHER |
62 years |
F |
|
500 |
3 |
Yes |
GM of May 30, 2017 |
GM in 2025 |
6 years |
Member of the Governance, Nominations and Sustainability Committee |
Valérie LANDON |
60 years |
F |
|
650 |
0 |
Yes |
BoD Meeting of October 12, 2017 |
GM in 2025 |
6 years |
Member of the Audit Committee |
Jean-Bernard LÉVY |
67 years |
M |
|
500 |
1(1) |
Yes |
Board meeting of February 19, 2021 |
GM in 2024 |
2 years |
Chairman of the Governance, Nominations and Sustainability Committee |
Yan MEI |
67 years |
F |
|
542 |
0 |
Yes |
GM of May 28, 2019 |
GM in 2023 |
4 years |
- |
Denis MERCIER |
63 years |
M |
|
1,157 |
0 |
Yes |
GM of May 28, 2019 |
GM in 2023 |
4 years |
Chairman of the Compensation Committee |
Peter MERTENS |
61 years |
M |
|
1,080 |
1 |
Yes |
GM of May 28, 2019 (with effect from November 1, 2019) |
GM in 2023 |
3 years |
Member of the Compensation Committee |
PEUGEOT 1810 |
72 years |
M |
|
6,110,494 (2) |
4(4) |
No |
GM of May 31, 2021(3) |
GM in 2025 |
2 years |
Member of the Audit Committee |
|
|
|
|
|
|
|
|
|
|
|
3. Board members representing employees |
||||||||||
Daniel BERNARDINO |
52 years |
M |
|
- (6) |
0 |
- (5) |
November 1, 2017 |
October 31, 2025 |
5 years |
Member of the Compensation Committee |
Emmanuel PIOCHE |
57 years |
M |
|
- (7) |
0 |
- (5) |
November 1, 2017 |
October 31, 2025 |
5 years |
Member of the Audit Committee |
(1) The mandate of Jean-Bernard LÉVY as Chairman of the Board and Chief Executive Officer of EDF ended 23 November 2022. (2) Robert PEUGEOT also holds 694 individual shares. (3) Robert PEUGEOT has been an individual Board member since May 29, 2007. The term of his corporate office ended on May 31, 2021. Since this date, he has been a permanent representative of PEUGEOT 1810. (4) Corporate offices held by the permanent representative. (5) In accordance with the AFEP MEDEF Code, Board members representing employees are not included in the calculation of the percentage of independent Board members. (6) Daniel BERNARDINO participated in an employee shareholding plan carried out in 2021 and holds as such FCPE shares invested in Faurecia shares. (7) Emmanuel PIOCHE participated in an employee shareholding plan carried out in 2021 and holds as such FCPE shares invested in Faurecia shares. |
3.1.2.2.Board members’ expertise, positions and corporate offices as of the date of this Universal Registration Document
Jürgen BEHREND |
|
|
|||||
---|---|---|---|---|---|---|---|
|
Date of birth: August 3, 1949 |
|
Board member |
||||
Nationality: |
|
|
|
|
Date of first appointment: |
GM in 2022 |
|
Number of Faurecia shares: 200,151 |
|
Date of expiry of corporate office: |
GM in 2026 |
||||
Skills: |
|
|
|||||
|
|||||||
|
|||||||
Dr. Jürgen Behrend began his career in 1980 as a member of the management board of Eduard Hueck GmbH & Co. KG in Lüdenscheid, a company specializing in the manufacturing of aluminum products. In 1987, he was appointed as managing general partner of HELLA and remained in this position until 2017. He then served on the shareholders' committee of HELLA until 2021. Dr. Behrend is still active as the managing general partner of Hueck Industrie Holding KG, a holding company that invests in small and medium-sized enterprises. He studied law and economics at the Universities of Freiburg, Munich and Münster and he received a doctorate degree in law in 1977/1978. |
|
Main position held outside of Faurecia
Other positions and corporate offices in 2022 outside of Faurecia French listed companies No such corporate office. French unlisted companies No such corporate office. Other foreign listed companies No such corporate office. Foreign unlisted companies
Positions and corporate offices held within the last five years and which have expired
|
|
Experience in Faurecia’s core businesses |
|
Experience in an industrial company |
|
International experience |
|
Automotive technologies |
---|
|
Governance/management of large companies |
|
Leadership and crisis management |
|
Risk management |
|
CSR |
|
Specific knowledge of a geographic market |
|
Data based technologies/digital |
|
Energy/electrification |
|
Banking/finance |
Daniel BERNARDINO |
|
|
|||||
---|---|---|---|---|---|---|---|
|
Date of birth: August 9, 1970 |
|
Board member representing employees |
||||
Nationality: |
|
|
|
|
Date of first appointment: |
November 1, 2017 |
|
Number of Faurecia shares: - * |
|
Date of expiry of corporate office: |
October 31, 2025 |
||||
Skills: |
|
Member of the Compensation Committee |
|||||
|
|||||||
|
|||||||
Daniel Bernardino is a method agent in the Logistics department at Faurecia’s Palmela site (Portugal). He joined the Group in 1994 as Head of the logistics team. He held various employee representation offices between 1997 and 2017 and has been a member of Faurecia’s European Works Council for 14 years. He is a sociology graduate. |
|
Main position held outside of Faurecia No outside position held. Other positions and corporate offices in 2022 outside of Faurecia No such corporate office. Positions and corporate offices held within the last five years and which have expired
|
|||||
* Daniel Bernardino participated in an employee shareholding plan carried out in 2021 and holds as such FCPE shares invested in Faurecia shares. |
|
Experience in Faurecia’s core businesses |
|
Experience in an industrial company |
|
Automotive technologies |
|
Specific knowledge of a geographic market |
|
Leadership and crisis management |
|
|
Judy CURRAN |
|
|
|||||
---|---|---|---|---|---|---|---|
|
Date of birth: May 17, 1961 |
|
Independent Board member |
||||
Nationality: |
|
|
|
|
Date of first appointment: |
February 18, 2022 |
|
Number of Faurecia shares: 500 |
|
Date of expiry of corporate office: |
GM in 2024 |
||||
Skills: |
|
|
|||||
|
|||||||
|
|||||||
Judy Curran is responsible for the Automotive Strategy at ANSYS including the go-to-market plans and the development of new simulation workflows aligned with latest automotive trends such as electrification, assisted driving and autonomy. Judy Curran served previously in a number of positions at Ford group from 1986 to 2018 (notably as Director of Technology Strategy from 2014 to 2018 where she notably developed the cross-vehicle global strategy for key new technologies including assisted driving, infotainment, new electrical architectures, and connectivity). Judy Curran holds a Bachelor of Science, Electrical Engineering/Computer Software from Lawrence Technological University (USA) and a Master of Science, Electrical Engineering from the University of Michigan (USA). |
|
Main position held outside of Faurecia
Other positions and corporate offices in 2022 outside of Faurecia French listed companies No such corporate office. French unlisted companies No such corporate office. Other foreign listed companies
Foreign unlisted companies
Positions and corporate offices held within the last five years and which have expired
|
|
Experience in Faurecia’s core businesses |
|
Experience in an industrial company |
|
International experience |
|
Automotive technologies |
---|
|
Governance/management of large companies |
|
Leadership and crisis management |
|
Risk management |
|
|
|
Specific knowledge of a geographic market |
|
Data based technologies/digital |
|
Energy/electrification |
|
|
Odile DESFORGES |
|
|
|||||
---|---|---|---|---|---|---|---|
|
Date of birth: January 24, 1950 |
|
Independent Board member |
||||
Nationality: |
|
|
|
|
Date of first appointment: |
May 27, 2016 |
|
Number of Faurecia shares: 664 |
|
Date of expiry of corporate office: |
GM in 2024 |
||||
Skills: |
|
Chairwoman of the Audit Committee |
|||||
|
|||||||
|
|||||||
Odile Desforges was a research analyst at the Institut de Recherche des Transports in 1973 before joining Renault in 1981, where she held several positions of responsibility in planning, product development and purchasing. Subsequently, after serving as Deputy Chief Executive Officer of Renault-VI/Mack and as a member of the Executive Committee with responsibility for planning, purchasing and program development from 1999 until 2001, she was appointed President of the Volvo 3P Business Unit of AB Volvo, where she remained until 2003. From 2003 to 2009, Odile Desforges was a member of Renault’s Management Committee and served as Head of Worldwide Purchasing for Renault/Nissan. In 2009, she was named to Renault’s Executive Committee and appointed as Group Director of Engineering and Quality. She exercised her rights to retire in July 2012. Odile Desforges is an engineer and graduate of École Centrale de Paris and of the European Center for Executive Development (CEDEP). She was made a Chevalier de l’Ordre National du Mérite and a Chevalier de la Légion d’Honneur by the French government. |
|
Main position held outside of Faurecia
Other positions and corporate offices in 2022 outside of Faurecia French listed companies
French unlisted companies No such corporate office. Other foreign listed companies No such corporate office. Foreign unlisted companies No such corporate office. Positions and corporate offices held within the last five years and which have expired
|
|
Experience in Faurecia’s core businesses |
|
Experience in an industrial company |
|
International experience |
|
Automotive technologies |
|
Governance/management of large companies |
|
Banking/finance |
|
Leadership and crisis management |
|
Risk management |
Penelope HERSCHER |
|
|
|||||
---|---|---|---|---|---|---|---|
|
Date of birth: July 15, 1960 |
|
Independent Board member |
||||
Nationality: |
|
|
|
|
Date of first appointment: |
May 30, 2017 |
|
Number of Faurecia shares: 500 |
|
Date of expiry of corporate office: |
GM in 2025 |
||||
Skills: |
|
|
|||||
|
|||||||
|
|||||||
Penelope Herscher is Chairwoman of the Board of Directors of Lumentum Operations LLC. (previously JDSU) as well as its Governance Committee. She is also Chairwoman of the Board of a listed company named SGH (formerly Smart Global) for which she also serves on the Governance Committee and of the listed company Embark Technology, as well as of two unlisted companies: Delphix and Modern Health. From 1996 to 2015, Peneloppe Herscher was CEO and Chair of two Silicon Valley technology companies: Simplex which she took public in 2001 and subsequently sold to Cadence Design Systems and FirstRain which she sold in 2017. Penelope Herscher holds a Bachelor of Arts with honors and a Master of Arts in Mathematics from Cambridge University (England). |
|
Main position held outside of Faurecia
Other positions and corporate offices in 2022 outside of Faurecia French listed companies No such corporate office. French unlisted companies No such corporate office. Other foreign listed companies
Foreign unlisted companies
Positions and corporate offices held within the last five years and which have expired
|
|
Experience in an industrial company |
|
International experience |
|
Governance/management of large companies |
|
Specific knowledge of a geographic market |
Patrick KOLLER |
|
|
|||||
---|---|---|---|---|---|---|---|
|
Date of birth: January 2, 1959 |
|
Board member |
||||
Nationality: |
|
|
|
|
Date of first appointment: |
May 30, 2017 |
|
Number of Faurecia shares: 149,386 |
|
Date of expiry of corporate office: |
GM in 2025 |
||||
Skills: |
|
|
|||||
|
|||||||
|
|||||||
Patrick Koller has been Chief Executive Officer of Faurecia since July 1, 2016. He has held various management positions with several major manufacturing groups (HELLA, Valeo, Rhodia). In 2006, he joined the Faurecia group as Executive Vice President of the Faurecia Automotive Seating Business Group (now Faurecia Seating), a position he held until February 2, 2015. During this period, he held various offices within the Group subsidiaries. On February 2, 2015, he was appointed Deputy Chief Executive Officer in charge of operations, a position he held until June 30, 2016. He graduated from the École Supérieure des Sciences et Technologies de l’Ingénieur de Nancy (ESSTIN). |
|
Main position held within Faurecia
Main position held outside of Faurecia
Other positions and corporate offices in 2022 outside of Faurecia French listed companies
French unlisted companies No such corporate office. Other foreign listed companies
Foreign unlisted companies No such corporate office. Other
Positions and corporate offices held within Faurecia group in the last five years and which have expired -
|
|
Experience in Faurecia’s core businesses |
|
Experience in an industrial company |
|
International experience |
|
Automotive technologies |
---|
|
Governance/management of large companies |
|
Specific knowledge of a geographic market |
|
Leadership and crisis management |
|
|
|
CSR |
|
Risk management |
|
Energy/electrification |
|
|
Valérie LANDON |
|
|
|||||
---|---|---|---|---|---|---|---|
|
Date of birth: August 17, 1962 |
|
Independent Board member |
||||
Nationality: |
|
|
|
|
Date of first appointment: |
October 12, 2017 |
|
Number of Faurecia shares: 650 |
|
Date of expiry of corporate office: |
GM in 2025 |
||||
Skills: |
|
Member of the Audit Committee |
|||||
|
|||||||
|
|||||||
Valérie Landon is Chief Executive Officer of Credit Suisse in France and Belgium. She began her career, as an engineer, with Air France in 1985. In 1990, she joined Credit Suisse as an investment banker. Before starting her current position as Chief Executive Officer of Credit Suisse in France and Belgium, she served in particular as Head of Investment Banking & Capital Markets for France, Belgium and Luxembourg. She is an engineering graduate from École Centrale de Paris. |
|
Main position held outside of Faurecia
Other positions and corporate offices in 2022 outside of Faurecia No such corporate office. Positions and corporate offices held within the last five years and which have expired
|
Jean-Bernard Lévy was until November 23, 2022, Chairman and Chief Executive Officer of EDF. He was a works engineer at the Angers Division of France Télécom in 1979, became responsible for managing executive managers and HR budgets at head office in 1982, and then deputy to the head of the HR department. In 1986, he was appointed Technical Advisor to the office of Gérard Longuet, Minister for Postal Services and Telecommunications. From 1988 to 1993, Jean-Bernard Lévy managed the Telecommunications Satellites business of Matra Espace, now Matra Marconi Space. From 1993 to 1994, he was the Chief of Staff to Gérard Longuet, Minister of Industry, Postal Services, Telecommunications and Foreign Trade. In 1995, he was appointed Chairman and Chief Executive Officer of Matra Communication. In 1998, he joined Oddo et Cie as Managing Director, then Managing Partner. In summer 2002, Jean-Bernard Lévy joined Vivendi. He served as its Chief Operating Officer until April 2005, and became Chairman of the Management Board and then Chief Executive Officer in April 2005, until June 2012. From December 2012 to November 2014, he was Chairman and Chief Executive Officer of the Thales defense and aerospace group. Jean-Bernard Lévy was EDF's Chairman and Chief Executive Officer of EDF from November 2014 to November 2022. Jean-Bernard Lévy is a graduate of the École Polytechnique and of Télécom Paris Tech. |
|
Main position held outside of Faurecia
Other positions and corporate offices in 2022 outside of Faurecia French listed companies
French unlisted companies
Foreign listed companies
Foreign unlisted companies
Other
Position and corporate office held within the last five years and which have expired
|
---|---|---|
(1) EDF Group. His corporate office as Chairman and Chief Executive Officer ended on November 23, 2022. (2) EDF Group The term of his corporate office ended on November 23, 2022. (3) EDF Group. The term of his corporate office ended on December 6, 2022. (4) The term of his corporate office ended on November 23, 2022. (5) The term of his corporate office ended on November 25, 2022. (6) The term of his corporate office ended on November 21, 2022. |
|
Experience in an industrial company |
|
International experience |
|
Governance/management of large companies |
|
Banking/finance |
---|
Yan MEI |
|
|
|||||
---|---|---|---|---|---|---|---|
|
Date of birth: July 12, 1955 |
|
Independent Board member |
||||
Nationality: |
|
|
|
|
Date of first appointment: |
May 28, 2019 |
|
Number of Faurecia shares: 542 |
|
Date of expiry of corporate office: |
GM in 2023 |
||||
Skills: |
|
|
|||||
|
|||||||
|
|||||||
Yan Mei is Senior Partner, Chair of China of Brunswick group (China) where she oversees Brunswick China activities and acts as a counselor to senior executives. She started her career as a journalist for ITN Channel 4 News, from 1988 to 1990. From 1991 to 2001, she worked as International Assignment Editor and later as the Head of China Desk at CNN (USA). From 2001 to 2005, she joined Turner International Asia Pacific as Vice President. From 2005 to 2009, she held the position of Chief Strategy Officer and Chief Representative at News Corp (Beijing). Before joining Brunswick group in 2013, she was Managing Director of MTV Networks Greater China and Chief Representative of Viacom Asia (Beijing). She holds a Master of Arts and Master Philosophy degree in International Relations and Political Science respectively from Columbia University in New-York, and a Master in Advanced Russian Area Studies from Hunter College at the City University of New York. She also holds a Bachelor of Arts degree in Russian Language and Literature from Beijing Normal University. |
|
Main position held outside of Faurecia
Other positions and corporate offices in 2022 outside of Faurecia French listed companies No such corporate office. French unlisted companies No such corporate office. Other foreign listed companies
Foreign unlisted companies No such corporate office. Other
Positions and corporate offices held within the last five years and which have expired - |
|
International experience |
|
Governance/management of large companies |
|
Specific knowledge of a geographic market |
Denis MERCIER |
|
|
|||||
---|---|---|---|---|---|---|---|
|
Date of birth: October 4, 1959 |
|
Independent Board member |
||||
Nationality: |
|
|
|
|
Date of first appointment: |
May 28, 2019 |
|
Number of Faurecia shares: 1,157 |
|
Date of expiry of corporate office: |
GM in 2023 |
||||
Skills: |
|
Chairman of the Compensation Committee |
|||||
|
|||||||
|
|||||||
Denis Mercier is Deputy Chief Executive Officer of Fives Group, member of the Executive Committee. He has held different positions within the French Air Force and NATO. After having been Commandant of the French Flying School at Salon-de-Provence (France) from 2008 to 2010, he became principal private secretary of the French Minister of Defense from 2010 to 2012. Between 2012 and 2015, he held the position of Chief of Staff of the French Air Force and was promoted to the rank of General of the Air Force. From 2015 to September 2018, he held the position of Supreme Allied Commander of Transformation at NATO. He joined the Fives Group in October 2018 as Deputy Chief Executive Officer. Denis Mercier is an engineer from the École de l’Air (class of 1979). He is a Grand Officier of the Légion d’honneur and an Officier de l’ordre national du Mérite. |
|
Main position held outside of Faurecia
Other positions and corporate offices in 2022 outside of Faurecia French listed companies No such corporate office. French unlisted companies
Other foreign listed companies No such corporate office. Foreign unlisted companies
Other
Positions and corporate offices held within the last five years and which have expired
|
|||||
(*) Company in which only the bonds are listed. |
|
Experience in an industrial company |
|
International experience |
|
Data based technologies/digital |
|
Leadership and crisis management |
Peter MERTENS |
|
|
|||||
---|---|---|---|---|---|---|---|
|
Date of birth: March 30, 1961 |
|
Independent Board member |
||||
Nationality:
|
|
|
|
|
Date of first appointment:
|
2019 GM (effective as from November 1, 2019) |
|
Number of Faurecia shares: 1,080 |
|
Date of expiry of corporate office: |
GM in 2023 |
||||
Skills: |
|
Member of the Compensation Committee |
|||||
|
|||||||
|
|||||||
Dr. Peter Mertens is a companies Board member. From 1985 to 1990, he oversaw the Department of technology transfer of Kaiserslautern University (Germany). In 1990, Dr. Peter Mertens held multiple management positions with Mercedes-Benz AG. He was then head of Tegaron Telematics GmbH, a joint venture between Daimler Chrysler Services AG and Deutsche Telekom AG, in 1996. In 2002, he joined Adam Opel AG as Executive Director for midsize and large product lines. In 2004, he became responsible for the compact product lines of General Motors Europe and, starting in 2005, for all compact product lines of General Motors worldwide. In 2010, Dr. Peter Mertens joined the Management Board of Jaguar Land Rover and managed the Corporate Quality for the entire Tata Motors group, including the Jaguar Land Rover brand. From March 2011 to May 2017, he assumed responsibility for research and development as Senior Vice President, Research and Development for the Volvo Car Group (Gothenburg, Sweden). He was an executive at Audi AG until October 31, 2019, after having served as Chief Technical Officer from May 2017 to October 2018. He studied Production Engineering at the Ostwestfalen-Lippe University of Applied Sciences, and in 1985 received a Master of Science in Industrial Engineering and Operations Research from the Virginia Polytechnic Institute (United States). He holds a Doctorate in Engineering (Dr. Ing.) from the University of Kaiserslautern (Germany). |
|
Main position held outside of Faurecia
Other positions and corporate offices in 2022 outside of Faurecia French listed companies No such corporate office. French unlisted companies No such corporate office. Other foreign listed companies
Foreign unlisted companies
Positions and corporate offices held within the last five years and which have expired
|
|
Experience in Faurecia’s core businesses |
|
Experience in an industrial company |
|
International experience |
|
Automotive technologies |
---|
|
Governance/management of large companies |
|
Specific knowledge of a geographic market |
|
Data based technologies/digital |
|
|
|
Leadership and crisis management |
|
Risk management |
|
Energy/electrification |
|
|
PEUGEOT 1810 with Robert PEUGEOT as permanent representative |
|
|
|
---|---|---|---|
French Société par actions simplifiée with a share capital of €1,531,905,966 |
|
Date of first appointment: |
May 31, 2021(*) |
Number of Faurecia shares held by PEUGEOT 1810: 6,110,494 |
|
Date of expiry of corporate office: |
GM in 2025 |
Corporate office: 66 avenue Charles de Gaulle 92200 Neuilly-sur-Seine |
|
Member of the Audit Committee |
|
Subsidiary of Peugeot Invest and Etablissements Peugeot Frères which purpose is to hold their historical participations in relation to the automotive sector. |
|
Main position held outside of Faurecia No other positions held. Other positions and corporate offices in 2022 outside of Faurecia No outside corporate offices held. Positions and corporate offices held within the last five years and which have expired
|
Robert PEUGEOT |
|
|
|||||
---|---|---|---|---|---|---|---|
|
Date of birth: April 25, 1950 |
|
Permanent representative of PEUGEOT 1810 |
||||
Nationality: |
|
|
|
|
Date of first appointment: |
May 29, 2007 |
|
Number of Faurecia shares held by Robert PEUGEOT: 694 |
|
Date of expiry of corporate office: |
GM in 2025 |
||||
Skills: |
|
Member of the Compensation Committee |
|||||
|
|||||||
|
|||||||
Robert Peugeot is Chairman of the Board of Directors of Peugeot Invest. He has held various senior positions within the PSA Group and was a member of its Executive Committee from 1998 to 2007, in charge of Innovation and Quality. He represented Peugeot Invest at Peugeot SA Supervisory Board until the merger between Peugeot SA and Fiat Chrysler Automobiles; since then, within Stellantis, the new entity resulting from the merger, he has held the positions of Vice-President and Board member. After being the Chairman and Chief Executive Officer of Peugeot Invest from 2002 to 2020, he is now Chairman of the Board of Directors. Robert Peugeot is a graduate of the École Centrale de Paris and of INSEAD. He was made Chevalier de l’ordre national du Mérite (2000) and a Chevalier de la Légion d’honneur (2010) by the French Government. |
|
Main position held outside of Faurecia
Other positions and corporate offices in 2022 outside of Faurecia Other French listed companies
French unlisted companies
|
|
Other foreign listed companies
Foreign unlisted companies
Positions and corporate offices held within the last five years and which have expired
|
|
Experience in Faurecia’s core businesses |
|
Experience in an industrial company |
|
International experience |
|
Automotive technologies |
---|
|
Governance/management of large companies |
|
Banking/finance |
|
Leadership and crisis management |
|
|
|
Risk management |
|
Energy/electrification |
|
|
|
|
Emmanuel PIOCHE |
|
|
|||||
---|---|---|---|---|---|---|---|
|
Date of birth: December 4, 1965 |
|
Board member representing employees |
||||
Nationality: |
|
|
|
|
Date of first appointment: |
November 1, 2017 |
|
Number of Faurecia shares: - (*) |
|
Date of expiry of corporate office: |
October 31, 2025 |
||||
Skills: |
|
Member of the Audit Committee |
|||||
|
|||||||
|
|||||||
Emmanuel Pioche has been Head of R&D Frames at Faurecia (Brières-les-Scellés site, France) since July 2017. Previously, he was a prototype maker in the R&D trimlab at the same site. He joined the Group in 1995 as a qualified prototypes agent. He held various employee representation offices from 1999 to 2017. He holds the professional title of thin-sheet metal worker, holds an Aerospace TIG heavy and light metal welding license, obtained a G2 Baccalaureate (management), and a level III programmer analyst’s diploma. |
|
Main position held outside of Faurecia No outside position held. Other positions and corporate offices in 2022 outside of Faurecia No such corporate office. Positions and corporate offices held within Faurecia group in the last five years and which have expired -
|
|||||
(*) Emmanuel PIOCHE participated in an employee shareholding plan carried out in 2021 and holds as such FCPE shares invested in Faurecia shares. |
|
Experience in Faurecia’s core businesses |
|
Experience in an industrial company |
|
Automotive technologies |
|
Leadership and crisis management |
---|
Michel de ROSEN |
|
|
|||||
---|---|---|---|---|---|---|---|
|
Date of birth: February 18, 1951 |
|
Independent Board member |
||||
Nationality: |
|
|
|
|
Date of first appointment: |
May 27, 2016 |
|
Number of Faurecia shares: 12,565 |
|
Date of expiry of corporate office: |
GM in 2024 |
||||
|
Chairman of the Board of Directors |
||||||
|
Date of appointment: |
May 30, 2017 |
|||||
Skills: |
|
Member of the Governance, Nominations and Sustainability Committee |
|||||
|
|||||||
|
|||||||
Michel de Rosen has been Chairman of the Board of Directors of Faurecia since May 30, 2017. He has successively held positions first as a senior public official and then as a senior executive in French and US companies. He was at the Inspectorate General of Finance (IGF), a division of the French Ministry of Finance. He was a policy officer in the office of the French Minister of Defense in 1980 and 1981 and served as Chief of Staff for the French Minister for Industry and Telecommunications from 1986 to 1988. Within the Rhône-Poulenc group, he served as Chief Executive Officer of Pharmuka from 1983 to 1986 and of Rhône-Poulenc Fibres et Polymères from 1988 to 1993, after which he was Chief Executive Officer and then Chairman and Chief Executive Officer of Rhône-Poulenc Rorer in the United States and in France and of Rhône-Poulenc Santé from 1993 to 1999. In 2000, Michel de Rosen was named Chairman and Chief Executive Officer of the US company ViroPharma. In 2008, he became Chairman and Chief Executive Officer of SGD. He joined Eutelsat in 2009. Michel de Rosen was Deputy Chief Executive Officer of Eutelsat and then Chief Executive Officer and Board member. From September 2013 to February 2016, he was Chairman and Chief Executive Officer. From March 2016 to November 2017, Michel de Rosen was the Chairman of the Board of Directors. He is a graduate of the École des Hautes Études Commerciales (HEC) and the École Nationale d’Administration (ENA). |
|
Main position held outside of Faurecia
Other positions and corporate offices in 2022 outside of Faurecia French listed companies
French unlisted companies No such corporate office. Other foreign listed companies No such corporate office. Foreign unlisted companies No such corporate office. Positions and corporate offices held within the last five years and which have expired
|
|||||
(*) His corporate office as Chairman of the Board of Directors ended on January 1, 2022 and his office as Board member ended in June 2022. |
|
Experience in an industrial company |
|
International experience |
|
Governance/management of large companies |
|
|
|
Specific knowledge of a geographic market |
|
Banking/finance |
|
Leadership and crisis management |
|
Risk management |
---|
3.1.2.3Changes in the composition of the Board of Directors and the Specialized Committees
During the past fiscal year and up to the date of publication of this Universal Registration Document, the following changes occurred in the composition of the Board of Directors and the Specialized Committees (permanent):
|
Departure |
Appointment |
Reappointment |
---|---|---|---|
Board of Directors |
N/A |
Judy CURRAN (Board Meeting of February 18, 2022 - ratification by the GM of June 1, 2022)
Jürgen BEHREND |
N/A |
Compensation Committee |
N/A |
N/A |
N/A |
Governance, Nominations and Sustainability Committee |
N/A |
N/A |
N/A |
Audit Committee |
N/A |
N/A |
N/A |
|
3.1.2.4.Governance structure and shareholder dialog
Separation of the positions of the Chairman of the Board of Directors and the Chief Executive Officer
In the context of a major change in its governance, since July 1, 2016, the positions of Chairman of the Board of Directors and Chief Executive Officer have been separated within the Company. The Board of Directors then reiterated, when the Chairman of the Board of Directors was reappointed with effect from June 26, 2020, that the best way to ensure the efficiency, balance, stability and visibility of governance was to maintain the current governance and collaboration between the Chairman of the Board and the Chief Executive Officer. The separation of duties remains in effect on the date of this Universal Registration Document.
Chairman of the Board of Directors
Michel de Rosen has been Chairman of the Board of Directors since May 30, 2017. His corporate office as Chairman of the Board of Directors, which expired after the General Meeting of June 26, 2020, was renewed for a period of four years.
Chief Executive Officer (CEO)
Patrick Koller has been Chief Executive Officer of Faurecia since July 1, 2016. He was appointed for an unlimited term. He has also been a member of the Company’s Board since May 30, 2017.
Role of the Chairman of the Board of Directors
The role of Chairman of the Board of Directors is defined in the internal rules of the Board of Directors, which are available on the governance page of the Company’s website (www.faurecia.com).
According to the internal rules, the Chairman of the Board of Directors organizes and directs the work of the Board of Directors and ensures the effective operation of the Board of Directors and its committees, in accordance with good governance principles.
- ■promote the highest standards of integrity, probity and corporate governance across the Group, particularly at Board level, thus ensuring the effectiveness thereof;
- ■manage the relations between Board members and the Chairs of the committees and, in this respect:
- ■promote effective working relations and open communication, and foster an environment that enables constructive discussions and the sharing of information between members of the Board of Directors and the Chief Executive Officer, during and outside meetings,
- ■lead and govern the Board so as to create the conditions required for the overall effectiveness of the Board of Directors and its members, and ensure that all key and relevant issues are adequately prepared and discussed by the Board of Directors and the various committees in a timely fashion,
- ■schedule and set the agenda of the Board meetings, in consultation with the Chief Executive Officer and the Secretary of the Board, to take full account of the Group’s major challenges and issues raised by Board members, and ensure that sufficient time is devoted to thoroughly discuss significant and strategic matters,
- ■address any conflicts of interest,
- ■conduct, with the assistance of the Governance, Nominations and Sustainability Committee, assessments of the Board of Directors, searches for new Board members and their induction program;
- ■organize, with the Chief Executive Officer and the Chairs of the various committees, the preparation and chairing of General Meetings, oversee relations and ensure effective communication with shareholders;
- ■manage relations with the Chief Executive Officer:
- ■act as a competent advisor for the Chief Executive Officer on all issues regarding the interests and management of the Company,
- ■ensure that the strategies and policies adopted by the Board are effectively implemented by the Chief Executive Officer; without prejudice to the prerogatives of the Board of Directors and its committees, the Chairman is regularly informed by the Chief Executive Officer about significant events concerning the Company’s strategy, in line with the objectives set by the Board of Directors, as well as about major external growth projects, significant financial transactions, societal actions, or appointments of Business Group managers and other key positions within the Company. The Chairman receives from the Chief Executive Officer all information necessary to coordinate the work of the Board of Directors and its committees;
- ■coordinate or conduct specific projects. In particular, at the request of the Chief Executive Officer, the Chairman may represent the Company before stakeholders, public authorities, financial institutions, major shareholders and/or key business partners.
In 2022, Michel de Rosen coordinated the work of the Board of Directors in accordance with the bylaws and the internal rules and prioritized the introduction of practices to improve the way in which the Board operates. He took an active role in the following:
- ■reviewing developments in governance related issues in order to take into account legislative and regulatory changes;
- ■managing the external assessment of the Board of Directors with respect to the 2021 fiscal year and developing the procedure put in place for the internal assessment of the Board of Directors with respect to the 2022 fiscal year;
- ■shareholder dialog (see below in the subsection dedicated to this topic);
- ■committee work and reviews and attendance at certain committee meetings;
- ■recruitment process for new Board members and, in general, reflections on the evolution of the Board of Directors and its composition, particularly with regard to the Group’s strategic operations and the consequences for governance;
- ■monitoring of the Group’s operations/strategic issues with the Chief Executive Officer, in particular the integration of HELLA and the implementation of the Group’s CSR approach.
Role of the Chief Executive Officer
The Chief Executive Officer is vested with the widest possible powers to act under all circumstances in the name of the Company. He exercises these powers within the limits imposed by the corporate purpose and subject to those explicitly attributed by law to General Meetings of shareholders and to the Board of Directors.
He represents the Company in relations with third parties. The Company even remains bound by actions taken by the Chief Executive Officer that are not within the scope of the corporate purpose, unless the Company establishes that the third party was aware that the action in question exceeded this scope or could not have been unaware of the fact given the circumstances, the simple publication of the bylaws not being sufficient proof.
The internal rules of the Board of Directors provide for limitations on the powers of the Chief Executive Officer. The Chief Executive Officer must therefore obtain approval from the Board of Directors before carrying out any acquisition, disposal, or joint venture project representing a total asset value of over €100 million and/or with sales in excess of €300 million. These internal rules also state that any material transaction which is not integrated in the Company’s current strategy plan will be submitted to the prior approval of the Board of Directors.
Shareholder dialog
The Group attaches particular importance to shareholder dialog, and has set up a specific structure based on three main areas, to respond to the questions, concerns and queries of shareholders (both institutional investors and individual shareholders), asset managers and voting advisory agencies:
- ■Dialog on financial performance and strategy: the Chief Financial Officer and his teams, under the responsibility of the Chief Executive Officer, issue communications on the performance of the past quarter or half at the end of each quarter, followed by telephone meetings or a meeting with analysts and investors. In addition to these regular events, throughout the year Faurecia encourages meetings between its Executive Management and financial market participants, at conferences and meetings (“financial roadshows”) in France and abroad, in the form of individual or Group meetings. Finally, the Group organizes each year an investors day (Capital Markets Day) to present the Group’s medium-term strategic vision, with the possibility to focus more specifically this day on specific topics. For more information on Faurecia’s relations with the financial community, please refer to Chapter 5 “Capital stock and shareholding structure”, Section 5.5 “Relations with the financial community”.
- ■Dialog on non-financial performance: the Sustainable Development and Carbon Neutrality teams meet and exchange views with investors or non-financial rating agencies on the Group’s CSR approach, based on the Group’s six convictions, and on specific action plans for the planet, the Group’s businesses and employees. The implementation of the Group’s approach, combined with dialog with non-financial rating agencies, made it possible to improve the Group’s non-financial rating by MSCI and Vigeo during the 2022 fiscal year. These CSR subjects may also be dealt with during governance roadshows, in the presence of the Chairman of the Board of Directors (see below). A Sustainability Day was held on November 4, 2022.
- ■Dialog on governance: the Chairman of the Board of Directors has discussions with the main institutional investors on governance issues. This dialogue was strengthened in 2022 with the acquisition of control of HELLA. In addition to these discussions, the Secretary of the Board of Directors and the legal teams hold meetings with the main institutional investors and the main voting advisory agencies prior to General Meetings, primarily to explain the resolutions that will be proposed to the General Meeting (these are known as “governance roadshows”). These meetings, in which the Chairman of the Board of Directors frequently participates, are distinct from the financial roadshows and also provide an opportunity to discuss governance, compensation, CSR and strategy. In 2022, discussions focused on (i) the evolution of the Combined Group’s governance, (ii) the compensation of the Chief Executive Officer and (iii) the deployment of the sustainable development approach, with a particular focus on the plan to achieve carbon neutrality as well as the actions taken to achieve it, including the SBTi net zero standard certification.
3.1.2.5.Diversity policy within the Board of Directors
Principles
The Group’s Board members come from a wide range of backgrounds and contribute a range of diverse but complementary skills to the Board of Directors. This wealth of diversity can also be found across the Board in terms of gender balance, range of nationalities and culture.
The Board of Directors, with the assistance of the Governance, Nominations and Sustainability Committee, ensures that a diversity policy is implemented within the Board, in accordance with the applicable regulations and the AFEP-MEDEF Code.
The purpose of the diversity policy put in place within the Board of Directors is to ensure in particular:
- ■a rate of Board member independence which is at least in line with the recommendations made in the AFEP-MEDEF Code;
- ■gender balance within the Board of Directors, with a ratio at least in line with the applicable law (at least 40%);
- ■employee representation on the Board of Directors, with a number of Board members representing employees at least in accordance with the applicable legal provisions;
- ■the need for Board members to have the necessary expertise and experience to carry out their duties successfully in line with the strategy and interests of the Group (regions, activities, etc.);
- ■the complementary nature of the skills required for the work of the Board of Directors;
- ■international diversity so as to reflect the Group’s global footprint;
- ■the respect of the bylaws' provisions in terms of age limit.
In order to evaluate the skills and profiles required for the membership of the Board of Directors, the Governance, Nominations and Sustainability Committee refers to a skills matrix (see below) and to the principles set out above, also taking into account the most appropriate size of the Board of Directors.
Implementation and results of the diversity policy within Faurecia’s Board of Directors
Skills
|
Experience in Faurecia’s core businesses |
|
Banking/finance |
|
Experience in an industrial company |
|
Data based technologies/digital |
|
International experience |
|
Leadership and crisis management |
|
Automotive technologies |
|
CSR |
|
Governance/management of large companies |
|
Risk management |
|
Specific knowledge of a geographic market |
|
Energy/electrification |
Independence
At December 31, 2022, the Board of Directors had nine independent Board members, representing 75% of its membership. This percentage is calculated excluding the directors representing employees, who are not taken into account for this calculation in accordance with the recommendations of the AFEP-MEDEF Code.
For more information on the independence analysis, please refer to Section 3.1.2.6. “Independence of members of the Board of Directors”.
Balanced representation of men and women
At December 31, 2022, the Board of Directors had five women members, representing 42% of its membership. This percentage is calculated excluding the Board members representing employees, who are not taken into account for this calculation in accordance with the applicable legal provisions.
This percentage is higher than that the one set by Article L. 22-10-3 of the French Commercial Code (40%).
Employee representation
At December 31, 2022, the Board of Directors had two Board members representing employees, in accordance with Article L. 225-27-1 of the French Commercial Code.
The Board members representing employees mainly contribute to the Board of Directors through their in-depth knowledge of the Group and of the operational aspects of its businesses.
International diversity
At December 31, 2022, the Board of Directors had six different nationalities (German, American (United States), British, Chinese, French and Portuguese).
Age and seniority
At December 31, 2022, the Board members were aged between 52 and 74 years, with an average age of 65 years. At that date, three Board members and the permanent representative of one Board member were over 70 years old. The average length of service on the Board of Directors is four years(1), ranging between nine months and seven years.
The composition of the Board of Directors complies with the statutory rules applicable to age limits.
Changes in the composition of the Board of Directors
As part of the acquisition of control of HELLA and the commitments made by Faurecia, the Hueck and Roepke family pool is now represented on the Board of Directors. Thus, on the proposal of the Governance, Nominations and Sustainability Committee and the Board of Directors, the General Meeting of June 1, 2022 appointed Jürgen Behrend as a non-independent director representing the Hueck and Roepke family pool for a term of office of four years. Jürgen Behrend’s experience in the automotive sector and in the governance of a listed company will strengthen the skills of the Board of Directors in these areas.
In addition, on the recommendation of the Governance, Nominations and Sustainability Committee and the Board of Directors, the General Meeting of June 1, 2022 also ratified the co-option of Judy Curran, as independent director, to replace Linda Hasenfratz, who resigned, for the remainder of the latter’s term of office, i.e., until the end of the General Meeting to be held in 2024 to approve the financial statements for the past fiscal year. Her long experience and expertise in the automotive industry strengthens the expertise of the Board of Directors in these areas as well as its diversity and independence.
3.1.2.6.Independence of members of the Board of Directors
In accordance with the AFEP-MEDEF Code, the Board of Directors, further to a recommendation from the Governance, Nominations and Sustainability Committee, examines the independence of each of its members at least once a year and whenever a new Board member is appointed.
The AFEP-MEDEF Code states that a Board member is independent when they have no relation of any kind whatsoever with the Company, its Group or its Management which might compromise the exercise of their free judgment.
In order to analyze the independence of its members, the Board of Directors applies the criteria provided for in the AFEP-MEDEF Code, as reflected in the internal rules of the Board of Directors, as follows:
- ■not be an employee or executive corporate officer of the Company; an employee, executive corporate officer or Board member of a company consolidated thereby; an employee, executive corporate officer or Board member of the parent company or of any company consolidated by this parent company, and, in each of the cases in question, has not been in the past five years (Criterion 1);
- ■not be an executive corporate officer of a company in which the Company directly or indirectly holds a corporate office as Board member or in which an employee appointed as such or an executive corporate officer of the Company (currently or who has held such an office less than five years ago) holds the corporate office of Board member (Criterion 2);
- ■not be a material client, supplier, corporate banker, investment banker, consultant of (i) the Company or its group with a significant importance; or (ii) for which the Company or its group represents a significant part of its business. This criterion is examined on the basis of a multi-criteria approach (Criterion 3);
- ■not have close family ties with a corporate officer (Criterion 4);
- ■not have been the Company’s Statutory Auditor in the past five years (Criterion 5);
- ■not have been a Company Board member for more than 12 years (Criterion 6).
The Chairman of the Board of Directors may not be considered as independent if he receives variable compensation or compensation in shares or any compensation linked to the performance of the Company or of the Faurecia group (Criterion 7).
Board members representing significant shareholders of the Company or of its parent company may be considered as independent when these shareholders are not involved in the control of the Company. However, beyond a threshold of 10% of the share capital or voting rights, the Board, further to a report by the Governance, Nominations and Sustainability Committee, systematically questions independence, taking into account the composition of the Company’s share capital and the existence of any potential conflicts of interest (Criterion 8).
At its meeting of February 17, 2023, on the recommendation of the Governance, Nominations and Sustainability Committee, the Board of Directors reviewed the status of each of the Board members in office on December 31, 2022 with regard to the criteria set out above.
It is specified that the criterion of business relationship was examined using a multi-criteria approach including a quantitative and qualitative analysis intended to assess the significance thereof. The analysis includes a review of the relationships, contracts, and partnerships existing between Faurecia and the company or group in which the Board member holds an executive function or corporate office. This review was carried out with the Group’s departments responsible for purchasing, sales, R&D, M&A and finance, and also on the basis of a specific questionnaire addressed to Board members including a section on conflicts of interest.
It would appear, from a quantitative point of view, that if the Faurecia group could purchase products and take advantage of services from companies or groups in which certain of its Board members, who may potentially be considered independent, held roles during the 2022 fiscal year, the amounts paid were determined under ordinary and normal conditions and did not represent significant amounts for these groups/companies.
These quantitative elements are therefore not such as to justify any suspicion as to the independence of the Board members.
In the context of this analysis, the Board of Directors examined from a qualitative point of view the nature and intensity of the business relationship (potential economic dependence and exclusivity, distribution of negotiating power) as well as the organization of the relationship (position of the relevant Board member within the contracting group, direct or indirect decision-making powers or influence on the business relationship, level on which decisions are made within the Group, and shareholding structure).
The Board of Directors, on the recommendation of the Governance, Nominations and Sustainability Committee, considered that nine of the Board members in office on February 17, 2023 are independent: Michel de Rosen, Judy Curran, Odile Desforges, Penelope Herscher, Valérie Landon, Jean-Bernard Lévy, Yan Mei, Denis Mercier and Peter Mertens, i.e. a rate of 75% (excluding Board members representing employees in accordance with the AFEP-MEDEF Code), which is higher than the percentage set by the AFEP-MEDEF Code.
- ■none of the above-mentioned independent Board members have any significant business relationship with the Group;
- ■if a conflict of interest were to arise, the rules for managing such conflicts provided for in the internal rules would apply (for details of these rules, see Section 3.1.3.1 “Organization of the Board of Directors”, paragraph “Board members’ obligations” below).
The results of the independence review of the Board members in office as of February 17, 2023 are set out in the summary table below:
Criteria |
|
|
|
|
|
|
|
|
|
|
|
|
|
|
---|---|---|---|---|---|---|---|---|---|---|---|---|---|---|
Criterion 1: employee and corporate officer over the course of the previous five years |
✘ |
✔ |
✔ |
✔ |
✘ |
✔ |
✔ |
✔ |
✔ |
✔ |
✘ |
✔ |
- |
- |
Criterion 2: cross-directorships |
✔ |
✔ |
✔ |
✔ |
✘(2) |
✔ |
✔ |
✔ |
✔ |
✔ |
✔ |
✔ |
- |
- |
Criterion 3: significant business relationship |
✔ |
✔ |
✔ |
✔ |
✔ |
✔ |
✔ |
✔ |
✔ |
✔ |
✘ |
✔ |
- |
- |
Criterion 4: family relationship |
✔ |
✔ |
✔ |
✔ |
✔ |
✔ |
✔ |
✔ |
✔ |
✔ |
✔ |
✔ |
- |
- |
Criterion 5: statutory auditor |
✔ |
✔ |
✔ |
✔ |
✔ |
✔ |
✔ |
✔ |
✔ |
✔ |
✔ |
✔ |
- |
- |
Criterion 6: term of office more than 12 years |
✔ |
✔ |
✔ |
✔ |
✔ |
✔ |
✔ |
✔ |
✔ |
✔ |
✘(3) |
✔ |
- |
- |
Criterion 7: status of executive and non-executive corporate officer |
✔ |
- |
- |
- |
- |
- |
- |
- |
- |
- |
- |
✔ |
- |
- |
Criterion 8: major shareholder status |
✔ |
✔ |
✔ |
✔ |
✔ |
✔ |
✔ |
✔ |
✔ |
✔ |
✔ |
✔ |
- |
- |
Independence of the Board member |
No |
Yes |
Yes |
Yes |
No |
Yes |
Yes |
Yes |
Yes |
Yes |
No |
Yes |
- |
- |
✔ means independence criterion met. ✘ means independence criterion not met. (1) In accordance with the AFEP-MEDEF Code, Board members representing employees are not included in the calculation of the percentage of independent Board members. (2) For the assesment of this criterion, the position of Patrick KOLLER as member of the Shareholder Committee of HELLA GmbH &Co KGaA was taken into account. (3) For the assessment of this criterion, the seniority of Robert PEUGEOT, permanent representative of PEUGEOT 1810, who was a Board Member of Faurecia in his own name for 14 years, was taken into account. |
3.1.3.Organization and functioning of the Board of Directors
The functioning of the Board of Directors is governed by the laws and regulations and by internal provisions, i.e. the bylaws and internal rules of the Board of Directors, most recently modified on June 24, 2022 and February 19, 2021 respectively.
- ■determine the mission of the Board and that of its committees;
- ■describe the role of the Chairman, the Chief Executive Officer and the Secretary of the Board;
- ■detail the rules and procedures for the Board’s operation and the rights and duties of its members.
The internal rules are available on the governance page of the Company’s website (www.faurecia.com).
3.1.3.1.Organization of the Board of Directors
Onboarding of new members and training
The Board of Directors pays particular attention to the onboarding of new Board members. To provide the Board members with optimal conditions for the performance of their corporate office, an induction program has been put in place to present the Group, regarding organizational, functional, and governance matters. In particular, this program includes an operational section aimed at providing an understanding of the Group’s business and products via visits to sites and plants in various parts of the world. These visits are completed by meetings with members of the Executive Committee, during which the organization of the Group, its business, and the challenges it faces are presented. The program also includes training provided by the Secretary of the Board of Directors on subjects related to the governance of listed companies, and more specifically on Faurecia’s governance.
When appointed or at any time during their term of corporate office, Board members may also take advantage, if they consider it necessary, of additional training on specific aspects relating to the Group, its core businesses and business sector, and the challenges in terms of social and environmental responsibility.
The Board members representing employees also benefit from a training system adapted to the exercise of their corporate office representing at least 40 hours per year, the precise content of which is agreed with the Chairman of the Board of Directors.
Number of meetings and duration
The internal rules state that the Board of Directors must meet at least four times per year, as provided by the bylaws, to discuss the agenda items listed by the Chairman. The Board of Directors meets at least once per year without the Chief Executive Officer in attendance to assess the performance of the said officer and discuss governance issues (executive session).
In practice, executive sessions are held at the beginning of each regular Board of Directors meeting with all Board members present (including the Board members representing employees), with the exception of the Chief Executive Officer (also a Board member) and any members of the management team.
Sufficient time must be devoted during each Board meeting to usefully and thoroughly discuss the agenda items.
Information
The Chairman, assisted by the Secretary of the Board of Directors, is responsible for communicating the information and documents required for the Board meetings to the Board members in a timely manner. Outside their meetings, Board members receive from the Chairman important or urgent information relevant to the Company and the Group. They also receive press releases distributed by the Company.
Any additional information or document requested by a Board member is automatically communicated to all other Board members.
Such information and documents may be provided during a Board meeting should privacy or timeliness considerations so require.
Representation
In accordance with the law, a Board member may specifically designate another Board member to represent him/her at Board meetings.
The internal rules also state that attendance at Board meetings is also possible via videoconferencing or other means of telecommunication, in particular to allow for the actual participation of Board members who are unable to attend meetings in person. Board members using these methods are considered present for the purpose of the calculation of the quorum and the majority.
The foregoing provisions relating to representation by means of videoconferencing or telecommunication are not applicable for the adoption of decisions relating to the preparation of the annual parent company financial statement and consolidated financial statements as well as the management report of the Company and the Group.
Quorum and majority
The Board validly deliberates if at least half of its members attend the Meeting (in person or by videoconferencing or any other means of telecommunication) or is represented.
Decisions are adopted on the basis of a majority of those members in attendance (or deemed to be in attendance, as in the case of the use of videoconferencing or other means of telecommunication) or represented. The Chairman of the Meeting has a casting vote.
Board members’ obligations
The internal rules impose certain obligations on members of the Board with the aim to mainly ensure that they are familiar with the provisions that apply to them, avoid conflicts of interest, guarantee that they devote the time and attention needed to perform their duties and that they comply with the rules that apply to holding several corporate offices as well as related-party agreements.
To properly manage conflicts of interest, each Board member must inform the Board of Directors of any temporary, even if it is only potential, conflicts of interest and abstain from voting in the corresponding deliberation and attending the Board’s meetings for the period during which the said Board member has a conflict of interest, or even resign from the position as a Board member. If these rules calling for the Board member to abstain or even withdraw are not followed, the said Board member could be held liable. In case of conflict of interest, the Board member concerned will not receive documentation relating to the Board meeting(s) in question.
Regarding information, Board members must request information that they believe is necessary to fulfill their assignments and to allow them to make informed decisions on the topics covered by the Board of Directors. Concerning non-public information obtained during the course of their work, they must act as though they are bound to a confidentiality obligation, which goes beyond the mere duty of discretion provided for by law, and not share this information with a third party outside the Board of Directors. In addition, European Regulation 2157/2001 on European Companies stipulates that even after the termination of their duties, Board members are required not to disclose any information they have about the Company, the disclosure of which could be prejudicial to the Company’s interests, except in cases where such disclosure is required or permitted by the provisions of national law.
The internal rules also stipulate that Board members must act in the Company’s best interest and participate in Board of Directors’ meetings as well as the committee on which the Board member sits.
Finally, these obligations relate to the holding of a minimum number of Company shares (this obligation does not apply to Board members representing employees), their holding method and compliance with the rules applicable to securities transactions and shareholding (see Section 3.5 “Shareholding by corporate officers and transactions in the Company’s securities” of this Universal Registration Document).
Specialized Committees
To optimize its discussions, the Board of Directors set up Specialized Committees which have a purely internal role in preparing some of the Board’s deliberations. They issue proposals, opinions and recommendations within their field of competence. Each Specialized Committee has its own internal rules approved by the Board of Directors which sets its composition, membership rules and operating procedures, and specific roles.
The committees report on their work to the Board of Directors after each meeting and perform a self-assessment of their activities on an annual basis.
As of the date of this Universal Registration Document, the Board of Directors has three permanent Specialized Committees:
- ■the Audit Committee;
- ■the Governance, Nominations and Sustainability Committee;
- ■the Compensation Committee.
In 2022, the Board of Directors also set up, on the proposal of the Governance, Nominations and Sustainability Committee, an ad hoc Committee in charge of the succession plan for the Chairman of the Board of Directors.
Information on the composition, missions and activity of the permanent Specialized Committees and of the ad hoc Committee are detailed in Section 3.1.4 “Specialized Committees of the Board of Directors”.
3.1.3.2.Number of meetings of the Board of Directors and of the Specialized Committees and attendance rates
The Board of Directors met 11 times in fiscal year 2022, including five times on an “extraordinary” basis, notably in connection with the proposed acquisition of HELLA and its refinancing. The average length of meetings of the Board of Directors was three hours and 45 minutes. Attendance at these meetings, by Board members and overall, is indicated in the table below.
In addition, five executive sessions (sessions without the presence of the management team including the Chief Executive Officer) were held in 2022.
The Audit Committee met eight times, the Governance, Nominations and Sustainability Committee met five times and the Compensation Committee met seven times in 2022, i.e. a total of 20 meetings. The Committee meetings lasted between one hour and four and a half hours.
Lastly, the ad hoc Committee, a specialized committee in charge of the succession plan for the Chairman of the Board of Directors, met twice and its meetings lasted approximately one hour.
The intervals and frequency of the meetings of the Board of Directors and Specialized (permanent and temporary) Committees allow for the submitted topics to be thoroughly discussed and examined.
The table below indicates, for each Board member, attendance during the 2022 fiscal year at meetings of the Board of Directors and of any Specialized Committees of which they are a member.
|
Attendance at Board meetings |
Attendance at meetings of the Audit Committee |
Attendance at meetings of the Governance, Nominations and Sustainability Committee |
Attendance at meetings of the Compensation Committee |
Attendance at meetings of the ad hoc Committee |
---|---|---|---|---|---|
Michel de ROSEN |
100% |
n/a |
100% |
n/a |
100% |
Jürgen BEHREND (1) |
86% (1) |
n/a |
n/a |
n/a |
n/a |
Daniel BERNARDINO |
100% |
n/a |
n/a |
100% |
n/a |
Judy CURRAN (2) |
100% |
n/a |
n/a |
n/a |
n/a |
Odile DESFORGES |
100% |
100% |
n/a |
n/a |
100% |
Penelope HERSCHER |
100% |
n/a |
100% |
n/a |
100% |
Patrick KOLLER |
100% |
n/a |
n/a |
n/a |
n/a |
Valérie LANDON |
100% |
100% |
n/a |
n/a |
n/a |
Jean-Bernard LÉVY |
100% |
n/a |
100% |
n/a |
n/a |
Yan MEI |
91% (3) |
n/a |
n/a |
n/a |
n/a |
Denis MERCIER |
100% |
n/a |
n/a |
100% |
100% |
Peter MERTENS |
100% |
n/a |
n/a |
100% |
n/a |
PEUGEOT 1810 / Robert PEUGEOT |
91% (3) |
100% |
n/a |
n/a |
100% |
Emmanuel PIOCHE |
100% |
100% |
n/a |
n/a |
n/a |
Total |
98% (3) |
100% |
100% |
100% |
100% |
n/a : not applicable. (1) Only the meetings held after the General Meeting of June 1, 2022 that approved the appointment of Jürgen BEHREND are taken into account for the calculation of his attendance. (2) The Board of Directors, on the recommendation of the Governance, Nominations and Sustainability Committee, decided, at its meeting of February 18, 2022, to coopt Judy CURRAN as a Board member to replace Linda HASENFRATZ, with immediate effect. Only meetings held after her co-option are taken into account for the calculation of her attendance rate. (3) Percentage rounded to the nearest integer. |
3.1.3.3.Roles and responsibilities of the Board of Directors and report on its business
The Board of Directors is a collective body that determines Faurecia’s business strategy and oversees its implementation, in accordance with the corporate purpose, taking the social and environmental challenges created by its business into consideration. Subject to the powers explicitly attributed to shareholder’s meetings and within the limits of the business purpose, the Board considers any questions affecting the proper operation of the Company, and Board decisions settle matters concerning it. It is consulted on all Company and Group strategic decisions at the Chairman's initiative.
The main missions of the Board described in the internal rules, as well as the main points of its 2022 Activity report, are described in the table below. The Board of Directors’ activity in 2022 was strongly marked, on the one hand, by the finalization of the acquisition of control of HELLA, its refinancing as well as the implementation of governance and the monitoring of synergies, and on the other hand, by the consequences of macroeconomic events and their impact on the automotive sector (in particular the semiconductor crisis, inflation, the continued lockdowns in China related to Covid-19 and the war in Ukraine).
Topics |
Missions |
2022 Activity report |
---|---|---|
General/ |
|
|
Financial statements and relations with Statutory Auditors |
|
|
Budget and planning |
|
|
Financial position, financing and security issues |
|
|
Internal control and risk management |
|
|
Compensation |
|
|
Governance |
|
|
General Meeting |
|
|
Other points |
|
|
3.1.4.Specialized Committees of the Board of Directors
The Board of Directors has decided to set up three Specialized (permanent) Committees: the Audit Committee, the Governance, Nominations and Sustainability Committee and the Compensation Committee.
Each Committee has internal rules which define its composition, tasks and detailed operating methods. These internal rules are available on the governance page of the Company’s website (www.faurecia.com).
The Committees study and prepare some of the Board’s deliberations. They issue proposals, opinions and recommendations within their field of competence. The committees have an advisory role only and act under the authority of the Board of Directors, to which they report whenever necessary and for which they cannot serve as a substitute.
The composition of the Committees is decided by the Board, and it can change the composition at any time. The term of office of committee members is the same as that of their term of office as Board members. The Committee member’s term of office may be renewed at the same time as their term of office as Board member.
Each Committee is chaired by a Board member appointed to the Committee by the Board of Directors, it being specified that only independent Board members may chair the Compensation Committee and the Governance, Nominations and Sustainability Committee. It is specified that the appointment or reappointment of the Chairman of the Audit Committee, proposed by the Governance, Nominations and Sustainability Committee, is subject to special review by the Board.
The Committees may also call on external experts, as necessary, ensuring that they have the necessary skills and independence.
In 2022, on the proposal of the Governance, Nominations and Sustainability Committee, the Board of Directors decided to set up an ad hoc (temporary) Committee in charge of the succession plan for the Chairman of the Board of Directors.
The composition and key figures of the Specialized Committees at December 31, 2022 (unless otherwise indicated), are as follows:
|
Audit Committee 4 members, Key figures 8 meetings Attendance rate of 100% |
|
|
Governance, Nominations and Sustainability Committee 3 members, Key figures 5 meetings Attendance rate of 100% |
---|---|---|---|---|
|
Compensation Committee 3 members, Key figures 7 meetings Attendance rate of 100% |
|
|
Ad hoc Committee 5 members, Key figures 2 meetings Attendance rate of 100% |
(1) In accordance with the AFEP-MEDEF Code, Board members representing employees are not included in the calculation of the percentage of independent Board members. (2) Board members representing employees. (P) Chairman/Chairwoman. |
3.1.4.1.Audit Committee
3.1.4.1.1. COMPOSITION OF THE AUDIT COMMITTEE
The Committee is composed of at least three members and no more than five members and at least two thirds of its members must be independent Board members. Members are selected from among the Board members. The Committee may only be composed of members of Faurecia’s Board of Directors who are not executives. It must also not include Board members with cross-directorships (within the meaning of Article 15.1 of the AFEP-MEDEF Code).
- ■Odile Desforges, independent Board member, Chairwoman;
- ■Valérie Landon, independent Board member;
- ■Robert Peugeot, as permanent representative of Peugeot 1810, Board member;
- ■Emmanuel Pioche, Board member representing employees.
All Board members appointed by the General Meeting who are members of the Audit Committee have expertise in financial and accounting matters, as can be seen from the biographies in Section 3.1.2.2 “Board members’ expertise, positions and corporate offices as of the date of this Universal Registration Document”.
The composition of the Committee, as described above, complies with the two-thirds threshold of independence recommended by the AFEP-MEDEF Code as reflected in the Committee’s internal rules.
3.1.4.1.2. Missions and activity report of the Audit Committee in 2022
In 2022, the Audit Committee met eight times with an average attendance rate of 100% (see Section 3.1.3.2 “Number of meetings of the Board of Directors and of the Specialized Committees and attendance rates” (which presents the attendance rate of each member of the Audit Committee at the meetings of this Committee). The Statutory Auditors were present and, where applicable, heard at five of these meetings.
The missions assigned to the Committee, as well as the main points of its Activity report in 2022, strongly marked by the review of the refinancing of the acquisition of HELLA as well as the consequences generated by the global economic context, are described in the table below:
Topics |
Missions |
2022 Activity report |
---|---|---|
Audit of financial statements |
|
|
Relationship with Statutory Auditors |
|
|
Internal control and risk management |
|
|
Budget and planning |
|
|
Financial position, financing and security issues |
|
|
Other |
|
|
3.1.4.2.Governance, Nominations and Sustainability Committee
3.1.4.2.1. Composition of the Governance, Nominations and Sustainability Committee
The Committee is composed of at least three members and no more than five members. Members are selected from among the Board members. The Committee should not include any executive corporate officer or Board members with cross-directorships (within the meaning of Article 15.1 of the AFEP-MEDEF Code) and must have a majority of independent Board members, including the Board’s Chairman.
At December 31, 2022, the Governance, Nominations and Sustainability Committee was composed of the following three members:
- ■Jean-Bernard Lévy, independent Board member, Chairman;
- ■Penelope Herscher, independent Board member;
- ■Michel de Rosen, independent Board member.
As the Committee is comprised of three independent Board members, including its Chairman, its composition is compliant with the AFEP-MEDEF Code.
3.1.4.2.2. MISSIONS AND ACTIVITY REPORT OF THE COMMITTEE IN 2022
In 2022, the Committee met five times with an attendance rate of 100% (see Section 3.1.3.2. “Number of meetings of the Board of Directors and of the Specialized Committees and attendance rates” which presents the attendance rate of each Committee member at its meetings).
The table below describes the tasks assigned to the Committee, as well as the main points of its 2022 activity report:
Topics |
Missions |
2022 Activity report |
---|---|---|
Governance structure |
|
|
Selection, nomination, and succession of executive and non-executive corporate officers and Board members/Selection and succession of members of the Executive Committee |
|
|
Ethics and compliance |
|
|
Social and environmental responsibility (CSR) |
|
|
Other |
|
|
3.1.4.3.Compensation Committee
3.1.4.3.1. Composition of the Compensation Committee
The Committee is composed of at least three members and no more than five members. Members are selected from among the Board members. The Committee should not include any executive corporate officer or Board members with cross-directorships (within the meaning of Article 15.1 of the AFEP-MEDEF Code) and must have a majority of independent Board members, including the Board’s Chairman.
- ■Denis Mercier, independent Board member, Chairman;
- ■Daniel Bernardino, Board member representing employees;
- ■Peter Mertens, independent Board member.
As the Committee is comprised of two independent Board members, including the Chairman, and a Board member representing employees, its composition is compliant with the AFEP-MEDEF Code. In accordance with the AFEP-MEDEF Code, the Board member representing employees is not taken into account when calculating the percentage of independence within Committees.
3.1.4.3.2. Missions and activity report of the Compensation Committee in 2022
In 2022, the Compensation Committee met seven times with an attendance rate of 100% (see Section 3.1.3.2. “Number of meetings of the Board of Directors and of the Specialized Committees and attendance rates” which presents the attendance rate of each member of the Compensation Committee at the meetings of this Committee).
The table below describes the tasks assigned to the Committee, as well as the main points of its 2022 Activity report:
Topics |
Missions |
2022 Activity report |
---|---|---|
Compensation of executive and non-executive corporate officers |
|
|
Board members’ compensation |
|
|
Long-term compensation policy (long term incentive plans) |
|
|
Performance and compensation of the Faurecia group’s main senior executives (other than executive corporate officers) |
|
|
Other |
|
|
3.1.4.4.Ad hoc Committee
3.1.4.4.1. Composition of the ad hoc Committee
When setting up an ad hoc Committee in charge of drawing up the succession plan for the Chairman of the Board of Directors, particular importance was given to the independence, diversity and complementarity of the profiles required to sit on this temporary body.
- ■Michel de Rosen, independent Board member, Chairman;
- ■Odile Desforges, independent Board member;
- ■Penelope Herscher, independent Board member;
- ■Denis Mercier, independent Board member; and
- ■Robert Peugeot, as permanent representative of Peugeot 1810, Board member.
This ad hoc Committee has four independent Board members. The complementarity of the profiles of the members of the ad hoc Committee and their recognized experience in corporate governance will enable the Committee to fulfill its mission of advising the Board of Directors.
3.1.4.4.2. Missions and activity report of the ad hoc Committee in 2022
In 2022, the ad hoc Committee met twice, with an average attendance rate of 100% (see Section 3.1.3.2 “Number of meetings of the Board of Directors and of the Specialized Committees and attendance rates” which presents the attendance rate of each member of the Committee at meetings.)
The table below describes the tasks assigned to the Committee, as well as the main points of its 2022 Activity report:
Topics |
Missions |
2022 Activity report |
---|---|---|
Succession plan |
|
|
3.1.5.Assessment of the Board of Directors and the Specialized Committees
In order to assess its capacity to meet the expectations of the shareholders, the Board of Directors carries out each year a formalized assessment of its composition, organization and functioning of the Board of Directors and its Specialized Committees. Every three years, this assessment is carried out with the assistance of an external firm.
As the last external assessment was carried out in respect of the 2021 fiscal year, the assessment of the Board of Directors for the 2022 fiscal year was carried out internally on the basis of a detailed questionnaire prepared by the Secretary to the Board of Directors and reviewed by the Governance, Nominations and Sustainability Committee, then approved by the Board of Directors, on the recommendation of the said Committee.
This questionnaire deals in particular with the functioning, structure, governance, composition and missions of the Board and the Specialized Committees, as well as the methods of organization and conduct of meetings, information for Board members, topics dealt with, the contribution of the Board members, the quality of the discussions and the implementation of the recommendations of the previous assessment.
The questionnaire was sent to the Board members and their responses were summarized by the Secretary to the Board of Directors. The summary of the assessment was reviewed by the Governance, Nominations and Sustainability Committee at a meeting held on February 15, 2023 and then presented and discussed at the Board of Directors meeting held on February 17, 2023.
It results from this assessment that Board members are, generally speaking, satisfied with the organization and operation of the Board of Directors and its committees, thanks to a governance structure tailored to the Company’s needs, to the quality of the relationships and exchanges between the Chairman of the Board, the Chief Executive Officer and the Board members as well as to the composition of the government bodies.
- ■The improvement measures identified by the Board of Directors during its last assessment which were implemented in 2022 are the following:
- ■improvement of the presentation of the documentation (including more executive summaries);
- ■reduction of the number of items on the agenda of meetings/seminars dedicated to strategy in order to promote in-depth discussion on strategic issues and more generally increase exchanges with key executive managers; and
- ■more in-depth review by the Board of directors of certain matters (in particular review of risks assesments and controls).
- ■The areas for improvement identified and to be continued are notably the following:
- ■in terms of organisation of the works of the Board of Directors, efforts undertaken must be continued with respect to (i) reducing the time for presentation (limited to executive summaries) in order to allow in-depth discussions including with key executive managers, (ii) providing more reporting to the Board of Directors about the works of the Committees, and (ii) reinforced review of certain matters during Board of directors meetings (in particular regarding review of risks and HR matters);
- ■in terms of integration of new Board members, the induction programs should be reinitiated as well as informal meetings and events reorganized now that health conditions allow it.
3.2.Operational management of the Group
In addition to General Management, the information about which is given in Section 3.1.2.4 “Governance structure and shareholder dialog”, the Group has an Executive Committee and is also supported by Group Leadership Committee (top 300). The diversity policy within the governing bodies is described in Chapter 4 “Extra-financial performance”, Section 4.4.2 “Diversity & Inclusion” of this Universal Registration Document.
As mentioned in Section 4.4.2 of this Universal Registration Document, Faurecia has set itself the goal of boosting the recruitment and internal promotion of women in order to increase the presence of women among engineers and executives and in the Group top management with targets at 24% in 2025 and at 30% in 2030 of women in the Group Leadership Committee (top 300). As at December 31, 2022, the TOP 300 leaders comprised 23% women (compared to 21% in 2021) evidencing a strong feminization dynamic in the top management. The feminization of the Group Leadership Committee (top 300), in particular by the 2030 horizon, allows to build the necessary “reservoir”, in order to accelerate the gender balance in the Executive Committee (given that the majority of the Executive Committee’s members comes from the Group Leadership Committee (top 300).
In this context, Faurecia has notably implemented ambitious actions and initiatives described in Section 4.4.2 of this Universal Registration Document, in particular, in terms of hiring, training and promotion of female talents. In 2023, the Group will continue its efforts in terms of the promotion of female talent, notably by implementing a new program referred to as “RISE” in favor of about 40 identified female talents (who may occupy top leaders positions, including Executive Committee member). This nine-month program includes collective coaching sessions, co-development exercises and networking events. It is overseen by four members of the Executive Committee, including the Chief Executive Officer. By developing female talent at the highest level, the Group wishes to develop a more inclusive management, allowing female potential to be developed in turn by these role models.
In addition, it is to be noted that recent performance share plans for the Group Leadership Committee (top 300) include an internal condition relating to gender balance, therefore supporting actions in favor of the feminization of top management.
Finally, the Board of Directors carries out, on an annual basis, a review of the succession plan of the Executive Committee (with a special attention to the percentage of women in the succession plan) and a specific review of the Group diversity policy.
3.2.1.Executive Committee
The Faurecia group’s Executive Management is provided, under the responsibility of the Chief Executive Officer, by an Executive Committee which meets at least once a month to review the Group’s results and deliberate on general Group issues, or as often as the interests of the Company require.
Composition of the Executive Committee Patrick KOLLER Victoria CHANIAL Nolwenn DELAUNAY Olivier DURAND Nik ENDRUD Frank HUBER Olivier LEFEBVRE Jean-Paul MICHEL Christopher MOKWA Thorsetn MUSCHAL Christophe SCHMITT Jean-Pierre SOUNILLAC François TARDIF |
The table below presents key figures on the composition of the Executive Committee as of January 2, 2023:
3.2.2. Group Leadership Committee
Each of the four Business Groups is organized into geographic divisions (Europe, North America, South America or China) which manage operations in their region and also coordinate operations with customers headquartered in their region.
The four Business Groups also have a central staff that handles the main operational functions (sales and marketing, programs, manufacturing support, purchasing, quality, human resources and finance). These functions are also deployed within the geographic divisions by equivalent teams. Additionally, some business are organized in worldwide product lines within the four businesses, such as seat mechanisms.
3.3.Compensation of corporate officers
3.3.1.Compensation of executive corporate officers for the 2021 and 2022 fiscal years
The Board of Directors, further to a proposal from the Compensation Committee, sets the compensation for executive and non-executive corporate officers in accordance with the applicable legal provisions and the compensation policy.
3.3.1.1.Compensation of the Chairman of the Board of Directors
3.3.1.1.1.Reminder of the principles of the 2022 compensation policy
The compensation policy setting the structure as well as the principles and criteria defined in order to determine the compensation and all benefits granted to the Chairman of the Board of Directors for the fiscal year ended December 31, 2022, which was 99.60% approved at the Company’s General Meeting held on June 1, 2022 pursuant to the 11th resolution, is set out in the Company’s 2021 Universal Registration Document, in Section 3.3.4.1 “Compensation policy for corporate officers”, and more specifically in Section 3.3.4.1.2. “Compensation policy for the Chairman of the Board of Directors”.
It should be noted that, in a summarized form, as in previous years, the 2022 compensation policy for the Chairman of the Board of Directors provided for fixed compensation, benefits in kind and social protection schemes.
The Chairman of the Board of Directors’ compensation, for the 2021 and 2022 fiscal years, as described below, complies with the compensation policy approved by the shareholders. It reflects the willingness of the Company to put in place a compensation system that is simple, stable, and compliant with market practices as presented to the shareholders.
3.3.1.1.2.Compensation paid during the 2022 fiscal year or granted for the same fiscal year
3.3.1.1.2.1. Fixed annual compensation
On February 18, 2022, the Board of Directors resolved to maintain the fixed annual compensation paid to the Chairman of the Board of Directors at €300,000. This has remained unchanged since 2017.
The fixed annual compensation of the Chairman of the Board of Directors, net of benefits in kind related to the provision of an assistant for his/her activities other than those relating to the chairmanship of Faurecia, amounted to €265,200 (excluding benefits in kind and social protection described thereafter). It was paid in full in 2022.
3.3.1.1.2.2. Benefits in kind and social protection
In addition to the provision of a personal assistant for activities other than those related to the chairmanship of Faurecia for an amount valued at €34,800, which is included in the above-mentioned €300,000 ceiling, the Chairman of the Board of Directors was provided with a company car. This benefit is valued at €6,624.
It is finally specified that the Company paid €4,692 in consideration of the supplementary health/life/disability pension scheme.
3.3.1.1.2.3. Other components of compensation
With the exception of the components described above, the Chairman of the Board of Directors did not receive any other compensation (including compensation for his duties as Board member), including by a company comprised in the scope of consolidation of the Company within the meaning of Article L. 233-16 of the French Commercial Code.
3.3.1.1.3.Compensation paid during the 2021 and 2022 fiscal years or granted for the same fiscal years
The tables below present the compensation and benefits paid during the 2021 and 2022 fiscal years or granted for these fiscal years to the Chairman of the Board of Directors.
It is stipulated that, since the Chairman of the Board of Directors receives only fixed compensation as well as benefits in kind and has social protection schemes, to the exclusion of any other compensation, tables No. 4 to No. 7 provided for by the AFEP-MEDEF Code and AMF recommendation No. 2021-02 are not applicable. The same applies to table No. 10 provided for by the AFEP-MEDEF Code.
Summary of compensation and options and shares granted to Michel de Rosen
Table No. 1 (AFEP-MEDEF Code and AMF recommendation No. 2021-02)
(in €) |
2021 fiscal year |
2022 fiscal year |
---|---|---|
Compensation granted for the fiscal year (see table No. 2) |
310,070 |
311,316 |
Value of stock options granted during the fiscal year |
- |
- |
Value of performance shares granted during the fiscal year |
- |
- |
Value of other long-term compensation plans |
- |
- |
Total |
310,070 |
311,316 |
Summary of compensation payable to Michel de Rosen
Table No. 2 (AFEP-MEDEF Code and AMF recommendation No. 2021-02)
(gross in €) |
2021 fiscal year |
2022 fiscal year |
||
---|---|---|---|---|
Amount granted |
Amount paid |
Amount granted |
Amount paid |
|
Fixed compensation |
265,200 |
265,200 |
265,200 |
265,200 |
Annual variable compensation |
- |
- |
- |
- |
Multi-annual variable compensation |
- |
- |
- |
- |
Exceptional compensation |
- |
- |
- |
- |
Compensation awarded as a Board member |
|
- |
- |
- |
Benefits in kind(1) |
44,870 |
44,870 |
46,116 |
46,116 |
Total |
310,070 |
310,070 |
311,316 |
311,316 |
(1) This figure includes the provision of an assistant, the provision of a vehicle (5,393 euros for the 2021 fiscal year and 6,624 euros for the 2022 fiscal year) and also social protection (4,677 euros for the 2021 fiscal year and 4,692 euros for the 2022 fiscal year). |
Table No. 11 (AFEP-MEDEF Code and AMF recommendation No. 2021-02)
|
Employment contract |
Supplementary pension scheme |
Compensation or benefits due or that may be due on termination or change in position |
Compensation due under a non-competition clause |
||||
---|---|---|---|---|---|---|---|---|
Yes |
No |
Yes |
No |
Yes |
No |
Yes |
No |
|
Name: Michel de ROSEN Position: Chairman of the Board of Directors since May 30, 2017 Corporate office end date: 2024 GM |
|
No |
|
No |
|
No |
|
No |
3.3.1.2.Compensation of the Chief Executive Officer
3.3.1.2.1.Reminder of the principles of the 2022 compensation policy
The compensation policy setting the structure as well as the principles and criteria established to determine the compensation and benefits of any kind granted to the Chief Executive Officer for the fiscal year ended on December 31, 2022, which was 85.19% approved by the Company’s General Meeting of June 1, 2022 in the 12th resolution, appears in the Company’s 2021 Universal Registration Document in Section 3.3.4.1 “Compensation policy for corporate officers”, and more specifically in Section 3.3.4.1.3. “Compensation policy for the Chief Executive Officer”.
The compensation policy for the Chief Executive Officer for 2022 therefore provided for the following:
- ■a fixed annual compensation;
- ■a variable annual compensation, subject to performance conditions and representing up to a maximum of 180% of the fixed annual compensation;
- ■a long term compensation in the form of free share allocations subject to presence and performance conditions;
- ■termination payment;
- ■an indemnity in return for a non-compete commitment;
- ■a notice period and a non-poaching/non-solicitation commitment;
- ■additional defined contributions and benefits pension schemes;
- ■benefits in kind and social protection;
- ■compensation for his duties in the Shareholder Committee of HELLA.
The Chief Executive Officer’s compensation for the 2021 and 2022 fiscal years, as described below, is compliant with the compensation policy as approved by the shareholders. It reflects the Company’s will to elaborate a compensation system which is legible, competitive and that predominantly includes clear and precise performance criteria relating to the implementation of the strategy, the fulfillment of which is beneficial to all stakeholders.
3.3.1.2.2.Compensation paid during the 2022 fiscal year or granted for the same fiscal year
Compensation of the Chief Executive Officer in 2022
The 2022 fiscal year was marked by the transformation of the Group through the financial consolidation of HELLA. Although the economic context remained tense in 2022 in the automotive sector, and more particularly for equipment manufacturers, and the situation was aggravated by the geopolitical context, notably in Europe, the Company was able to demonstrate its resilience, strengthen its presence in its various regional markets, and support the development of promising technological segments. The actions taken to protect operating income, preserve cash and make fixed costs more flexible protected the Group's results during this period. The Group has also implemented its deleveraging strategy in accordance with the plan submitted to shareholders, which has resulted in the renegotiation of its debt and the sale of assets. The Group has initiated various synergy programs, including cost optimization synergies following the consolidation of HELLA. It has also pursued its ambitious carbon neutrality plan, which has produced effects in all the Group's sectors and geographies.
These achievements are reflected in the remuneration of the Chief Executive Officer in 2022, a significant part of which is based on the Group's performance, in particular for the short-term and long-term variable aspects.
3.3.1.2.2.1. Fixed annual compensation
On February 18, 2022, the Board of Directors, on the recommendation of the Compensation Committee, decided, subject to the adoption of the 2022 compensation policy by the Company’s General Meeting, to increase the fixed annual compensation as from January 1, 2022 for the Chief Executive Officer from €1,000,000 to €1,100,000, to take into account the new dimension of the Group following the acquisition of HELLA in January 2022 and the subsequent significant change in the responsibilities of the Chief Executive Officer. The proposed increase of 10%, which was approved by the general meeting dated June 1st, 2022, was based on a comparative study based on a group of comparable European industrial companies.
As a result, the fixed annual compensation of the Chief Executive Officer amounted to €1,100,000 for the 2022 fiscal year. This amount was paid in full in 2022.
3.3.1.2.2.2. Variable annual compensation
On the recommendation of the Compensation Committee, the Board of Directors set the procedures for determining the variable compensation of the Chief Executive Officer for 2022, in accordance with the 2022 compensation policy.
The table below summarizes the results of the analysis carried out by the Board of Directors on February 17, 2023, on the recommendation of the Compensation Committee, and assesses the levels of achievement of the quantifiable and qualitative criteria targets set in respect of the variable annual compensation for the fiscal year ended December 31, 2022:
Relative weight of each performance criterion |
Minimum(1) |
Target objective(1) |
Maximum(1) |
Achievement level |
Amount in cash (€) |
Assessment |
---|---|---|---|---|---|---|
Quantifiable (distribution of criteria on a 100% basis): from 0% to 142.50% of fixed annual compensation |
||||||
Net-debt-to-EBITDA ratio (50%) |
0% |
100% |
190% |
190% |
1,045,000 |
Exceeded targets for the execution of the deleveraging strategy over 2022, the deployment of the Faurecia/HELLA synergy plan with quantifiable impacts over 2022 and on a run rate basis, and the achievement of the carbon neutrality path objectives. |
Synergies relating to HELLA integration (10%) |
0% |
100% |
190% |
190% |
209,000 |
|
Quantifiable environmental criteria relating to carbon neutrality (15%) |
0% |
100% |
190% |
190% |
313,500 |
|
Total quantifiable |
- |
- |
|
190% |
1,567,500 |
|
Individual (distribution of criteria on a 100% basis): 0% to 37.5% of fixed annual compensation |
||||||
Order intake (25%) |
0% |
100% |
150% |
150% |
412,500 |
Achievement of 2022 order intake targets, with associated margin.
|
|
|
|
|
|
|
|
Total qualitative |
- |
- |
- |
150% |
412,500 |
|
Total |
- |
- |
- |
|
1,980,000 |
|
(1) The quantified amount of the objectives of the quantifiable criteria are not made public for confidentiality reasons. |
- ■Quantifiable criteria:
- ■The criterion relating to the net debt to EBITDA ratio was defined by the Board of Directors with reference to the deleveraging trajectory following the acquisition of HELLA, and the targets were set in the Group's budget. Achievement was measured at June 30, 2022 and December 31, 2022, and the Board of Directors noted that the objectives had been reached to the maximum extent possible.
- ■The criterion relating to synergies from the integration of HELLA was defined by the Board of Directors with reference to the HELLA integration plan and the expected financial synergies at the level of the consolidated Group, and the objectives were set in the Group budget. Achievement was measured as of December 31, 2022, and the Board of Directors noted that the objectives had been reached to the maximum extent possible, both in terms of impact over 2022 and in terms of run rate impact.
- ■The environmental criterion linked to carbon neutrality has been defined by the Board of Directors with reference to the trajectory for achieving the Group's commitments (excluding HELLA) for 2025 and in line with the intermediate stage of 2023, as specified in the "sustainability-linked financing framework". Achievement was measured as of December 31, 2022 and the Board of Directors noted that the Group had reached its maximum target, with 35.9 tons of CO2 issued per million euros of revenue generated at Faurecia level.
- ■Qualitative criteria: given the objectives set and the results obtained, the qualitative criterion has been achieved to the maximum. The elements taken into account are detailed below.
- ■The amount of new orders in euros was achieved at the level of the Faurecia budget and overachieved when considering Forvia level ; operating margins associated with these orders were higher than the Faurecia and Forvia budgets set by the Board of Directors.
After examining the rate of achievement of the objectives of the criteria for the variable annual compensation for the 2022 fiscal year, the Board of Directors of February 17, 2023 noted that the total amount of the variable annual compensation for 2022 amounts to €1,980,000, compared to €300,000 for the 2021 fiscal year (and €270,000 for the 2020 fiscal year). Taking into account the amount of variable annual compensation for fiscal year 2022 resulting from outperformance relative to the quantifiable criteria, the relative proportion of fixed and variable annual compensation for fiscal year 2022 is as follows: 36% for fixed annual compensation and 64%for variable annual compensation.
In accordance with the provisions of Article L. 22-10-34 of the French Commercial Code, the variable compensation for the fiscal year ended December 31, 2022 shall be paid only after the shareholders, in a meeting to be held on May 30, 2023, have approved the components of compensation paid during the course of the 2022 fiscal year or awarded in respect of this fiscal year to Patrick Koller, Chief Executive Officer.
It is also acknowledged that the payment of Patrick Koller’s variable annual compensation for the 2021 fiscal year, which amounted to €300,000 was, in accordance with the law, subject to a favorable vote at the General Meeting of June 1, 2022 on the components of compensation paid or awarded in respect of the 2021 fiscal year (9th resolution). Since the vote in favor of this resolution was 92.41%, the payment of Patrick Koller’s variable annual compensation for the 2021 fiscal year was made after this General Meeting.
3.3.1.2.2.3. Performance shares
Introductory information: Plan delivered in 2022 / Plan for which the performance assessment took place in 2022 / Plan for which the performance conditions are set by reference to the 2022 fiscal year
In view of the capital increase carried out by the Company in 2022, the Board of Directors had the option to neutralize the impact of the transaction by adjusting the rights to receive shares in favor of the beneficiaries of Share Plans subject to performance conditions. This option was introduced by the regulations of Plan No. 11 of October 9, 2019, No. 12 of October 22, 2020, ESPI of July 23, 2021 and No. 13 of October 25, 2021 and transposed the applicable rules provided for in Articles R. 225-137 et seq. of the French Commercial Code, taking into account the ratio between the share price before and after the detachment of preferential subscription rights.
At its meeting of July 22, 2022, the Board of Directors decided that the number of performance shares to be delivered to beneficiaries of free share allocation plans whose vesting period is ongoing will be multiplied by 1.0788, the new number of shares obtained being rounded up to the next higher integer.
The non-achievement of the performance conditions of the internal and external quantitative targets, described in Chapter 5 “Capital stock and shareholding structure”, Section 5.2.2 “Potential capital” of the 2021 Universal Registration Document, are restated in the summary table below. As a result, no performance shares will be delivered under Plan No. 10.
The Board of Directors, at a meeting held on October 9, 2019, on a recommendation from the Compensation Committee, resolved to grant a maximum of 1,147,260 performance shares, including 56,220 to Patrick Koller. In addition to a condition of presence, this grant is subject to (i) an external condition of net earnings per share assessed between the 2018 fiscal year and the 2021 fiscal year, by comparison with a reference group of global automotive suppliers, weighting 30%, (ii) an internal condition related to the Group net income (after tax) at December 31, 2021, weighting 60% and (iii) a CSR internal condition related to gender diversity within the “Managers and Professionals” category (Group executives), weighting 10%.
At its meeting of February 18, 2022, the Board of Directors noted, on the recommendation of the Compensation Committee (i) the non-achievement of the quantified objectives of the internal condition related to the Group’s net income (after tax) as assessed at December 31, 2021 (weighting of 60%) and (ii) the achievement of 115% of the internal CSR condition linked to gender balance within the “Managers and Professionals” category at December 31, 2021.
At its meeting of April 21, 2022, the Board of Directors noted, on the recommendation of the Compensation Committee, the non-achievement of the external condition linked to the net earnings per share of Plan No. 11.
As a consequence and given the decision made by the Board of Directors on July 22, 2022 to proceed to an adjustment of the number of unvested rights related to the Performance Share Plans (following the capital increase carried out by the Group), the number of shares that will therefore be delivered to the Chief Executive Officer in October 2023 will be 5,365 shares.
The Board of Directors, at a meeting held on October 22, 2020, on a recommendation from the Compensation Committee, resolved to grant a maximum of 1,384,630 performance shares, including 61,140 to Patrick Koller.
In view of the decision of the Board of Directors on July 22, 2022 to adjust the rights to performance shares subject to performance conditions not yet vested (following the capital increase carried out by the Group), the maximum number of performance shares now granted to Patrick Koller has been adjusted to 65,958 under Plan No. 12.
In addition to a condition of presence, this grant is subject to (i) an external condition of net earnings per share assessed between the 2019 fiscal year and the 2022 fiscal year, by comparison with a reference group of global automotive suppliers, weighting 30%, (ii) an internal condition related to the Group net income (after tax) as of December 31, 2022, weighting 60% and (iii) a CSR internal condition related to gender diversity within the “Managers and Professionals” category (Group executives), weighting 10%.
The impact of the integration of HELLA into Faurecia's accounts as from 2022, as well as exceptional events such as the war in Ukraine and the level of vehicle production, have been restated from the internal target criterion for net income after tax under Plan No. 12 by decision of the Board of Directors on July 22, 2022, while maintaining the same trajectory curve.
The completion of the internal conditions and the external condition of Plan No. 12 will be assessed by the Board of Directors at its meeting reviewing the sales revenue of the first quarter of 2023.
The Board of Directors, at a meeting held on October 25, 2021, on a recommendation from the Compensation Committee, resolved to grant a maximum of 1,389,000 performance shares, including 96,150 to Patrick Koller.
In view of the decision of the Board of Directors on July 22, 2022 to adjust the rights to performance shares subject to performance conditions not yet vested (further to the capital increase carried out by the Company), the maximum number of performance shares now granted to Patrick Koller has been adjusted to 103,727 under Plan No. 13.
The Board of Directors, at a meeting held on July 23, 2021, on a recommendation from the Compensation Committee, resolved to grant a maximum of 673,549 performance shares, including 71,941 to Patrick Koller.
- ■50% of the rights subject to a condition of Annual Relative TSR, with a level of achievement noted each year, over a period of five years, giving rise to a maximum annual partial vesting of 20% of the tranche of the year in question. The total amount of the definitive grant under the Annual Relative TSR will be equal to the sum of the five years of partial vesting of the Annual Relative TSR.
- ■50% of the rights subject to a condition of Average Relative TSR 5 Years, not giving rise to any partial vesting, the level of realization being calculated at the end of the five-year reference period and taking into account all the Relative Annual TSR of the period.
In view of the decision of the Board of Directors on July 22, 2022 to adjust the rights to performance shares subject to performance conditions not yet vested (following the capital increase carried out by the Group), the maximum number of performance shares now granted to Patrick Koller has been adjusted to 77,610 as part of the ESPI plan.
In addition, at its meeting of July 22, 2022, the Board of Directors, on the recommendation of the Compensation Committee, noted the non-fulfillment of the first tranche of the annual relative Total Shareholder Return (TSR) condition (i). Consequently, the maximum number of shares remaining for the Chief Executive Officer is 69,848.
The conditions for the definitive acquisition of these shares described above, as well as the consequence of the neutralization of the capital increase, are set out in Chapter 5 "Capital stock and shareholding structure", section 5.2.2 "Potential capital stock" of this Universal Registration Document.
The table below summarizes, for the three Plans No. 10 to 12, described above, the maximum number of shares to be allocated to the Chief Executive Officer, the rate of achievement of the performance conditions, the rate of vesting and the number of shares delivered (or to be delivered) to the Chief Executive Officer:
|
Plan No. 10 |
Plan No. 11 |
Plan No. 12 |
---|---|---|---|
Maximum number of shares initially allocated |
27,000 |
56,220 |
61,140 |
Maximum number of shares after capital increase adjustment |
|
60,651 |
65,958 |
Achievement rate of performance conditions |
Internal condition of net income : 0% External condition: 0% |
Internal condition of net income : 0% External condition: 115% |
Internal and external conditions: assessed by the Board of Directors at its Q1 2023 sales meeting |
Rate of allocation (vesting) |
0% |
11.5% |
|
Number of shares delivered (or to be delivered) to the Chief Executive Officer |
0 |
4,973 |
- |
Number of shares delivered (or to be delivered) to the Chief Executive Officer after adjustment related to the capital increase |
|
5,365 |
- |
Plans awarded in 2022
Plan No. 14 awarded
At a meeting held on July 28, 2022, the Board of Directors, on a recommendation from the Compensation Committee, resolved, on the basis of the 20th resolution of the General Meeting of June 1, 2022, to grant a maximum of 2,388,290 performance shares, of which 169,830 performance shares (i.e., 0.086% of the capital stock at December 31, 2022) to Patrick Koller .
The valuation of the grant, according to the standards used for the consolidated financial statements, amounts to €2,228,170, i.e., 203% of the reference fixed compensation.
The internal and external conditions of Plan No. 14 as well as the objectives for the Chief Executive Officer are presented in the table below:
Relative weight of each performance criterion(1) |
Minimum(2) |
Target objective |
Maximum |
Assessment |
Internal condition: Group net income after tax (excluding exceptional tax credits) for the fiscal year ended on December 31, 2024, before taking into account capital gains on asset disposals and changes in scope, such as decided by the Board of Directors (“Net income 2024”), assessed against the same income anticipated for the same fiscal year by the Group’s strategic plan (“SP Net Income”). Weighting: 60% |
Net Income 2024 = 90% of the SP Net Income target |
Net Income 2024 = SP Net Income target |
Net income for 2024 ≥ 110% of the SP Net Income target |
For all conditions:
|
Internal condition: Gender balance (% of women) in the Group’s “Managers and Professionals” category at December 31, 2024 compared to the targets set by the Board of Directors. Weighting: 10% |
-1 point |
100% of the target |
≥ +2 points |
|
External condition: Level of growth in Faurecia’s net earnings per share between the 2021 and 2024 fiscal years (“Faurecia EPS”), assessed against the weighted growth of a reference group comprised of 12 comparable international automotive suppliers(3) (“Benchmark EPS”). Weighting: 30% |
Hypothesis 1: Benchmark EPS ≤ -20% (therefore negative) Faurecia EPS = 125% Benchmark EPS Hypothesis 2: -20% < Benchmark EPS < +20% Faurecia EPS = Benchmark EPS -5% Hypothesis 3: Benchmark EPS ≥ +20% Faurecia EPS = 75% Benchmark EPS |
Hypothesis 1: Benchmark EPS ≤ -20% (therefore negative) / Hypothesis 2: -20% < Benchmark EPS < +20% Hypothesis 3: Benchmark EPS ≥ +20% Faurecia EPS = Reference EPS |
Hypothesis 1: Benchmark EPS ≤ -20 % (therefore negative) Faurecia EPS ≥ 75% Benchmark EPS Hypothesis 2: -20% < Benchmark EPS < +20% Faurecia EPS ≥ Benchmark EPS +5% Hypothesis 3: Benchmark EPS ≥ +20% Faurecia EPS ≥ 125% Benchmark EPS |
|
(1) For beneficiaries other than the Chief Executive Officer: 20% for the Internal Operating Result Criterion, 25% for the Net Cash Flow Internal Criterion, 30% for the External Criterion, 10% for the Internal CSR Gender Mix Criterion and 15% for the Internal CSR Reduction of CO2 emissions Criterion. These criteria are presented in Chapter 5 "Capital stock and shareholding structure" of this Universal Registration Document. (2) The numerical targets of the internal conditions (and more specifically those of the internal condition linked to net income) are not made public for confidentiality reasons. (3) The reference group consists of the following European and North American automotive suppliers: Adient, Aptiv (formerly Delphi), Autoliv, Autoneum, Borg Warner, Continental, Lear, Magna, Plastic Omnium, Schaeffler, Tenneco, Valeo. |
In case of deviation in the volumes of the worldwide automobile production compared to the Company's strategic plan figures for the year in question, the Board of Directors shall have the possibility to adjust mechanically the objectives of the internal financial criteria. This possibility is detailed in Chapter 5 “Capital stock and shareholding structure”.
An attendance condition (subject to standard exceptions) applies to all beneficiaries including the Chief Executive Officer. The vesting is completed after a four-year vesting period, it being stipulated that no holding period is stipulated by the plan.
The Chief Executive Officer must retain, in registered form and while he continues to hold office, at least 30% of all shares actually acquired under each plan. This threshold requirement ceases to apply when the Chief Executive Officer holds a number of shares corresponding to three years of base gross compensation, factoring in all the previously established plans, and becomes applicable again if the Chief Executive Officer no longer holds the number of target shares corresponding to this level of base gross compensation.
In accordance with the AFEP-MEDEF Code, Patrick Koller has made a formal commitment not to use any risk hedging transactions on the performance shares granted to him.
3.3.1.2.2.4. Pension schemes
The Chief Executive Officer benefits from the same pension scheme as the one provided for the other members of the Group’s Executive Committee with a French contract. This plan includes a supplementary defined contributions pension scheme and a supplementary defined benefits pension scheme.
The main features of these schemes for the Chief Executive Officer are described in the summary table below, being reminded that following the freezing of past potential rights under defined benefits pension schemes governed by Article L. 137-11 of the French Social Security Code, complying with Law No. 2019-486 of May 22, 2019 and Order No. 2019-687 of July 3, 2019 transposing the directive on pension rights’ portability, Faurecia implemented two vested rights supplementary pension schemes for rights relating to periods of employment after January 1st, 2020 that complies with the new legal requirements set out in Article L. 137-11-2 of the French Social Security Code.
|
Defined contribution pension scheme |
Defined benefit plan (frozen – all tranche C executives) |
Specific supplementary pension scheme (frozen – members of the Executive Committee France) |
Specific supplementary Defined benefit plan of vesting rights subject to performance conditions (members of the Executive Committee France) |
Defined benefit plan of vesting rights and under performance conditions (all tranche C executives) |
---|---|---|---|---|---|
Applicable law |
Article 83 of the French General Tax Code |
Articles 39 of the French General Tax Code and L. 137-11 of the French Social Security Code |
Article L. 137-11-2 of the French Social Security Code |
Authorization of the benefits |
BoD of July 25, 2016 GM of May 30, 2017 |
BoD of April 17, 2020 GM of June 26, 2020 (as part of the ex-ante vote on the compensation policy for the Chief Executive Officer) - Pending implementation with retroactive effect as of January 1, 2020 |
BoD of February 19, 2021 GM of May 31, 2021 |
Scheme entry conditions and other conditions giving entitlement to benefit from it
|
One year’s seniority in the Group at the time of retirement
|
|
|
|
|
Method for determining the reference compensation used to calculate entitlements |
Contributions to tranche A and tranche B of the current year (amount of contributions paid by the Company in 2022: €7,815.84 |
Average over the three years preceding the liquidation of the rights of compensation in tranche C, which, in 2022, corresponds to €164,544 |
Average over the three years preceding the liquidation of the rights of the total compensation (basic and variable) excluding exceptional items
|
Gross salary within the meaning of Article L. 242-1 of the French Social Security Code (basic and variable, excluding exceptional items) received during the year of Executive Committee membership |
Portion of gross annual compensation (gross annual base compensation, gross annual variable compensation, benefits in kind and hardship allowance paid to the beneficiary during the year in question) between 4 and 8 times the PASS |
Vesting formula |
1% of the compensation in tranche A and 6% of the compensation in tranche B |
1% of the compensation in tranche C and performance conditions linked to the degree of the achievement of variable compensation targets(1) |
Depending on Faurecia’s performance, from 1 to 3% of total compensation (base + variable), excluding special compensation(2) |
From 0 to 3% of the annual reference compensation depending on the achievement of performance conditions(3) |
For beneficiaries whose compensation exceeds 8 times the PASS and for corporate officers, the vesting percentage is between 0 and 0.50% depending on the achievement of performance conditions(6). This percentage may be as high as 0.75% for beneficiaries of this plan who are also potential beneficiaries of the former “Article 39” plan and whose rights have been frozen(7) |
Ceiling, amount or terms and conditions for determining it |
Not applicable |
|
|
|
|
Ceiling, amount or terms and conditions for determining it |
|
|
|
|
|
Funding of rights |
Outsourced |
Outsourced |
Outsourced |
Outsourced |
Outsourced |
Estimated amount of the pension for the Chief Executive Officer at the end of the fiscal year |
€ 4,675 annual euros |
€23,713 annual euros(4) |
€258,761 annual euros(5) |
16 800 euros |
1 234 euros |
Associated tax and payroll expenses |
Not applicable |
Tax on annuity |
Tax on contribution
|
Contribution of 29.7% |
(1) For the Chief Executive Officer, if the annual variable compensation targets are achieved: (i) up to 80% or more, a 1% increase in potential rights (limited to tranche C of the compensation) will be vested for the period in question and (ii) less than 80%, the increase in rights will be reduced in proportion to the achievement of the objectives (e.g. : a target achieved at 30% will result in a 0.30% increase in potential rights). (2) For the Chief Executive Officer and members of the Executive Committee (France), the level of annual pension is determined according to the Company’s operating income, in relation to the budget, as approved by the Board of Directors on the basis of the following formula: ∑ Xi * R where R = annual reference compensation and Xi = rights granted for each year of seniority, i being equal to (i) 3% if the operating income for the year is greater than 105% of the budgeted operating margin, (ii) 2% if the operating margin for the year is between 95 and 105% of the budgeted operating margin, and (iii) 1% if the operating margin for the year is lower than 95% of the budgeted operating margin. (3) For the Chief Executive Officer and the members of the Executive Committee (France), the level of annual pension is calculated according to the following formula: ∑ Xi * R where R = annual reference compensation and Xi = annual entitlement granted on the basis of an annual annuity for each year of service in the plan, i being equal to the sum of the rights granted on the basis of the following criteria: Based on Faurecia’s operating income:
|
|||||
If the level of achievement of one of the conditions is less than 75%, no rights may be allocated for the year in question. The Board of Directors, on the recommendation of the Compensation Committee, assessed at its meeting of February 17, 2023 the levels of achievement in relation to the objectives set and noted the achievement of the two performance conditions. Consequently, 1.2% of rights were acquired for the financial year ended December 31, 2022. (4) Seniority starting from December 18, 2006. (5) Seniority starting from January 1, 2015. (6) Based on the level of achievement of annual variable compensation (FVC) targets:
(7) Based on the level of achievement of annual variable compensation (FVC) targets:
|
Further information on these pension schemes can be found in Note 25-2 to the consolidated financial statements.
3.3.1.2.2.5. Termination payment
Patrick Koller benefits from a severance payment of up to 24 months of compensation which was authorized by the Board of Directors on July 25, 2016 pursuant to the procedure of Article L. 225-42-1 of the French Commercial Code (now repealed) and approved by the General Meeting of May 30, 2017 in respect of its fifth resolution. It should be noted that this was adjusted during the review of the Chief Executive Officer’s package by the Board of Directors on February 14, 2020 solely in order to align the calculation methods for the reference compensation with those of the non-competition clause, and approved in accordance with the law by the General Meeting of June 26, 2020 as part of the vote on the compensation policy for the Chief Executive Officer for 2020 (16th resolution). The conditions of this compensation have remained unchanged since that date.
The terms and conditions of the termination payment granted to the Chief Executive Officer are described in the compensation policy for the Chief Executive Officer for 2022 and 2023, which appear respectively in Sections 3.3.4.1.3 “Compensation policy for the Chief Executive Officer” of the 2021 Universal Registration Document and this Universal Registration Document.
3.3.1.2.2.6. Non-competition indemnity
Since the decision of the Board of Directors of February 14, 2020, Patrick Koller is subject to a non-compete commitment for a period of 12 months applicable in the event of his resignation, it being specified that the compensation due in return for this commitment became effective following the approval, in accordance with the law, by the General Meeting of the Board of Directors of June 26, 2020 of the 2020 compensation policy for the Chief Executive Officer in respect of the 16th resolution. The conditions of this non-compete commitment remained unchanged in 2022.
The terms of the non-compete commitment, and the related indemnity, to which the Chief Executive Officer is entitled, are described in the compensation policy for the Chief Executive Officer for 2022 and 2023 which appear respectively in Sections 3.3.4.1.3 “Compensation policy for the Chief Executive Officer” of the 2021 Universal Registration Document and this Universal Registration Document.
3.3.1.2.2.7. Notice and non-solicitation
Patrick Koller is subject to six months’ notice in the event of his resignation and has a non-solicitation commitment of 12 months. These provisions were decided by the Board of Directors on February 14, 2020 and became effective following the approval, by the General Meeting of June 26, 2020, of the 2020 compensation policy for the Chief Executive Officer in respect of the 16th resolution. The terms of the notice period and the non-solicitation commitment remained unchanged in 2022.
The terms of the notice period and the non-solicitation commitment are described in the compensation policy for the Chief Executive Officer for 2022 and for 2023 which appear respectively in Sections 3.3.4.1.3 “Compensation policy for the Chief Executive Officer” of the 2021 Universal Registration Document and this Universal Registration Document.
3.3.1.2.2.8. Benefits in kind and social protection
Patrick Koller has been provided with a company car. The total amount of the benefits in kind is €15,378.
It is also specified that the Company paid, in respect of the supplementary medical/life/disability insurance plan, €6,964.
3.3.1.2.2.9. Other components of compensation
With the exception of the items described above, Patrick Koller did not receive any other compensation or benefits (including for his duties as a Company Board member).
For information, Patrick Koller receives compensation for his term of office on the HELLA Shareholders’ Committee (for more information, please refer to the HELLA annual report). Such approach is in line with German corporate standard (notably for listed companies controlled by another listed company).
3.3.1.2.2.10. Taking into account the vote of the last General Meeting
Faurecia has an active engagement policy with its investors and proxy advisory firms during the financial roadshows to discuss governance as well as developments in governance and compensation-related best practices. Numerous meetings were held during the first quarter of 2022, and until the General Meeting in 2022, on compensation issues (see Section 3.1.2.4. “Governance structure and shareholder dialogue” of this Universal Registration Document).
The Board of Directors took their comments into account, in particular with regard to the stability of the compensation structure and the level of the fixed compensation of the Chief Executive Officer following the increase granted by the General Meeting in 2022. Also, for the sake of continuity, the structure of the compensation policy proposed by the Board of Directors for the 2023 financial year remains unchanged.
Faurecia has also taken into account the expectations of its shareholders and voting advisory agencies with regard to the growing importance of Environmental, Social and Governance (ESG) criteria in the assessment of executive performance. A criterion linked to the carbon neutrality trajectory has been integrated into the elements of the short-term variable compensation of the Chief Executive Officer (as well as those of all the beneficiaries of a variable compensation system in the Group) from year 2022, as presented in the 2022 Compensation Policy. Faurecia has also included in its Performance Share Plan No. 11 granted in 2019, an objective related to gender diversity and proposes to add a second ESG objective linked to carbon neutrality among the performance conditions applicable to the Performance Share Plans which would be awarded to the Chief Executive Officer in 2023.
3.3.1.2.2.11. Compliance of compensation paid with the compensation policy
The elements of compensation awarded or paid to the Chief Executive Officer are in accordance with the provisions adopted by the Board of Directors, upon recommendation of the Compensation Committee and voted by the General Meeting of Shareholders held on June 1, 2022 (12th resolution adopted with 85.19% of the votes).
The Company is compliant with the procedure for implementing the compensation policy as approved by the shareholders in the aforementioned General Meeting.
The compensation paid contributes to the long-term performance of the Company insofar as the criteria for variable compensation are consistent with the long-term strategy of the Group.
3.3.1.2.3.Compensation paid during the 2021 and 2022 FISCAL YEARS or granted for the same FISCAL YEARS
The tables below set out the compensation and benefits paid during fiscal years 2021 and 2022 or awarded in respect of these fiscal years to Patrick Koller, the Chief Executive Officer.
To the extent that all stock subscription options ceased to be in force, tables No. 4, No. 5 and No. 8 on options awarded or exercised during the fiscal year as defined by the AFEP-MEDEF Code and AMF recommendation No. 2021-02 are not applicable. This is also the case with regard to table No. 10 of the AFEP-MEDEF Code given that Patrick Koller does not receive multi-annual variable compensation in cash.
Lastly, the tables setting out the past granting of performance shares (table No. 9 of the AFEP-MEDEF Code and table No. 10 of AMF recommendation No. 2021-02) are set out in Chapter 5 “Capital stock and shareholding structure,” Section 5.2.2 “Potential capital stock”.
Summary of compensation and options and shares granted to Patrick Koller
Table No. 1 (AFEP-MEDEF Code and AMF recommendation No. 2021-02)
(in €) |
2021 fiscal year |
2022 fiscal year |
---|---|---|
Compensation granted for the fiscal year (see table 2) |
1,322,331 |
3,102,342 |
Value of stock options granted during the fiscal year |
- |
|
Value of performance shares granted during the fiscal year (set out in table 6) |
3,441,472 |
2,228,170 |
Value of other long-term compensation plans |
- |
|
Total |
4,763,803 |
5,330,512 |
Summary of Patrick Koller’s compensation
Table No. 2 (AFEP-MEDEF Code and AMF recommendation No. 2021-02)
(gross in €) |
2021 fiscal year |
2022 fiscal year |
||
---|---|---|---|---|
Amount granted |
Amount paid |
Amount granted |
Amount paid |
|
Fixed compensation |
1,000,000 |
1,000,000 |
1,100,000 |
1,100,000 |
Annual variable compensation |
300,000(2) |
270,000(1) |
1,980,000(2) |
300,000(3) |
Multi-annual variable compensation |
- |
- |
|
|
Exceptional compensation |
- |
- |
|
|
Compensation as Board member |
- |
- |
|
|
Benefits in kind |
22,331(4) |
22,331 |
22,342 |
22,342 |
Total |
1,322,331 |
1,292,331 |
3,102,342 |
1,422,342 |
(1) Amount paid in 2021 in respect of the 2020 fiscal year. (2) Amount granted in respect of the 2022 fiscal year, which will be paid subject to a favorable 2022 ex post vote for the Chief Executive Officer at the General Meeting of May 30, 2023. (3) Amount paid in 2022 in respect of the 2021 fiscal year further to the approval of the 9th resolution in relation to ex post vote for the Chief Executive Officer at the General Meeting of June 1, 2022. (4) Provision of a company car. This figure also includes social protection schemes (6,964 in respect of the 2021 fiscal year and 6,964 in respect of the 2022 fiscal year). |
Performance shares granted to Patrick Koller during the fiscal year
Table No. 6 (AFEP-MEDEF Code and AMF recommendation No. 2021-02)
Number and date of plan |
Maximum number of shares granted during the relevant fiscal year(1) |
Valuation of shares according to the method used for the consolidated financial statements (in €) |
Vesting date |
Availability date |
Performance conditions(1) |
|
|
|
|
|
|
Plan No. 14 of July 28, 2022 |
169,830 |
2,228,170 |
July 28, 2022 |
July 28, 2026 |
Internal condition, linked to the Group net income after tax (weighting of 60%) Internal condition linked to gender diversity (% of women) within the Group’s “Managers and Professionals” category (weighting of 10%) External condition linked to weighted growth in net earnings per Faurecia share (weighting of 30%) |
Total |
169,830 |
2,228,170 |
|
|
|
(1) Details on the performance conditions as well as the targets set can be found in Section 3.3.1.2.2.3 “Performance shares”. |
Performance shares that became available to Patrick Koller during the fiscal year
Table No. 7 (AFEP-MEDEF Code and AMF recommendation No. 2021-02)
Number and date of plan |
Number of shares that became available during the fiscal year(1) |
Vesting conditions |
Plan No. 10 of July 19, 2018 |
0 |
Patrick KOLLER must retain, in registered form and while he continues to hold office, at least 30% of all shares actually acquired under each plan. This percentage threshold obligation for each plan will cease to apply once Patrick KOLLER owns a number of shares that corresponds to three years’ gross base compensation, factoring in all the plans already vested, and will again become applicable in the event that Patrick KOLLER no longer holds the target number of shares corresponding to this level of base gross compensation. |
Total |
0 |
|
(1) The initial grant related to a maximum of 27,000 shares. As the performance conditions were not met, there was therefore no vesting of shares under Plan No. 10. |
The total number of performance shares outstanding at December 31, 2021 which may vest to Patrick Koller (minus the number of shares already vested) represents a total of 414,728 shares, i.e. 0.21% of Faurecia’s capital at that date. This number is obtained after adjustment related to the capital increase.
Table No. 11 (AFEP-MEDEF Code and AMF recommendation No. 2021-02)
|
Employment contract |
Supplementary pension scheme |
Compensation or benefits due or that may be due on termination or change in position |
Compensation due under a non-competition clause |
Name: Patrick Koller Position: Chief Executive Officer since July 1, 2016 Date of end of corporate office: undetermined, Patrick Koller’s appointment as Chief Executive Officer being without a specified term |
No |
Yes (1) |
Yes (2) |
Yes (3) |
(1) The key aspects of the supplementary pension scheme are described in Section 3.3.1.2.2.4 “Pension schemes” of this Universal Registration Document. (2) The terms and conditions of the severance payment are described in Section 3.3.4.1.3 “Compensation policy for the Chief Executive Officer” of this Universal Registration Document. (3) The terms of the non-compete payment are described in Section 3.3.4.1.3 “Compensation policy for the Chief Executive Officer” of this Universal Registration Document. |
3.3.1.3.Information on compensation for executive corporate officers and changes during the last five fiscal years
This paragraph relates specifically to multiples of compensation between the level of compensation of executive corporate officers and the level of average and median compensation of Group employees in France. It also deals with the annual evolution of compensation for executive and non-executive corporate officers and Group employees in France, as well as Group performances’ evolution. Information is presented, for the 2018-2022 period, in accordance with the AFEP guidelines on compensation multiples updated in February 2021. It is also the case for the table on data.
The Group’s governance structure has been composed of a Chairman of the Board of Directors and a Chief Executive Officer.
The corporate office of Chairman of the Board of Directors has been held by Michel de Rosen since May 30, 2017. The corporate office of Chief Executive Officer has been held by Patrick Koller since July 1, 2016.
As for the employees’ scope to be taken into account, Faurecia SE, as the holding company of Faurecia group, and having only seven employees for a total France headcount of 9,262 employees, as of December 31, 2022 it has been decided to take into consideration a more representative scope for the Group’s business in France, and to take into account all French legal entities integrated into the Group from January 1st to December 31(2), according to AFEP-MEDEF Code (§26-2) and AFEP guidelines on compensation multiples, updated in February 2021.
It is specified that the Group’s French headcount represents, at the end of 2002, less than 10% of the Group’s total headcount and includes nearly 70% of non-executive employees.
The compensations taken into account in calculations are those of Faurecia French employees who were present throughout the entire year in question. The compensation for part-time employees has been recalculated to the full-time equivalent. The components of the compensations used for these ratios have been calculated on the basis of the fixed and variable compensation paid over the course of the fiscal years in question, including incentive plans and profit-sharing, as well as the performance shares granted, to the target, over the same fiscal years and recorded at fair value(3). Short-time working allowances were also taken into account. Only additional pension schemes that represent a posterior benefit to the contract and corporate offices were not taken into account.
The decrease of the Chief Executive Officer's compensation in 2022, for the purpose of the equity ratio, is mainly linked to the non-renewal of an exceptional performance share plan (ESPI) applicable in 2021 to all members of the Executive Committee and implemented as part of initiatives to strengthen the loyalty.
In addition, the performance criterion used to assess Group performance is the operating income. This criterion is established on a consolidated basis.
Table of ratios for I. 6° and 7° of Article L. 22-10-9 of the French Commercial Code
Compensation paid during the fiscal year under review includes variable compensation due for the previous fiscal year |
2018 fiscal year |
2019 fiscal year |
2020 fiscal year |
2021 fiscal year |
2022 fiscal year |
Change (in %) of the Chairman of the Board’s compensation (1)(2) |
-0.1% |
0.0% |
-4.3% |
4.7% |
0.4% |
Change (in %) in the compensation of the Chief Executive Officer (3) |
8.9% |
8.6% |
4.7% |
24.7% |
-33.8% |
Information on the scope of the listed company |
|
||||
Change (in %) of employees’ average compensation |
The scope of the listed company is not relevant since it only comprises six employees, excluding the Chief Executive Officer. It was deemed more representative to include all of the Group’s French legal entities in the enlarged scope, with the exception of companies that joined or left the Group during the five years in question. On average, over the five years studied, the scope represents nearly 95% of French employees. |
||||
Employee’s average compensation ratio |
|||||
Change in ratio (in %) versus previous fiscal year |
|||||
Employees’ median compensation ratio |
|||||
Change in ratio (in %) versus previous fiscal year |
|||||
Additional information on a broader scope (French legal entities) |
|
||||
Change (in %) of employees’ average compensation in French legal entities |
4.4% |
3.1% |
0.2% |
6.1% |
0.5% |
Chairman of the Board of Directors |
|
|
|
|
|
Employee’s average compensation ratio |
6.0 |
5.8 |
5.6 |
5.5 |
5.5 |
Change in ratio (in %) versus previous fiscal year |
-4.3% |
-3.0% |
-4.0% |
-1.4% |
-0.1% |
Employees’ median compensation ratio |
8.2 |
7.9 |
7.5 |
7.7 |
7.6 |
Change in ratio (in %) versus previous fiscal year |
-3.2% |
-4.2% |
-4.9% |
0.03% |
-2.5% |
Chief Executive Officer (CEO) |
|
|
|
|
|
Employee’s average compensation ratio |
66.5 |
70.0 |
72.4 |
85(4) |
56 |
Change in ratio (in %) versus previous fiscal year |
4.4% |
5.3% |
4.5% |
17.4%(4) |
-34.1% |
Employees’ median compensation ratio |
90.9 |
94.6 |
97.9 |
120.0(4) |
77.1 |
Change in ratio (in %) versus previous fiscal year |
5.3% |
7.3% |
4.6% |
22.6%(4) |
-35.7% |
Group performances |
|
|
|
|
|
Operating margin (in millions of euros)(5) |
|
|
|
|
|
Change (in %) versus previous fiscal year |
10% |
0.7% |
-67.4% |
106.2% |
29.4% |
(1) Total compensation paid or granted for the fiscal year. (2) Michel de ROSEN since June 1, 2017. (3) Patrick KOLLER since July 1, 2016. (4) Due to the exceptional nature of the single ESPI plan and to facilitate comparison with previous years, it is specified that the ratios and changes would have been respectively 67.2; -7.2%; 94.0; and -4.0% if the value of the ESPI was not taken into account in the Chief Executive Officer’s compensation. (5) Operating income - annual values (2018: €1,273.9 million; 2019: €1,283.3 million; 2020: €418 million; 2021: €862 million; 2022: €1 115 million. Despite a decrease in the worldwide automotive production in 2018 and 2019, Faurecia group operating income is in constant progression thanks to an increase of its sales. In 2019, in a difficult context impacted by a 5.8% decrease in the worldwide automotive production, the Faurecia group, outperforming the market and showing a good level of resilience, succeeded again in improving its level of operating income. In 2020, despite a marked improvement in the second half of the year, the Group’s operating margin was strongly impacted by the health crisis. In 2021, despite lower than expected global production, the continuing health crisis and difficulties in sourcing electronic components, the Group has outperformed the market thanks to all the action plans put in place. It is to be noted that the operational result for the financial year 2022 is that of Forvia (Faurecia + consolidation of HELLA for 11 months. |
3.3.1.4.Tables summarizing the components of the compensation paid or awarded for the fiscal year just ended to executive corporate officers
The tables below present a summary of the compensation and benefits paid during the 2021 fiscal year or awarded in respect of this same fiscal year to the executive and non-executive corporate officers.
3.3.1.4.1. Summary of the components of the compensation paid to the Chairman of the Board of Directors during the 2022 fiscal year or granted for the same fiscal year
Components of compensation |
Amounts granted in respect of the fiscal year just ended or accounting valuation |
Amounts paid during the fiscal year just ended |
Presentation |
Fixed compensation |
€265,200 |
€265,200 |
The principles for determining the compensation of Michel de ROSEN as Chairman of the Board of Directors, as well as the methods for implementing it (the “2022 Compensation”), are respectively described (i) in the compensation policy for the Chairman of the Board of Directors set out in Section 3.3.4.1.2 “Compensation policy for the Chairman of the Board of Directors” of the 2021 Universal Registration Document and of this Universal Registration Document (the “2022 and 2023 Compensation Policies”) and (ii) in Section 3.3.1.1.2.1 “Fixed annual compensation” of this Universal Registration Document. The amount of the 2022 fixed annual compensation was set at €300,000 (cap integrating the benefit in kind linked to the provision of a personal assistant). |
Annual variable compensation |
Not applicable |
Not applicable |
No annual variable compensation. |
Multi-annual variable compensation |
Not applicable |
Not applicable |
No multi-annual variable compensation. |
Exceptional compensation |
Not applicable |
Not applicable |
No exceptional compensation. |
Stock options, performance shares or any other long-term benefit |
Not applicable |
Not applicable |
No stock subscription or purchase options grant, performance shares, or any other long-term benefits. |
Compensation as Board member |
Not applicable |
Not applicable |
No compensation awarded as Board member. |
All benefits (including social protection) |
€46,116 including accounting valuation of €41,424 |
€46,116 (including accounting valuation of €41,424) |
The 2022 Compensation is respectively described in (i) the 2022 and 2023 Compensation Policies and (ii) Section 3.3.1.1.2.2 “Benefits in kind and social protection” of this Universal Registration Document. |
Termination payment |
Not applicable |
Not applicable |
No termination payment. |
Non-competition indemnity |
Not applicable |
Not applicable |
No non-competition indemnity. |
Supplementary pension schemes |
Not applicable |
Not applicable |
No supplementary pension scheme benefit. |
3.3.1.4.2. Summary of the components of the compensation of the Chief Executive Officer paid during the 2022 fiscal year or awarded for the same fiscal year(4)
Components of compensation |
Amounts granted in respect of the fiscal year just ended or accounting valuation |
Amounts paid during |
Presentation |
---|---|---|---|
Fixed compensation |
€1,100,000 |
€1,100,000 |
The principles for determining the compensation of Patrick KOLLER as Chief Executive Officer, as well as its implementation methods (the “2022 Compensation”) are respectively described (i) in the compensation policy for the Chief Executive Officer in Section 3.3.4.1.3 “Compensation policy for the Chief Executive Officer” of the 2021 Universal Registration Document (the “2022 Compensation Policy”) and this Universal Registration Document (the “2022 and 2023 Compensation Policies”) and (ii) in Section 3.3.1.2.2.1 “Fixed annual compensation” of this Universal Registration Document. |
Annual variable compensation |
€1,980,000 (amount to be paid in 2023 subject to a favorable vote by the General Meeting) |
€300,000 (compensation for the 2021 fiscal year, paid in 2022 following a favorable vote (92.41%) by the General Meeting of June 1, 2022 on the components of the compensation paid or awarded for the 2021 fiscal year (9th resolution)). |
The 2022 Compensation is respectively described in (i) the 2022 Compensation Policies and (ii) Section 3.3.1.2.2.2 “Variable annual compensation” of this Universal Registration Document. At a meeting held on February 17, 2023, the Board of Directors, on the recommendation of the Compensation Committee, determined and finalized the total annual variable compensation to be awarded to Patrick KOLLER for the fiscal year ended on December 31, 2022 as follows: |
|
|
|
|
|
|
|
In accordance with the provisions of Article L. 22-10-34 of the French Commercial Code, the variable compensation for the fiscal year ended December 31, 2022 shall be paid only after the shareholders have approved the components of compensation paid during the course of the 2022 fiscal year or awarded in respect of the same fiscal year to Patrick KOLLER, Chief Executive Officer. |
Multi-annual variable compensation |
Not applicable |
Not applicable |
No multi-annual variable compensation |
Exceptional compensation |
Not applicable |
Not applicable |
No exceptional compensation |
|
|
|
|
Stock options, performance shares or any other long-term benefit |
Options = not applicable Performance shares = €2,228,170 calculated on the maximum number of shares granted under Plan No. 14. |
Options = not applicable Performance shares = not applicable |
No stock subscription or purchase options grant. The Compensation for 2022 is respectively described (i) in the 2022 and 2023 Compensation Policies and (ii) in Section 3.3.1.2.2.3 “Performance Shares” of this Universal Registration Document.
Introductory information: Plan delivered in 2022 / Plan for which the performance assessment took place in 2022 / Plan for which the performance conditions are set by reference to the 2021 fiscal year:
|
|
|
|
|
|
|
|
Plan awarded in 2022:
|
|
Other long-term benefits = not applicable |
No other long-term benefits grant |
Compensation as Board member |
Not applicable |
Not applicable |
No compensation awarded as Board member |
All benefits (including social protection) |
€22,342 (of which €15,378 in accounting valuation) |
€22,342(of which €15,378 in accounting valuation) |
The 2022 compensation is described (i) in the 2022 and 2023 Compensation Policies and (ii) in Section 3.3.1.2.2.8 “Benefits in kind and social protection” of this Universal Registration Document. |
Termination payment |
Not applicable |
No payments during the fiscal year |
The 2022 compensation is described (i) in the 2022 and 2023 Compensation Policies and (ii) in Section 3.3.1.2.2.5 “Termination payment” of this Universal Registration Document. Patrick KOLLER benefits from a termination payment since July 25, 2016. This scheme, which was authorized for Patrick KOLLER, Chief Executive Officer, by the Board of Directors’ decision of July 25, 2016 under the conditions set forth under Article L. 225-42-1 of the French Commercial Code (now repealed), was approved by the General Meeting of May 30, 2017 (fifth resolution). It was then adjusted by the Board of Directors on February 14, 2020 solely in order to align the calculation methods for the reference compensation with that of the non-compete clause, and approved in accordance with the law by the General Meeting of June 26, 2020 in the context of the 2020 vote on the compensation policy for the Chief Executive Officer (16th resolution). It has not been modified since that date. |
Non-competition indemnity |
Not applicable |
No payments during the fiscal year |
The 2022 compensation is respectively described (i) in the 2022 and 2023 Compensation Policies and (ii) in Section 3.3.1.2.2.6 “Non-compete indemnity” of this Universal Registration Document. Patrick KOLLER has been bound by a non-compete covenant since February 14, 2020 and benefits from a related indemnity since June 26, 2020. The decision was taken by the Board of Directors on February 14, 2020 and approved in accordance with the law by the General Meeting of June 26, 2020 as part of the 2020 vote on the Chief Executive Officer’s compensation policy (16th resolution). The terms of this commitment remained unchanged in 2022. |
Supplementary defined contribution pension scheme (Article 83 of the French General Tax Code) and supplementary defined benefits pension scheme (Article 39 of the French General Tax Code) Frozen supplementary pension schemes: Defined benefits pension scheme and specific pension scheme (Article 39 of the French General Tax Code). |
Not applicable |
No payments during the fiscal year |
The 2022 compensation is respectively described (i) in the 2022 Compensation Policies described in the 2021 Universal Registration Document and (ii) in Section 3.3.1.2.2.4 “Pension schemes” of this Universal Registration Document.
|
|
|
|
|
3.3.2.Board members’ compensation for the 2021 and 2022 fiscal years
The principles for determining the compensation of Board members are described in the compensation policy for Board members in Sections 3.3.4.1.1 “Compensation policy for Board members” of the 2021 Universal Registration Document and this Universal Registration Document.
It is recalled, in summary, that the Board members receive as compensation for their activity a sum composed of:
- ■a fixed part;
- ■a predominantly variable part linked to the effective attendance;
- ■for Board members not residing in France, one additional allowance to take into account geographical remoteness for any physical participation in a Board meeting.
In addition, the Chairman of the Board of Directors and the Chief Executive Officer of Faurecia do not receive compensation for their office as Board members.
In terms of ceiling, the General Meeting of June 26, 2020 (10th resolution) set the maximum amount of compensation that may be paid to Board members at €900,000. Concerning the numerical distribution rules, the Board of Directors decided, at its meeting of February 18, 2022, to maintain the compensation scale as adjusted at the meeting of February 15, 2018. This scale is as follows:
|
Fixed compensation(1) |
Variable compensation per session |
Compensation for Board members not residing |
Board of Directors |
€12,000 |
€3,000 |
€3,000 per Board meeting attendance |
Committees |
|
|
|
|
€10,000 |
€2,500 |
- |
|
€15,000 |
€3,500 |
- |
(1) Prorated portion for members of the Board (or a Committee) who joined or left the Board (or a Committee) during the year. The amount is then divided by the number of Board and committee meetings (giving the right to compensation) organized during the year. |
In accordance with the rules described above, the table shows the gross amounts paid during/awarded in respect of fiscal years 2021 and 2022 to the Board members (non-executive corporate officers).
The components of compensation of the Board members are in accordance with the provisions adopted by the Board of Directors upon the recommendation of the Compensation Committee, constituting the compensation policy for the Company’s corporate officers as voted by the General Meeting held on June 1, 2022 (10th resolution adopted by 98.69% of the votes).
Table No. 3 (AFEP-MEDEF Code and AMF recommendation No. 2021-02)
Board members (non-executive corporate officers) (gross amounts in €) |
2021 fiscal year(1) |
2022 fiscal year(1) |
|
||
---|---|---|---|---|---|
Amount granted |
Amount paid(2) |
Amount granted |
Amount paid(3) |
|
|
Jürgen BEHREND |
- |
- |
25,636 |
- |
|
% fixed part |
- |
- |
30% |
- |
|
% variable part |
- |
- |
70% |
- |
|
Daniel BERNARDINO |
79,500 |
83,000 |
87,500 |
79,500 |
|
% fixed part |
28% |
- |
25% |
- |
|
% variable part |
72% |
- |
75% |
- |
|
Judy CURRAN |
- |
- |
55,909 |
- |
|
% fixed part |
- |
- |
20% |
- |
|
% variable part |
- |
- |
80% |
- |
|
Odile DESFORGES |
112,000 |
90,000 |
93,000 |
112,000 |
|
% fixed part |
33% |
- |
29% |
- |
|
% variable part |
67% |
- |
71% |
- |
|
Linda HASENFRATZ |
56,962 |
77,000 |
- |
56,962 |
|
% fixed part |
36% |
- |
- |
- |
|
% variable part |
64% |
- |
- |
- |
|
Penelope HERSCHER |
79,500 |
82,500 |
87,500 |
79,500 |
|
% fixed part |
28% |
- |
25% |
- |
|
% variable part |
72% |
- |
75% |
- |
|
Valérie LANDON |
76,000 |
82,000 |
75,000 |
76,000 |
|
% fixed part |
29% |
- |
29% |
- |
|
% variable part |
71% |
- |
71% |
- |
|
Jean-Bernard LÉVY |
86,500 |
- |
77,500 |
86,500 |
|
% fixed part |
34% |
- |
35% |
- |
|
% variable part |
66% |
- |
65% |
- |
|
Yan MEI |
48,000 |
42,000 |
57,000 |
48,000 |
|
% fixed part |
25% |
- |
21% |
- |
|
% variable part |
75% |
- |
79% |
- |
|
Denis MERCIER |
77,500 |
61,500 |
89,500 |
77,500 |
|
% fixed part |
31% |
- |
30% |
- |
|
% variable part |
69% |
- |
70% |
- |
|
Peter MERTENS |
73,500 |
62,000 |
84,500 |
73,500 |
|
% fixed part |
30% |
- |
26% |
- |
|
% variable part |
70% |
- |
74% |
- |
|
Robert PEUGEOT/PEUGEOT 1810(4) |
99,167 |
59,000 |
77,000 |
99,167 |
|
% fixed part |
33% |
- |
29% |
- |
|
% variable part |
67% |
- |
71% |
- |
|
Emmanuel PIOCHE |
76,000 |
64,000 |
75,000 |
76,000 |
|
% fixed part |
29% |
- |
29% |
- |
|
% variable part |
71% |
- |
71% |
- |
|
Total |
864,629 |
703,000 |
885,045 |
864,629 |
|
% fixed part |
31% |
- |
28% |
- |
|
% variable part |
69% |
- |
72% |
- |
|
(1) The amount of the variable part includes, for Board members not residing in France, the additional allowance intended to take into account geographic distance for any physical attendance at a meeting of the Board of Directors. (2) Amount paid in respect of the 2020 fiscal year. (3) Amount paid in respect of the 2021 fiscal year. (4) Robert PEUGEOT was an individual Board member until May 31, 2021, then became, from that date, permanent representative of PEUGEOT 1810, a Board member. On demand of PEUGEOT 1810, the compensation for the functions of Board member due to PEUGEOT 1810 was paid to Robert PEUGEOT. |
|
The compensation granted to the Board members for the 2022 fiscal year is stable, with the number of meetings of the Board of Directors and its Committees organized in 2022 remaining high, in particular given the refinancing of the acquisition of HELLA and the difficult economic environment.
The relative proportion between the fixed and variable portion of compensation allocated to Board members in respect of the 2022 fiscal year is as follows: 28% for the fixed part and 72% for the variable part.
Board members (non-executive corporate officers) received no other compensation from the Company or any company within the consolidation scope as per Article L. 233-16 of the French Commercial Code.
Finally, it is stipulated that as the Board of Directors is composed in accordance with the provisions of the first paragraph of Article L. 225-18-1 of the French Commercial Code, the payment of the compensation allocated to the Board members has not been suspended.
3.3.3.Compensation of the Group’s operational management for the 2022 fiscal year
3.3.3.1.Executive Committee
The total amount of compensation paid during the 2022 fiscal year to the Executive Committee members in office as of December 31, 2022 (including the Chief Executive Officer), amounts to €12,951,967.
The compensation of the Executive Committee members, excluding the Chief Executive Officer, includes a variable bonus. Performing on target can result in a bonus worth 65% of the base salary. Should targets be exceeded, this percentage can rise to 118.63% of the base salary.
In 2022, a criterion linked to the Group’s carbon neutrality objective was included in the short-term variable part. From now on, at target level, the variable system is composed of a part based on financial performance criteria, accounting for 50%, and a part based on the reduction in CO2 emissions for 15%, and a set of individual performance criteria, accounting for 35%. The financial performance criteria (50%) relate to net debt / EBITDA for the Group criterion, and operating income and cash flow assessed (i) for the Business Groups or regions at direct scope of responsibility for 80%, and (ii) at Group level for 20%. For the functional departments, these criteria are assessed in full at Group level.
If the employment contract of an Executive Committee member (excluding the Chief Executive Officer) is terminated by the employer, he or she may receive contractual termination payment of up to 12 months’ compensation, in addition to legal and collective bargaining agreement indemnities, depending on the position held. This amount is not payable in the event of gross or serious misconduct.
Members of the Executive Committee also benefit from the performance share plans granted by the Board of Directors. At December 31, 2022, Plans Nos. 11, 12, 13 and 14, and the ESPI Plan, were granted and not yet vested. They were granted by decision of the Board of Directors of October 9, 2019, October 22, 2020, July 23, 2021, October 25, 2021 and July 28, 2022. The Board of Directors’ meeting of October 12, 2017 decided that starting with plan No. 6 and for all plans established subsequently, all Executive Committee members must retain at least 20% of the shares acquired under each plan. This requirement of a percentage threshold for each plan will cease to apply once the Executive Committee member in question holds a number of shares that corresponds to one year of base gross compensation, factoring in all the shares owned icluding shares resulting from plans already established, and it will again become applicable in the event that the member no longer holds the target number of shares corresponding to one year of base gross compensation. In any event, this ownership requirement will no longer apply when the Executive Committee member in question steps down from the Committee (the provisions applicable to the Chief Executive Officer are described in Section 3.3.1.2.2.3 “Performance shares” of this Registration Document).
3.3.3.2.Group Leadership Committee
The members of Faurecia’s Group Leadership Committee have an interest in the short-term results, through a variable system of target bonuses.
The financial performance criteria (50%) relate to the operating margin and cash flow (i) at direct scope of responsibility (Business Groups or regions) for 80% and (ii) at the scope of responsibility immediately above for 20%. For the functional departments, these criteria are assessed in full at Group level, the financial criterion for the Group level being the ratio of net debt to EBITDA.
In 2022, a criterion linked to the Group’s carbon neutrality objective has been included in the short-term variable part. Consequently, from now on, at target level, the variable system is composed of a part based on financial performance criteria, accounting for 50%, a part based on the reduction of CO2 emissions for 15%, and individual performance criteria, accounting for 35%.
The members of the Group Leadership Committee also benefit from the performance share plan instituted by the Board of Directors, according to the same terms and conditions as the members of the Executive Committee (see Section 3.3.3.1 “Executive Committee” above).
3.3.4.Compensation policy for corporate officers and implementation for 2023
3.3.4.1.Compensation policy for corporate officers
The compensation policy described below is established in accordance with the provisions of Article L. 22-10-8 of the French Commercial Code and takes into account the principles of the AFEP-MEDEF Code in its revised version of December 20, 2022.
The compensation policy for corporate officers is set by the Board of Directors, on the recommendation of the Compensation Committee, which at the date of this Universal Registration Document is composed solely of independent directors (excluding the Board member representing employees).
In the context of a competitive and globalized market, the Board of Directors ensures the competitiveness of the compensation offered and relies for this purpose on the performance of comparative studies, notably conducted by specialized external consultants. The Board of Directors seeks, as far as possible, to align the structure of the Chief Executive Officer’s compensation with that of the Executive Committee members and of the Group Leadership Committee members.
Finally, the Board of Directors pays close attention to the transparency of information relating to the structure and description of the rules provided in the compensation policy.
3.3.4.1.1.Compensation policy for Board members
The General Meeting sets the maximum total annual amount that may be allocated to Board members on the proposal of the Board of Directors.
To determine the level of the annual fixed amount requested at the General Meeting, the Board of Directors performs market analysis and benchmarks on the compensation of Board members in comparable companies in France and Europe and takes into account the compensation forecast, anticipated changes in the composition of the Board of Directors and any special events (establishment of an ad hoc Committee, etc.). The benchmark assessment also applies to the determination of the distribution methods and its implementation.
The Board of Directors ensures that the amount of compensation proposed to the General Meeting reflects the level of responsibility assumed by the Board members and the time they need to devote to their duties.
The Board of Directors, on the proposal of the Compensation Committee and in accordance with the principles below, allocates the amount of this maximum annual budget among the Board members as follows:
- ■a fixed portion, in consideration of their duties as a Board member and, where applicable, as a member or Chairman of a Committee, it being specified that this portion is prorated for the members who joined or left the Board of Directors during the year; and
- ■a predominant variable part based on their actual attendance at meetings of the Board and, where applicable, of the Committee(s) of which they are members.
Board members not residing in France receive an additional amount intended to take into account geographic distance for any physical attendance at a meeting of the Board of Directors (it being specified that this amount may be exceptionally awarded to Board members residing in France when a meeting takes place abroad). When the Board members attend a meeting of the Board of Directors by videoconference or conference call, this additional amount is not paid.
The rules for the distribution of Board members’ compensation may also apply to any ad hoc committee of Board members that may be established to respond to any subject that the Board of Directors considers useful or necessary to follow up on or develop further in the exercise of its missions. The same applies to any seminar which would be organized by the Board of Directors.
Board members representing employees receive compensation under the same conditions and according to the same terms as any other Board member, it being specified that they also receive compensation under their employment contract within the Faurecia group.
In accordance with best governance practices, executive and non-executive corporate officers do not receive compensation for their duties of Board member of Faurecia.
In the event that the maximum amount of the annual fixed amount allocated by the General Meeting is exceeded, provision has been made to apply a reduction coefficient to the amount received by the Board members calculated as follows: (compensation owed to a Board member/total amount of compensation owed) x maximum amount of the fixed annual amount approved by the General Meeting.
In the event of a decision by the Board of Directors to entrust any Board member with a specific task or assignment, he may receive exceptional compensation whose amount will be proportionate to this task or assignment and in accordance with market practices.
Finally, each Board member is entitled to reimbursement, upon presentation of supporting documentation, for traveling expenses incurred by him in the exercise of his duties, within the limits of the ceilings stated by the applicable company policy.
3.3.4.1.2.Compensation policy for the Chairman of the Board of Directors
The Board of Directors ensures that the compensation of the Chairman of the Board of Directors is adapted to the missions entrusted to him, consistent with best market practices and aligned with the interests of all stakeholders in the Company’s business.
The compensation of the Chairman of the Board of Directors is made up of fixed compensation and benefits in kind, to the exclusion of any other compensation components.
Fixed compensation
The fixed annual compensation is the only component of compensation of the Chairman of the Board of Directors, excluding any other compensation (except for benefits in kind and social protection).
The fixed compensation of the Chairman of the Board of Directors is intended to compensate for the responsibilities and duties attached to this corporate office. The determination of the amount of that compensation also takes into account the skills and experiences of the beneficiary and is based on a comparative study issued by an external consultant on the basis of a sample of French listed companies with a separate governance structure.
The Board of Directors has not set any rules regarding the frequency at which the fixed compensation of the Chairman of the Board of Directors is reviewed; however, it is understood that in practice the Board of Directors reviews this compensation regularly. A review may take place during the term of the corporate office in the event of evolution in the range of responsibilities of that function or of the Company or even in relation to market practices.
Other components of compensation
The Chairman of the Board of Directors receives certain benefits in kind, as well as the medical / life / disability insurance plan set up within the Company.
3.3.4.1.3.Compensation policy for the Chief Executive Officer
Pursuant to the recommendations of the AFEP-MEDEF Code, the principles and rules applicable to the determination of the Chief Executive Officer’s compensation are approved by the Board of Directors on the proposal of the Compensation Committee.
The Board of Directors ensures that the compensation policy is adapted to the Company’s strategy and the context in which it operates while ensuring that the compensation of the Chief Executive Officer takes into account social responsibility and environmental (CSR) issues, in particular those relating to carbon neutrality, a strategic priority for the Group.
It also ensures it is in accordance with its corporate interest and that its objective is to contribute to the business strategy and sustainability of the Company and to promote its performance and competitiveness over the medium and long terms.
These objectives are reflected in the determination of stable and long-term compensation structures adapted to the relevant corporate officers in accordance with market practices and, for the Chief Executive Officer, with a major portion of his compensation based on performance criteria related to the implementation of strategy the achievement of which benefits all stakeholders. These elements must also make it possible to attract, retain and retain the Chief Executive Officer.
Fixed annual compensation
The purpose of the fixed compensation of the Chief Executive Officer is to compensate his or her responsibilities and duties. The amount of compensation is also set taking into account the beneficiary’s skills and experience.
The Board of Directors has not set any rules regarding the frequency at which the fixed compensation of the Chief Executive Officer is reviewed; however, it is understood that in practice the Board of Directors reviews this compensation regularly.
The fixed compensation acts as a reference in determining the variable annual compensation percentage and for the valuation of performance shares.
Variable annual compensation
The variable annual compensation is based on quantifiable criteria, which are predominant, and qualitative criteria, it being understood that the award of variable compensation subject to performance criteria is not reserved solely for the Chief Executive Officer. The choice of performance criteria, whether quantifiable or qualitative, is notably led by (i) the search for continuous improvement in the Company’s financial and operational performance and (ii) the consideration of strategic aspects and corporate and social responsibility issues. In this way, they contribute to the compensation policy objectives. These criteria are regularly reviewed and may be modified from time to time in order to continue to fully meet the objectives of the compensation policy.
The Chief Executive Officer’s variable compensation may range from 0% to 180% of his fixed annual compensation depending on the achievement of quantifiable criteria for 75% and individual criteria for 25%.
The Board of Directors sets every year one or several qualitative criteria, which number generally ranges from one to four. They cover strategic, business development and managerial objectives and/or objectives in line with the Group’s values. A weighting is assigned to each, and they are related, where possible, to quantifiable indicators. Qualitative criteria may sometimes not be made public for confidentiality reasons. The achievement of the targets for these criteria are assessed annually by the Board of Directors, on the recommendation of the Compensation Committee, on the basis of objective information mainly stemming from internal and external documents evidencing the potential achievement of these targets.
Long-term compensation in the form of performance shares
The maximum amount of performance share grants can represent no more than 250% of the fixed annual compensation of the Chief Executive Officer at the grant date.
The Company’s performance share granting policy is based on long-term, simple and transparent principles. Therefore:
- ■performance share grants are subject to internal and external performance conditions as well as a presence condition applicable to all French and foreign plan beneficiaries (5);
- ■the vesting period applicable to the plans is four years as from their grant date for all French and foreign plan beneficiaries; the plans include no holding period. It is, however, stated that the Chief Executive Officer must hold a minimum of 30% of the shares acquired from each plan. This threshold requirement ceases to apply when the Chief Executive Officer holds a number of shares corresponding to three years of base gross compensation, factoring in all the previously established plans, and becomes applicable again if the Chief Executive Officer no longer holds the number of target shares corresponding to this level of base gross compensation.
- ■the number of shares attributable under each plan is determined using an external benchmark. In any event, the final grant is dependent on the achievement of performance and attendance conditions.
The fulfillment of these conditions is assessed by the Board of Directors, on the proposal of the Compensation Committee.
The Chief Executive Officer makes a formal commitment not to hedge risks on performance shares granted to him.
Share-based compensation, which is based on both internal and external performance conditions, enables to strengthen the Chief Executive Officer’s loyalty and to focus his actions on the long term while at the same time aligning his interests with the interests of the Company and its shareholders. It thus contributes to the compensation policy objectives.
The Company’s long-term compensation practices are reexamined on a regular basis to ensure their compliance with best market practices.
Pension schemes
The Chief Executive Officer benefits from the same pension scheme as the one provided for the other members of the Group’s Executive Committee with a French contract.
This plan includes a supplementary defined contributions pension scheme, which benefits to all Group’s executives in France, and a supplementary defined benefits pension scheme.
Supplementary defined-contribution pension scheme
The Chief Executive Officer is a beneficiary of the defined contribution pension scheme (Article 83 of the French General Tax Code), open to all Group executives in France with at least one year’s seniority at the time of retirement.
Supplementary defined-benefits pension scheme (Article L. 137-11-2 of the French Social Security Code) subject to performance conditions
Faurecia has set up a grandfathering pension plan that complies with the new legal requirements set out in Article L. 137-11-2 of the French Social Security Code that has the following characteristics:
- ■eligibility conditions and other conditions for entitlement:
- ■being a member of Faurecia’s Executive Committee,
- ■with a current or suspended employment contract or a corporate office in France,
- ■rights definitively vested after three years on Faurecia’s Executive Committee;
- ■reference salary equal to the gross salary (base and variable, excluding exceptional items) received during the year of membership of the Executive Committee;
- ■rate of vesting: 0% to 3% of the annual reference salary depending on the achievement of performance conditions;
- ■enhanced performance conditions conditioning the vesting of rights and under which, below a minimum target, no vested rights may be granted.
- If the level of achievement of one of the performance conditions is lower than 75%, no right can be granted for the given year;
- ■Cap on rights acquired under the plan covered by Article L. 137-11-2: 30 points;
- ■Furthermore, given that the current Chief Executive Officer is the beneficiary of rights provided by other supplementary plans offered by the Group (including the defined-benefit pension scheme and the PAPP), the aggregate amount of rights under these plans and the plans governed by Article L. 137-11-2 of the French Social Security Code in force within Faurecia are capped as follows:
- ■the sum of pensions under the new scheme and other supplementary plans offered by the Group (including the PAPP) is limited to eight times the Annual Social Security ceilings (€351,936 in 2023),
- ■the sum of the rights acquired under the new scheme and the other supplementary schemes provided by the Group (including the PAPP), may not exceed 25% of the average annual reference compensation received during the last three calendar years preceding the date of cessation of activity or the departure from the Executive Committee if this is earlier,
- ■the annual amount of the total retirement pensions paid under the compulsory plans (basic state plan and supplementary AGIRC-ARRCO plan) and Faurecia group’s specific plans may not exceed 45% of the average annual gross reference salary received during the last three calendar years preceding the date of the cessation of activity or the departure from the Executive Committee, whichever occurs earlier.
- If one of these ceilings is exceeded, rights under the conditional pension scheme PAPP 1 will be reduced by the same amount so that the cumulative amount of pensions does not exceed one of the ceilings described above. However, the application of these ceilings may not, under any circumstances, reduce the rights vested after January 1, 2020 under the PAPP 2 plan;
2 / The Chief Executive Officer is also eligible for the defined-benefit plan applicable to all employees contributing to tranche C with a cash compensation greater than or equal to €175,968 (Tranche C), the main characteristics of which are as follows: future entitlements are acquired immediately, on the basis of the annual reference salary, which is equal to the portion of the gross annual compensation between 4 and 8 multiples of PASS.
It is specified that for the Chief Executive Officer and in accordance with the provisions of Article L. 137-11-2 of the French Social Security Code, the annual vesting of rights is subject to the achievement of a performance condition linked to the level of achievement of the variable annual compensation (FVC) targets.
Termination payment
The Board of Directors may decide to grant the Chief Executive Officer a termination payment subject to performance conditions and dependent on conditions compliant with the AFEP-MEDEF Code.
Non-compete, non-solicitation, non-poaching and prior notice covenants
Given the nature of the Chief Executive Officer’s duties and the responsibilities entrusted to him and for the sole purpose of protecting the Company’s legitimate interests, a non-compete covenant may be put in place for the Chief Executive Officer in the following conditions.
Benefits in kind, social protection and other compensation items
It is also stipulated that he benefits from the medical/life/disability insurance scheme established within the Company.
He does not receive any compensation for his office as a member of the Board of Directors of Faurecia.
3.3.4.1.4.Potential change in governance and circumstances
Change of governance
To the extent a new Chairman of the Board of Directors (separate from the CEO) or a new Board member is appointed, the compensation policies for the Chairman of the Board of Directors and the Board members, respectively, described above would apply to them.
To the extent a new Chief Executive Officer or one or more Deputy Chief Executive Officers would be appointed, the compensation policy for the Chief Executive Officer as described above would apply to them. The Board of Directors, on the recommendation of the Compensation Committee, would then, by adapting them to the parties concerned, set the amount of the fixed annual compensation, as well as the other components of the compensation, in particular the objectives, performance levels, parameters, structure and maximum percentages, in relation to their fixed annual compensation.
Exceptional exemption from the compensation policy
In accordance with Article L. 22-10-8 III paragraph 2 of the French Commercial Code, in the event of exceptional circumstances, the Board of Directors may waive the application of the compensation policy if this exemption is temporary, in accordance with the Company’s interest and necessary to guarantee the sustainability or viability of the Company.
This option can only be used by the Board of Directors, upon proposal from the Compensation Committee, in the event of exceptional circumstances resulting from an unexpected change in the competitive environment, a significant change in the Group’s scope following a merger or sale, the acquisition or creation of a significant new business activity or the suppression of a significant business activity, a change in accounting method or a major event affecting the markets and/or the Group’s business sector.
This exemption makes it possible to adjust the variable compensation (annual and long-term) (as well as the performance conditions relating to the supplementary defined-benefit pension) of the Chief Executive Officer. Exceptionally, this adjustment may affect, both upward and downward, one or several criteria (including adding or substituting new criteria) and/or their respective weighting and/or objectives of the criteria of the Chief Executive Officer’s variable compensation (annual and long-term) so as to make sure this compensation reflects both the Chief Executive Officer’s and the Group’s performance.
Any decision on derogation must be temporary and duly motivated. It will necessarily have to maintain the alignment of the interests of shareholders and of the management.
Resolutions submitted to the General Meeting
The resolutions relating to the compensation policy for corporate officers that will be submitted to the General Meeting of May 30, 2023 will be included in the prior notice, which will be published in the Bulletin des Annonces Légales Obligatoires and which will also be available on the Company’s website.
3.3.4.2.Implementation in 2023
3.3.4.2.1.IMPLEMENTATION OF THE 2023 COMPENSATION POLICY for the Chairman of the Board of Directors
On the recommendation of the Compensation Committee, the Board of Directors, at its meeting of February 17, 2023, decided that the Chairman of the Board of Directors would benefit, for 2023, from all the compensation components provided for in the compensation policy for 2023.
Fixed annual compensation
The Chairman of the Board of Directors benefits from a fixed annual compensation under the terms set out in the compensation policy.
The Board of Directors, on the recommendation of the Compensation Committee, decided to maintain the Chairman’s compensation unchanged at €300,000, it being specified that this ceiling includes, since 2019, the amount of the benefits in kind corresponding to the time during which the personal assistant is made available to the Chairman for activities other than those relating to his chairmanship of Faurecia.
Benefits in kind and social protection
The Chairman of the Board of Directors receives benefits in kind (the provision of a personal assistant for his activities other than those relating to the Chairmanship of Faurecia and the provision of a vehicle) as well as social protection according to the terms set out in the compensation policy.
3.3.4.2.2.IMPLEMENTATION OF THE 2023 COMPENSATION POLICY for the Chief Executive Officer
On the recommendation of the Compensation Committee, the Board of Directors, in its meeting held on February 17, 2023 decided that the Chief Executive Officer would receive, for 2023, the compensation items provided for in the 2023 compensation policy.
The level of fixed annual compensation, as well as the maximum levels of annual variable compensation and long-term variable compensation achievable and applicable in 2023 would remain unchanged compared to 2022.
The system adopted for 2023 by the Board of Directors in application of the compensation policy is summarized in the graph below. Details for each type of compensation are shown at the end of this graph.
- ■Compared to the companies in the reference group of the European comparative study conducted for the Board of Directors in 2023, the total compensation of the Chief Executive Officer for 2023 would be, if the objectives/conditions (“targets achieved”) are met, 7% above the median and 8% below the 75th percentile of the companies in the reference group. In the current volatile economic context (in particular, in the automotive industry), the total compensation of the Chief Executive Officer, being largely performance-related, is therefore competitive.
Fixed annual compensation
The Chief Executive Officer benefits from a fixed annual compensation under the terms set out in the compensation policy. This fixed annual compensation was set at €1,100,000 for 2023. It remains unchanged compared to 2022.
Variable annual compensation
The Board of Directors, on the recommendation of the Compensation Committee, has set, in accordance with the terms of the compensation policy, the ceiling for the variable annual compensation for 2023 at 180% of the fixed annual compensation of the Chief Executive Officer, which remains unchanged compared to 2022.
The table below sets out the quantifiable and qualitative criteria for the variable annual compensation for the 2023 fiscal year:
Performance criteria |
Percentage of the annual fixed compensation at target |
Percentage of the annual fixed compensation at maximum |
---|---|---|
|
75% |
142.5%(1) |
Financial quantifiable criteria including: FORVIA net-debt-to-EBITDA ratio Synergies relating to HELLA integration |
60% 50% 10% |
114% 95% 19% |
Quantifiable environmental criterion related to the reduction of CO2 emissions |
15% |
28.5% |
Individual criteria |
25% |
37.5%(2) |
Total |
100% |
180% |
(1) The quantifiable criteria represent 75% of the fixed annual compensation at target and up to 142.5% at maximum, as performance overachievement is capped at 190% of the target value of the quantifiable criteria. (2) The individual criteria represent 25% of the fixed annual compensation at target and up to 37.5% at maximum, as performance overachievement is capped at 150% of the target value of the individual criteria. |
- ■The financial quantifiable criteria relate to the net-debt-to-EBITDA ratio and to the synergies relating to HELLA integration. The objectives are set by the Board of Directors in relation to the Group’s deleveraging trajectory post-acquisition of HELLA and the integration plan for HELLA (it being specified that the numerical objectives may be updated by the Board of Directors to take into account any major event affecting the markets and/or the Group’s business sector);
- ■Given the strategic importance of contributing to the reduction of greenhouse gas emissions, the Board of Directors has incorporated a quantifiable environmental criterion relating to carbon neutrality (the objectives of which are in line with the Group's trajectory in this area), measured at the level of the consolidated Group, in the variable annual compensation of the General director. This criterion is relating to a CO2 emission reduction (measured in terms of "tCO2e" for "scopes 1&2" per million euros of product sales on the Group perimeter). In 2022, this criterion has been also added to the annual variable compensation of all eligible Group employees, i.e., 4,800 employees, in order to mobilize all the Group’s resources towards the achievement of the objectives set.
The expected levels of achievement of these criteria are determined by the Board of Directors but are not made public for confidentiality reasons. Exceptionally, the expected levels of achievement of the environmental criterion relating to carbon neutrality for 2023 will be communicated a posteriori in 2024, at the same time as the actual achievement rate.
The achievement of the objectives of the criteria is assessed annually by the Board of Directors, after review by the Compensation Committee, (i) on the basis of the consolidated financial statements approved by the Board of Directors and synergies achieved in the context of the HELLA integration for the financial criteria, and (ii) on the basis of a calculation made by a leading international audit firm, based on data collected by the Group, and verified by an independent third party, for the environmental criteria relating to carbon neutrality.
Performance shares grant
The Chief Executive Officer will benefit from a grant of performance shares according to the terms provided for in the compensation policy.
The Board of Directors analyzed at its meeting of July 28, 2022 a comparative study on long-term compensation plans in practice within European groups. This study was based on the practices of European industrial companies of comparable size and, among them, on those of the members of the comparison group used for the levels and structures of the remuneration of the Chief Executive Officer.
This study shows that the trend for the surveyed companies is to opt for a single long-term compensation vehicle, mostly around the granting of share plans subject to performance conditions. The majority of companies use more than three performance criteria, both internal and external, at least two internal financial criteria and have increased the weight of ESG criteria in the total weighting in recent years.
The Board of Directors, on the recommendation of the Compensation Committee, decided on July 28, 2022 to award performance share plan No. 14, based on the results of the study, and consequently by increasing the relative share of ESG criteria (25% of the total weighting) within the internal performance criteria. This change was not applicable to the Chief Executive Officer in order to comply with the 2022 compensation policy.
It is therefore proposed that the Chief Executive Officer benefits for the 2023 financial year from an allocation of performance shares according to the performance conditions aligned with those of the other beneficiaries, which are as follows for 2023:
- ■for a relative weight of 20% based on an internal condition linked to the Group’s operating income. This internal condition will be measured by comparing the operating income for the third fiscal year ended after the grant date of the performance shares (i.e., 2025 fiscal year) with the objectives set by the Board of Directors in the strategic plan covering the fiscal year considered;
- ■for a relative weight of 25% based on an internal condition linked to the Group’s net cash flow. This internal condition will be measured by comparing the net cash flow for the third fiscal year ended after the grant date of the performance shares (i.e., 2025 fiscal year) with the objectives set by the Board of Directors in the strategic plan covering the fiscal year in question;
- ■for a relative weight of 10% based on an internal performance condition related to the gender diversity within the Group’s “Managers and Professionals” category. This internal condition is assessed by comparing the effective percentage of women in the "Managers and Professionals" category in the third fiscal year after the grant date of the performance shares (i.e., 2025 fiscal year) with the target percentage set by the Board of Directors;
- ■for a relative weight of 15% based on an internal condition linked to the reduction of CO2 emissions. This internal condition will be measured in “tCO2e” for “scopes 1 & 2” per million euros of sales produced within the consolidated Group scope compared to CO2 emissions in 2019 (adjusted for scope effects);
- ■for a relative weight of 30% based on an external performance condition, i.e., growth of the Company’s net earnings per share assessed between the last fiscal year before the grant date of the performance shares (i.e., 2022 fiscal year) and the third fiscal year ended after the grant date of the performance shares (i.e. 2025 fiscal year). This condition is assessed against the weighted growth of a reference group made up of comparable international automotive suppliers over the same fiscal year.
The reference group is composed of the following European and North American automotive suppliers: Adient (Ireland/USA), Aptiv (formerly Delphi) (USA), Autoliv (Sweden), Autoneum (Switzerland), Borg Warner (USA), Continental (Germany), Lear (USA), Magna (Canada), Plastic Omnium (France), Schaeffler (Germany), Tenneco (USA) and Valeo (France).
This group is intended to be stable over time and may be modified only in the event of significant evolution concerning one of its constituents, in particular in the event of a takeover, merger, de-merger, absorption, dissolution, disappearance or change in business, subject to maintaining the overall consistency of the reference group and enabling an external performance condition consistent with the external performance objective set for the grant to be applied.
The achievement of these conditions will be assessed by the Board of Directors, on the recommendation of the Compensation Committee, on the basis of (i) the consolidated financial statements approved by the Board of Directors (and after necessary restatements) for internal conditions related to operating income and the Group’s net cash flow, (ii) the Faurecia group’s human resources reporting for the internal condition related to gender diversity, (iii) a calculation carried out by a leading international audit firm, based on data collected by the Group, and verified by an independent third party, for the internal environmental condition relating to the reduction of CO2 emissions, and (iv) a calculation carried out by an external service provider specializing in compensation based on the consolidated financial statements approved by the competent bodies of the Group reference companies and by Faurecia, for the external condition relating to net income per share.
The architecture of the performance share plans is further detailed in Chapter 5 “Capital stock and shareholding structure”, Section 5.2.2 “Potential capital” of this Universal Registration Document.
An equivalent adjustment mecanism to the one implemented in plan No. 14 in case of deviation in the global automobile production volumes may be included in the future plan.
Pension schemes
The Chief Executive Officer benefits from defined-contribution and defined-benefits pension schemes provided for by the compensation policy.
The performance conditions related to the acquisition of pension rights in the frame of the PAPP2 pension scheme will be aligned, for all beneficiaries, on the annual criteria applicable to the annual variable remuneration of the Chief Executive Officer from 2023 ownards.
- ■based on the Group net debt to EBITDA ratio:
- ■1.5% if the net debt to EBITDA ratio for the year is strictly greater than 100% of the set objective,
- ■1.0% if the net debt to EBITDA ratio for the year is strictly greater than 90% and less than or equal to 100% of the set objective,
- ■0.5% if the net debt to EBITDA ratio for the year is strictly greater than or equal to 75% and strictly lower than 90% of the set objective,
- ■0% if if the net debt to EBITDA ratio for the year is strictly lower than 75% of the set objective;
- ■based on the synergies in relation to HELLA integration:
- ■0.3% if the amount of synergies in relation to HELLA integration is strictly greater than 100% of the set objective,
- ■0.2% if the amount of synergies in relation to HELLA integration is strictly greater than 90% and less than or equal to 100% of the set objective,
- ■0.1% if the amount of synergies in relation to HELLA integration is greater than or equal to 75% and strictly lower than 90% of the set objective,
- ■0% if if the amount of synergies in relation to HELLA integration is strictly lower than 75% of the set objective;
- ■based on the CO2 Carbon neutrality:
- ■0.45% if the reduction of CO2 emissions is strictly greater than 100% of the set objective,
- ■0.3% if the reduction of CO2 emissions is strictly greater than 90% and less than or equal to 100% of the set objective,
- ■0.15% if the reduction of CO2 emissions is greater than or equal to 75% and strictly lower than 90% of the set objective,
- ■0% if if the reduction of CO2 emissions is strictly lower than 75% of the set objective;
- ■based on the achievement of the individual objectives composing the individual part of the variable annual compensation (FVC):
- ■0.75% if the achievement of the individual objectives is strictly greater than 100%,
- ■0.5% if the achievement of the individual objectives is strictly greater than 90% and less than or equal to 100%,
- ■0.1% if the achievement of the individual objectives is greater than or equal to 75% and stricly lower than 90%,
- ■0% if if the achievement of the individual objectives is stricly lower than 75%.
Since January 1st, 2021, the conditions for the acquisition of pension rights for the Chief Executive Officer under the defined-benefit pension scheme applicable to all employees contributing in tranche C are as follows:
- ■0.75% of vesting of pension rights if the level of achievement of the variable annual compensation targets (FVC) for the year is strictly greater than 100%,
- ■0.55% of vesting of pension rights if the level of achievement of the variable annual compensation targets (FVC) for the year is strictly greater than 95% and strictly lower than 100%,
- ■0.35% of vesting of pension rights if the level of achievement of the variable annual compensation targets (FVC) for the year is strictly greater than 75% and strictly less than 95%,
- ■no pension rights are acquired if the level of achievement of the variable annual compensation targets (FVC) for the year is strictly less than 75%.
The maximum yearly rights may not exceed €1,319 (i.e. 0.75% of the difference between €351,936 and €175,968). In any case, the sum of the vested rights stipulated under tranche C2 and PAPP 2 will not exceed 3% of annual compensation, in line with French regulations.
The financing of the regime will be external, with an insurance company to which yearly contributions will be paid by Faurecia.
Non-competition indemnity, prior notice and non-solicitation/non-poaching
Since June 26, 2020, the Chief Executive Officer is subject to a non-compete covenant in the event of his resignation with an indemnity, prior notice in case of resignation and a non-solicitation/non-poaching obligation in accordance with the terms set out in the compensation policy.
- ■In case of resignation, the Chief Executive Officer is bound by a non-compete covenant prohibiting him, for a period of 12 months following the termination date of his office, (i) from soliciting the Group’s customers or convincing such persons to terminate their business relationship with the Group, (ii) from exercising management, executive, administrative or supervisory duties as an employee or officer of a competitor company and (iii) from acquiring or holding shares (or other securities) representing more than 5% in the share capital of a competitor company.
- ■In consideration for this undertaking, the Chief Executive Officer may receive throughout the period of this undertaking, a monthly payment equal to half of the reference compensation (annual fixed and variable) paid with respect to the 12 months preceding the resignation.
- ■The Board of Directors may unilaterally waive the implementation of this undertaking, within 30 calendar days at the latest, upon the departure of the Chief Executive Officer (in which case the payment will not be due).
- ■The maximum overall payment amount that the Chief Executive Officer will be eligible to receive with respect to the non-competition and/or severance payment may not exceed 24 months of his Reference Compensation.
- ■In addition, in the event of the resignation of the Chief Executive Officer, the Board of Directors may decide that the latter must give six months’ notice. In this case, the resignation shall become effective at the expiration of the six-month notice period (starting from the date of notification of the resignation). The Board of Directors may waive or reduce such six-month notice period. In such a case, the notice period indemnity will be reduced accordingly to the effectively worked period.
- ■Lastly, the Chief Executive Officer is bound by a non-solicitation/non-poaching obligation for a period of 12 months from his departure date from the Group.
Termination payment
The Chief Executive Officer is entitled to a termination payment which was authorized by the Board of Directors on July 25, 2016 and approved by the General Meeting of May 30, 2017. It is specified that this was adjusted during the review of the Chief Executive Officer’s package by the Board of Directors on February 14, 2020 solely in order to align the methods for calculating the reference compensation with that of the non-compete clause, and approved in accordance with the law by the General Meeting of June 26, 2020. The terms of the termination payment have not changed since this last General Meeting.
As a reminder, the conditions for obtaining this compensation, which comply with the AFEP-MEDEF Code, are as follows:
- ■the payment is due in case of termination of the Chief Executive Officer’s term of office on the Company’s initiative, subject to his not being terminated due to serious or gross misconduct;
- ■the payment is not due in case of resignation or retirement;
- ■the payment is subject to the achievement of the following performance conditions:
- ■achievement of a positive operating income during each of the three fiscal years closed-out preceding the termination of the Chief Executive Officer’s term of office,
- ■achievement of a positive net cash flow during each of the three fiscal years closed-out preceding the termination of the Chief Executive Officer’s term of office;
- ■the payment is equal to 24 months of the reference compensation calculated on a total compensation basis (annual fixed and variable) paid with respect to the 12 months preceding the termination of his corporate office (the “Reference Compensation”). This payment is due if the two conditions described above are fulfilled in each of the three fiscal years concerned, which in practice amounts to the fulfillment of six criteria;
- ■should one of the six criteria not be met, the termination payment is reduced proportionally by 1/6 and may equal 0 should none of these six criteria be fulfilled;
- ■should the Chief Executive Officer’s term of office be shorter than three years, the method of calculating the termination payment is identical, but the number of criteria is adjusted to take into account the actual length of the term of office.
Benefits in kind, social protection and other compensation items
The Chief Executive Officer receives benefits in kind and social protection according to the terms set out in the compensation policy.
For information, it is indicated that Mr. Patrick Koller, Chief Executive Officer of the Company, receives compensation for his duties on the HELLA Shareholders’ Committee (for more information, please refer to the HELLA annual report). Such approach is in line with German corporate standard (notably for listed companies controlled by another listed company).
3.3.4.2.3.IMPLEMENTATION OF THE 2023 COMPENSATION POLICY for the Board members
3.4.Summary of compliance with the recommendations of the AFEP-MEDEF Code
The AFEP-MEDEF Code requires detailed reporting on the application of its recommendations and explanations to be provided, if applicable, as to why a company may not have implemented some of them. As of the end of the 2022 fiscal year, the Company did not entirely comply with the recommendations contained in the AFEP-MEDEF Code on the following issues.
AFEP-MEDEF Code recommendations |
|
Explanations – Practice followed by the Company |
---|---|---|
25.6.2 Supplementary defined-benefit pension schemes set out according to Article L. 137-11 of the French Social Security Code “These supplementary pension schemes are subject to the condition that the beneficiary is a corporate officer or employee of the Company at the time when they claim their pension rights in application of the rules in force. ” |
|
The eligibility of members of the Executive Committee, including the Chief Executive Officer, for the pension scheme whose rights have been frozen as of December 31, 2019, is subject to the obligation that they end their professional career within Faurecia. By way of exception to this principle, it seems justified, in the event of invalidity or termination by the Group from the age of 60, that the right to the frozen pension scheme should be maintained. In the event of termination by the Group, entitlement to the scheme is only maintained in the case that the beneficiary does not take on any other professional work. This provision must give the Company more flexibility in managing the departure of Executive Committee members from the age of 60. |
24.4 Conclusion of a non-competition agreement with an executive corporate officer “The Board also provides that the payment of the non-competition indemnity is excluded when the executive exercises their retirement rights. In any event, no indemnity may be paid beyond the age of 65. ” |
|
The Board of Directors, on the recommendation of the Compensation Committee, carried out an in-depth review of the structure and components of the Chief Executive Officer’s compensation in 2020 as part of the development of the compensation policy, and decided in particular to submit the Chief Executive Officer to a non-competition undertaking. This mechanism was approved, as part of the compensation policy for the Chief Executive Officer, by the General Meeting of June 26, 2020 under Resolution No. 16. The non-competition undertaking, which lasts 12 months, will apply in the event of the resignation of the Chief Executive Officer. In consideration for this undertaking, the Chief Executive Officer may receive throughout the period of this undertaking, a monthly payment equal to half of the reference compensation (annual fixed and variable) paid with respect to the 12 months preceding the resignation. The non-competition agreement does not expressly provide for a restriction on the payment of the indemnity when the person concerned claims his pension rights, as this principle is now provided for by law. In addition, the non-competition agreement does not provide for an age limit for the payment of the non-competition indemnity. The Board of Directors considers that this recommendation of an age limit is not compatible with the objective of protecting the Group’s interests, as the implementation of a non-competition undertaking is intended to protect the Group’s governance on a permanent basis against a departure of its executive to a competitor. Compensation for such an undertaking is customary and eliminating it beyond the age of 65, when many former executive directors continue to work after that age, does not seem to be in line with the objective of protection sought. The payment of this indemnity is not, however, automatic, as the Board of Directors reserves the right, in light of the circumstances that it will assess and on a discretionary basis, to apply or not apply the non-competition undertaking. If the Board of Directors waives the application of the non-competition undertaking, the non-competition indemnity will not be due to the Chief Executive Officer for the period waived by the Company. |
|
|
|
3.5.Shareholding by corporate officers and transactions in the Company’s securities
3.5.1.Shares held by corporate officers
Pursuant to the bylaws, each Board member must hold at least 20 Faurecia shares throughout the term of office.
Furthermore, the internal rules of the Board of Directors provide that each Board member must hold 500 shares in the Company, including 20 shares provided for in the bylaws, during the entire term of their corporate office. However, Board members who do not receive compensation in respect of their directorship are only required to hold 20 shares provided for in the bylaws and, in accordance with the law, Board members representing employees are not required to hold a minimum number of shares.
The internal rules of the Board of Directors’ also state that the Chairman of the Board of Directors must hold shares corresponding to one year’s compensation (including the 500 shares held as a Board member) and must comply with this obligation within two years of being appointed as Chairman.
At December 31, 2022, the corporate officers held approximately 3.3% of the Company’s capital stock and 3.5% of the voting rights (including 3.1% of the capital stock and 3.3% of the voting rights held by Peugeot 1810).
Details of the number of shares held by each corporate officer can be found in the summary table in Section 3.1.2.1 “General information on the composition of the Board of Directors” and in the biographies of the Board members in Section 3.1.2.2 “Board members’ expertise, positions and corporate offices as of the date of this Universal Registration Document”. It is apparent from this information that, as at December 31, 2022, the directors comply with the holding obligations laid down in the bylaws and internal rules.
3.5.2.Transactions in the Company’s securities by corporate officers
Since April 14, 2010, the Company has a Code of Conduct for Group employees and executives who have access to insider information by virtue of their positions and offices, with provisions on the management, ownership and disclosure of such information. This Code was amended, for the last time, by the Board of Directors during its meeting held on December 18, 2019. It is available on the governance page of the Company’s website (www.faurecia.com).
Under the measures to prevent insider trading within the Group, the Code provides, among others, for blackout periods that require corporate officers as well as persons who have regular or occasional access to accounting or financial information before publication to refrain from trading in Faurecia shares during certain periods surrounding the publication of interim results, annual results and quarterly sales. These periods are as follows:
- ■30 calendar days prior to the publication of the press release on annual or interim results, this period includes the date of publication;
- ■15 calendar days prior to the publication of the quarterly sales, this period includes the date of publication.
The Code also describes the disclosure requirements for securities transactions, which apply to persons with managerial responsibilities within the meaning of the EU Regulation on market abuse and to persons closely associated with them, and lists the transactions to be disclosed since the regulation entered into force. In accordance with the applicable regulations, corporate officers were informed of disclosure requirements for securities transactions applicable to them as well as to their close associates.
The Code also states that when there is any doubt relating to the information held, the persons concerned must inform the Group’s Chief Financial Officer who, in their capacity as compliance officer, will have 24 hours to offer an opinion on the planned transaction.
Lastly, the Code notes the obligation that corporate officers hold shares in registered form and, more generally, the sanctions for insider trading or disclosure of insider information.
The Company has set up an Insider Information Committee whose role is to identify and qualify insider information on a case-by-case basis, and then to decide whether or not to defer the publication of this information with regard to the applicable regulations, the positions and recommendations of the Autorité des Marchés Financiers (AMF) and the guidelines of the European Securities and Markets Authority.
The transactions performed during the fiscal year ended December 31, 2022 by corporate officers and their close relatives and who have been reported to the Autorité des Marchés Financiers (AMF), as well as the Company, in application of the applicable regulatory requirements, are presented in the table below:
Declarant |
References |
Financial instrument |
Number |
Transaction type |
Date of transaction |
Date of receipt of the declaration |
Transaction venue |
Unit price |
Amount of transaction |
Patrick KOLLER |
2022DD848864 |
Shares |
34,473 |
Acquisitions |
June 24, 2022 |
June 27, 2022 |
Euronext Paris |
€15.5000 |
€534,331.50 |
PEUGEOT 1810 (1) |
2022DD849132 |
Shares |
1,410,114 |
Acquisitions |
June 24, 2022 |
June 28, 2022 |
Euronext Paris |
€15.5000 |
€21,856,767 |
HELLA Stiftung GmbH(2) |
2022DD850693 |
Shares |
112,833 |
Acquisitions |
June 24, 2022 |
July 5, 2022 |
Euronext Paris |
€15.5000 |
€1,748,911.50 |
Jürgen BEHREND |
2022DD850696 |
Equities |
46,188 |
Acquisitions |
June 24, 2022 |
July 5, 2022 |
Euronext Paris |
€15.5000 |
€715,914 |
Michel |
2022DD850697 |
Equities |
6,621 |
Acquisitions |
June 24, 2022 |
July 5, 2022 |
Euronext Paris |
€15.5000 |
€102,625.50 |
(1) PEUGEOT 1810 became, as of May 31, 2021, a Board member of the Company and appointed Robert PEUGEOT as permanent representative. (2) Legal entity related to Mr. Jürgen BEHREND, Board member since June 1, 2022. |
3.6.Declarations of the members of the Board of Directors and Executive Management
Within the framework of an active conflict of interests management policy and to collect the information required under Annex 1 item 12 of European Regulation No. 2019/980, each year the Company provides its Board members with a detailed questionnaire allowing them to obtain the information required and thus make the necessary declarations.
To the Company’s knowledge and on the date this Universal Registration Document was drawn up, there is no family relationship between Faurecia’s corporate officers.
Moreover, to the Company’s knowledge and on the date this Universal Registration Document was drawn up, none of the members of the Board of Directors and Executive Management have, within the last five years:
- ■been found guilty of fraud;
- ■been incriminated by a statutory or regulatory authority (including designated professional bodies), with the exception of Jean-Bernard Lévy under the conditions described hereafter. Following an investigation from the Autorité des Marchés Financiers (AMF) in July 2016 concerning EDF’s financial information since July 1, 2013, objections were notified by the Board of the AMF to the Chairman and Chief Executive Officer of EDF on April 5, 2019. Jean-Bernard Lévy has been cleared by a decision, that has become final on this matter, from the Sanctions Commission of the AMF dated July 28, 2020;
- ■been publicly sanctioned by a statutory or regulatory authority (including designated professional bodies);
- ■been banned by a tribunal from serving as a member of an administrative, management or supervisory body or from being involved in the management of an issuer;
- ■been involved in a bankruptcy, receivership, liquidation, or receivership of companies having served as a member of an administrative, management or supervisory body.
To the Company’s knowledge and on the date this Universal Registration Document was drawn up, no potential conflicts of interest have been identified between the duties of each of the members of the Board of Directors and the Executive Management with regard to the Company and their private interests and/or other duties. It is specified that one Board member, Peter Mertens, has a minority interest in a start-up in which the Group has made a very small investment (less than 0.03% of the Group’s sales of the period during which the investment was made (2019)) and was appointed, in November 2019, as a Board member of this Company. It is noted that this investment was made prior to the effective appointment of Peter Mertens as a director of the Company, that the investment conditions are similar for all minority investors (including the Company), that the Company does not have voting rights on the Board of Directors of this start-up and that the decisions on this investment are not made at the level of the Board of Directors of the Company. In addition, in the event of a conflict of interest, the provisions of the rules of procedure on this subject will apply (for details of these rules, see Section 3.1.3.1 “Organization of the Board of Directors”, paragraph “Board members’ obligations”).
As part of the HELLA acquisition, Faurecia made a commitment for representation of the HELLA family pool on the Company’s Board of Directors. This commitment continues as long as the HELLA family pool holds at least 5% of the Company’s capital stock.
In accordance with the Investment Agreement of August 14, 2021 as subsequently amended, the HELLA family pool has undertaken not to sell:
- ■for a period of 18 months from the date of completion of the acquisition, i.e. until July 31, 2023, their shares held in the Company,
- ■during a period of 12 months as from the expiry of the preceding period described above, i.e. until July 31, 2024, more than 5% of Faurecia’s capital stock (as outstanding on July 31, 2023).
These lock-up commitments are subject to the usual exceptions in this respect, formalized in a contract under German law entered into between Faurecia and the members of the HELLA family pool on January 27, 2022 entitled the “Blocking Agreement”. Moreover, the Company has been informed of the execution by the HELLA family pool of a shareholders’ agreement constituting a concert action vis-à-vis Faurecia. This shareholders’ agreement also provides for preemptive rights to the benefit of the other members of the HELLA family pool on shares held by a member excluded from the shareholders’ agreement.
Lastly, to the Company’s knowledge and as of the date of this Universal Registration Document, there is no other restriction accepted by the members of the Board of Directors and senior management concerning the sale, in a certain period, of the Company’s shares they hold, with the exception of (i) the provisions of the bylaws or internal rules regarding shareholding (see Section 3.5.2 “Transactions in the Company’s securities by corporate officers” of this Universal Registration Document) and (ii) the holding obligation related to the allocation of performance shares to the Chief Executive Officer under the terms of which he must retain at least 30% of the shares actually acquired under each plan. This threshold requirement ceases to apply when the Chief Executive Officer holds a number of shares corresponding to three years of base gross compensation, factoring in all the previously established plans, and becomes applicable again if the Chief Executive Officer no longer holds the number of target shares corresponding to this level of base gross compensation.
3.7.Authorizations relating to sureties, endorsements and guarantees
In accordance with the law and bylaws, the Board of Directors can, within the limit of a total amount which its fixes, authorize the Chief Executive Officer to issue sureties, endorsements and guarantees on behalf of the Company.
In its meeting held on July 24, 2020, the Board of Directors authorized the Chief Executive Officer to issue sureties, endorsements and guarantees within the limits of a global amount of €50 million, up to a limit of €10 million per transaction, for a one-year period. If the Group is required to provide advance payment guarantees or performance bonds for contracts with successive partial deliveries, the Chief Executive Officer is authorized to provide guarantees representing a maximum of €5 million per transaction. It is specified that sureties, endorsements and guarantees provided to tax and customs regimes may be given without any limit on the amount.
3.8.Agreements
3.8.1.Related-party agreements
The Statutory Auditor’s special report on related-party agreements is included in Section 3.8.4 below. It does not mention any ongoing related-party agreements. In addition, as a reminder, no related-party agreement has been entered into during the last three fiscal years.
3.8.2.Procedure for assessing ordinary and normal agreements
In accordance with the applicable provisions, the Board of Directors of April 17, 2020 adopted, on the recommendation of the Governance and Nominations Committee (from now on named Governance, Nominations and Sustainability Committee), a procedure to assess ordinary agreements entered into under normal conditions (unregulated agreements) and regulated agreements.
This internal document formalized the procedure applicable to the identification and qualification of agreements prior to their conclusion or amendment. It sets out the role of the Legal department in this assessment process as well as the rules to be taken into account when examining these agreements. The methods used by the Governance, Nominations and Sustainability Committee and the Board of Directors to assess the procedure are also described. It is specified that, as far as possible, the person directly or indirectly affiliated with one of these agreements may not take part in its assessment.
The implementation during the 2022 fiscal year was reviewed by the Governance, Nominations and Sustainability Committee at its meeting of February 15, 2023 and presented to the Board of Directors at its meeting of February 17, 2023.
3.8.3.Service contracts
To the Company’s knowledge and on the date this Universal Registration Document was drawn up, there is no service contract linking a Board member with Faurecia or any of its subsidiaries.
3.8.4.Statutory Auditors’ special report on related-party agreements
In our capacity as Statutory Auditors of Faurecia, we hereby present to you our special report on related party agreements.
We are required to inform you, on the basis of the information provided to us, of the terms and conditions of those agreements indicated to us, or that we may have identified in the performance of our engagement, as well as the reasons justifying why they benefit the Company. We are not required to give our opinion as to whether they are beneficial or appropriate or to ascertain the existence of other agreements. It is your responsibility, in accordance with Article R. 225-31 of the French Commercial Code (Code de commerce), to assess the relevance of these agreements prior to their approval.
Where applicable, it is also our responsibility to provide you with the information required by Article R. 225-31 of the French Commercial Code (Code de commerce) in relation to the implementation during the year of agreements already approved by the General Meeting.
We performed those procedures which we deemed necessary in compliance with professional guidance issued by the French Institute of Statutory Auditors (Compagnie nationale des commissaires aux comptes) relating to this type of engagement. These procedures consisted in verifying that the information provided to us is consistent with the source documents from which it is derived.
Agreements submitted for approval to the General Meeting
In accordance with article L. 225-40 of the French Commercial Code (Code de commerce), we have been notified of the following related party agreements which received prior authorisation from your Board of Directors.
Under this license agreement, your company authorizes the company HELLA and its affiliates to use the name/brand "Forvia", the slogan "Inspiring mobility" and the related intellectual property rights.
The license agreement was authorized by your Board of directors on January 27th, 2022, and concluded on April 1st, 2022 free of charge for a period of one year. This one-year period may be extended subject to review of the financial terms of the license.
Your Board of Directors has justified this agreement as follows: This new name will help to create a common identity within the group and strebgthen the feeling for employees to belong to one and the same group.
Under the coordination agreement, your company and HELLA have established a legal framework for their future cooperation in the following areas:
- ■Accounting, financial, tax and legal reporting,
- ■Risk management,
- ■Financial communication,
- ■Faurecia and HELLA Group policies,
- ■Information sharing,
- ■Creation of joint committees, and
- ■Establishment of a mechanism for resolving potential conflicts regarding the Coordination Agreement and alignment on certain other relevant aspects.
The coordination agreement was authorized by your board of directors on February 18th, 2022, and concluded on September 14th, 2022. The agreement does not provide for any payments between the parties. However, if any of the measures relating to the proposed cooperation between the Faurecia Group and the HELLA Group were to result in costs or other charges at the company HELLA level, such costs would be included in the "dependency ratio" of the company HELLA and would be compensated by your company.
The coordination agreement has a fixed term of five years from the date of its conclusion and will be automatically renewed for consecutive two-year periods, unless terminated by any party no later than twelve months prior to the expiration of the relevant term. It will automatically terminate six months after the date on which Faurecia ceases to hold, directly or indirectly, at least forty percent of the shares of the company HELLA.
Your Board of Directors has justified this agreement as follows: The conclusion of the coordination agreement will constitute a step in the integration of your company and the company HELLA as envisaged, will contribute to the realization of potential synergies within the combined group and will promote a framework of legal certainty for both parties.
Agreements previously approved by the Annual General Meeting
3.9.Other Information
The table summarizing the current delegations of authority granted by the General Meeting in the area of capital increases and showing the use made of these delegations during the period is presented in Chapter 5, Section 5.2.1 “Authorized capital stock” of this Universal Registration Document.
The specific conditions governing shareholders’ participation in the General Meeting or the provisions of the bylaws which outline these conditions are included in Chapter 6, Section 6.1 “Legal information”.
Lastly, factors likely to affect a public takeover bid or exchange are described in Chapter 6, Section 6.1 “Legal information”.
4Non-Financial Performance
4.1.Corporate Social responsibility and Environmental strategy
Mobility is at the heart of major global challenges: urbanization, demographic growth, climate change, scarcity of resources and technological change. For FORVIA, mobility is more than just a means of transport. It occupies a central place in the lives of people, and must allow them to move freely while being respectful of the planet. This is why, as the seventh-largest automotive supplier in the world, FORVIA continues to grow by integrating sustainable development issues.
In 2022, FORVIA became the first global company in the automotive sector to be certified against the new SBTi standard Net-Zero. The Group is committed to achieving carbon neutrality by 2045 for all of its emissions. While sustainability and responsibility have been convictions shared by Faurecia and HELLA for many years, this pioneering certification is the marker of an ambitious and common sustainability strategy.
The Group’s goals are broken down into actions included in a CSR roadmap, called “Inspired to care”, with regularly monitored targets. It is based on major international reference frameworks, ongoing dialog with stakeholders and regulatory compliance. It motivates the 150,000 Group employees and its partners to embrace priority climate, ethical and product safety issues.
4.1.1.“Inspired to care”: The sustainable transformation strategy
4.1.1.1.Sustainable development convictions
FORVIA is convinced that it plays a key role and is able to bring about positive change in the face of major global challenges. The Group wants to have a positive impact on society and the planet and is committed to:
- ■reducing its CO2 footprint and offering sustainable mobility solutions;
- ■investing in technology and new business models;
- ■engaging in an open, responsible and balanced dialog with its stakeholders;
- ■contributing to economic development and the creation of social value through local hiring;
- ■encouraging the greatest possible diversity in its recruitment and career management processes, while promoting working conditions adapted to individual needs;
- ■ensuring the training and career development of its employees.
4.1.1.2The roadmap
Guided by the United Nations Sustainable Development Goals, FORVIA’s sustainable development strategy “Inspired to care” is structured around three pillars: Planet, Business, People. It is deployed using a roadmap.
Updated in 2022, this roadmap presents FORVIA’s commitments and associated action plans, objectives and performance indicators. It is deployed internally by the teams, and the results are measured against the Group’s expectations and commitments to its stakeholders.
Engagements |
Flagship projects |
NFPD(1) |
FORVIA Sustainability Roadmap |
|
Key performance indicators |
Year of reference 2019 |
2021 |
2022(2) |
Target 2025 |
Target 2027 |
Target 2030 |
|||
---|---|---|---|---|---|---|---|---|---|---|---|---|---|---|
|
|
|
|
|
|
Faurecia |
FORVIA |
Faurecia |
FORVIA |
Faurecia |
FORVIA |
FORVIA |
||
|
|
|
|
|
|
|
|
|
|
|
||||
Environmental footprint of operations (scopes 1 & 2)
|
|
✗ |
✗ |
|
CO2 emissions scopes 1 & 2 (MtCO2eq) |
0.86 |
1.21 |
0.70 |
1.04 |
0.60✔ |
0.83✔ |
Neutrality |
- |
- |
|
|
|
CO2 intensity (tCO2eq scopes 1 & 2/€ millions of sales) |
47 |
48 |
45 |
47 |
32✔ |
33✔ |
- |
- |
- |
||
✗ |
✗ |
|
Energy intensity of sites (MWh scopes 1 & 2/€ millions of sales) |
121 |
125 |
120 ✔ |
125 |
95✔ |
101✔ |
|
- |
- |
||
✗ |
✗ |
|
Waste intensity (metric tons/€ millions of sales) |
15 |
- |
13.3✔ |
- |
10.6✔ |
8.9✔ |
-28% |
-34% |
- |
||
✗ |
✗ |
|
Water intensity (m3/€ millions of sales) |
176 |
- |
174.9 |
- |
122.3 |
126.3 |
- |
- |
- |
||
Circular economy of products (scope 3)
|
|
✗ |
✗ |
|
CO2 emissions controlled scope 3 (MtCO2eq) (excluding use of sold products) |
8.57
|
11.81 |
7.35 |
10.60 |
9.05✔ |
11.98✔ |
- |
- |
-45% |
Investments for sustainable technologies
|
|
✗ |
|
|
Share of revenue aligned with taxonomy |
- |
|
- |
- |
- |
21,6%✔ |
- |
|
- |
|
|
|
|
|
|
|
|
|
|
|
||||
Business ethics
|
|
✗ |
✗ |
|
Percentage of targeted employees trained on the Code of Ethics |
93% |
- |
95% ✔ |
- |
96.7% ✔ |
- |
100% |
- |
- |
Safety
|
|
✗ |
✗ |
|
Accidents per million hours worked with and without lost time (FR1t indicator) |
2.05 |
- |
1.33 ✔(3) |
- |
1.47✔ |
2.08✔ |
- |
1,5 |
- |
|
|
|
Share of direct purchasing volume assessed for CSR performance (representing around 2,000 direct suppliers) |
80% |
- |
97% |
- |
93%✔ |
- |
95% |
|
|
||
Sustainable supply chain |
|
✗ |
✗ |
|
Percentage of suppliers included in the panel assessed on sustainable development by EcoVadis |
80% |
- |
86% ✔ |
- |
77%✔ |
- |
95% |
- |
- |
✗ |
✗ |
|
Minimum EcoVadis score of the suppliers in the panel |
30/100 |
- |
35/100 |
- |
40/100 |
- |
55/100 |
- |
- |
||
|
|
|
|
|
|
|
|
|
|
|
|
|||
Learning organization
|
|
✗ |
✗ |
|
Number of training hours per employee per year |
21.6 h |
- |
22.6 |
- |
22.9 |
- |
- |
- |
25 h |
|
✗ |
|
Percentage of women among the Top 300 leaders |
15% |
- |
21% |
- |
23% |
- |
- |
25% |
30% |
||
Diversity & Inclusion
|
|
|
✗ |
|
Percentage of women managers and skilled professionals hired externally |
30% |
|
36.1% |
|
35.4% |
- |
- |
- |
- |
|
Percentage of women managers and skilled professionals |
24.4% |
- |
27% |
- |
28.9% |
27.3% |
- |
30% |
35% |
||||
|
Percentage of non-Europeans among the Top 300 leaders |
34% |
- |
33% |
- |
35% |
- |
- |
- |
- |
||||
|
Engagement index based on the annual employee survey of all employees |
64% |
- |
73% |
- |
73%✔ |
- |
- |
- |
- |
||||
Local solidarity actions
|
|
|
|
|
Percentage of employees involved in local societal actions |
10% |
|
12 % |
- |
15% |
- |
- |
- |
- |
(1) NFPD : Key performance indicators related to non-financial risks, integrated into the Group risk mapping (see Chapter 2) and meeting the Non-Financial Performance Declaration.
(3) These data do not include SAS Automotive, which was acquired in 2020. The FR1t indicator including SAS was 1.49 in 2021.
4.1.2.Social and environmental responsibility integrated into the Group strategy
4.1.2.1.Integrated non-financial risks
In 2018, Faurecia carried out a materiality analysis by consulting an internal and multidisciplinary working group from several departments and around twenty external stakeholders. The Group’s universe of non-financial issues was built on those selected by peer companies in the automotive sector, and on the basis of the recommendations of the Sustainability Accounting Standards Board (SASB) and the Plateforme Française de l’Automobile (PFA). Each stakeholder then assessed the risks according to a common methodology of frequency and severity. This materiality analysis is updated every two years by the Executive Committee working group in charge of the sustainable transformation. Its update, in 2022, included the risks related to FORVIA’s vigilance plan.
On the basis of this materiality analysis, FORVIA draws up a list of its non-financial risks and opportunities to respond to its Non-Financial Performance Declaration (NFPD). These issues are also included in its sustainable development roadmap, “Inspired to care”, with corresponding objectives, indicators and action plans. This roadmap is monitored quarterly by the Executive Committee working group in charge of the sustainable transformation.
These non-financial risks are embedded within the Enterprise Risk Management program under the Group’s risk mapping (see Chapter 2 “Risk factors & Risk management” of this Universal Registration Document). They are reviewed annually by the Audit Committee of the Board of Directors and every quarter by the Executive Committee and the Group Risk Committee, including the Sustainable Development Director.
4.1.2.2.Governance and management of the sustainable transformation
The sustainable transformation strategy is subject to regular strategic and operational monitoring by a specific Executive Committee working group and the Board of Directors.
- ■The Nominations, Governance and Sustainability Committee of Faurecia’s Board of Directors reviews the Group’s sustainable transformation performance through:
- ■the analysis of non-financial risks;
- ■the review of sustainable transformation performance;
- ■discussion on the areas of focus of the sustainable transformation strategy.
- ■Faurecia's Executive Committee working group defines and guides the sustainable transformation strategy, through:
- ■the definition of the sustainable development roadmap and its associated action plans;
- ■discussions on the integration of sustainable development into the Group’s strategy;
- ■the management of sustainable development performance and the vigilance plan.
- This working group meets quarterly. In 2022, the HELLA representative in charge of sustainable development joined it.
- ■The Group’s Business Groups present their three-year strategic plan to the Executive Committee. This plan incorporates both the business roadmap (planning, budget, resources, KPIs, etc.) and sustainable development issues, particularly climate-related issues (energy consumption and CO2 emissions).
- ■Faurecia’s Climate Strategy and Sustainable Transformation department manages and coordinates the Group’s sustainable development strategy. The department reports on progress against the “Inspired to care” roadmap to the Executive Vice President in charge of strategy and sustainable development, a member of Faurecia's Executive Committee.
- ■The operational CSR Committee monitors CSR performance and implements the associated action plans. The Committee is composed of climate coordinators and CSR sponsors at the level of each key Group function and in the Business Groups. They ensure the integration of CSR into the Group’s policies and processes and the implementation of CSR in the functions and Business Groups. They discuss and share annually:
- ■the new guidelines of the sustainable strategy;
- ■the results of the action plans;
- ■the mapping of non-financial risks;
- ■the review of the annual non-financial audit.
4.1.2.3.Variable compensation indexed to sustainable criteria
The variable compensation systems are aligned with the Group’s strategic objectives and incorporate sustainability criteria.
Target |
Short-term variable compensation |
Long-term variable compensation |
---|---|---|
|
|
|
|
|
|
|
|
|
|
|
|
4.1.3.Meet and respond to stakeholder expectations
4.1.3.1.International executives and external expertise
FORVIA ensures compliance with best environmental, social and societal practices and adheres to recognized international norms and standards. The Group also relies on recognized CSR partners and methodologies to monitor and support its supply chain, develop its climate strategy and protect biodiversity, as well as international reporting frameworks to ensure transparency.
Adopted in 2015 by 193 countries at the United Nations, the 17 Sustainable Development Goals is an action plan for a just transition towards sustainable development by 2030. FORVIA supports these goals and contributes to them through its CSR strategy.
4.1.3.2.Non-Financial Performance Declaration and duty of care
- ■the requirements of Order No. 2017-1180 of July 19, 2017 and Decree No. 2017-1265 of August 9, 2017 creating a Non-Financial Performance Declaration, described in more detail in Articles L. 225-102-1 and R. 225-105 et seq. of the French Commercial Code (see Section 4.7.1);
- ■the requirements of law No. 2017-399 of March 27, 2017 on the duty of care (see Section 4.3.4.4).
4.1.3.3.Ongoing dialog with stakeholders
Dialog with stakeholders is a driver of FORVIA’s commitment and is a key factor of its local presence. It involves the Group’s different business lines and functions, which contribute to a proactive and constructive approach. Listening and dialog are therefore key elements in providing relevant and appropriate solutions to all the stakeholders with whom the Group interacts in the course of its business. In addition, they enable FORVIA to better integrate their expectations and the challenges associated with its global and local strategy.
4.2.Planet: care for the planet
A major player in Sustainable Mobility, FORVIA aims for CO2 neutrality by 2025 for scope 1 & 2 emissions and a reduction of 45% of controlled scope 3 emissions by 2030 by focusing on three main levers: “use less”, “use better” and “use longer”.
FORVIA has begun to reduce its CO2 footprint of all its sites thanks to energy savings and the use of low-carbon electricity. At the same time, Faurecia is reducing the footprint of its business activities through redesigned products using sustainable inputs, including recycled materials and biomass.
Committed to the circular economy, FORVIA invests and integrates recycled materials into its products whenever possible, and allows the refurbishment and extension of the life of its current and future systems. Finally, FORVIA offers innovative sustainable solutions for Sustainable Mobility that will help to avoid CO2 emissions. While investing in the future, the Group is committed to helping the automotive industry move towards zero emissions, notably through its ambition to become a leader in hydrogen technology.
4.2.1.Climate transition strategy
4.2.1.1. Climate trajectory
FORVIA aims to achieve CO2 neutrality by 2045 for all of its emissions. Validated by the SBTi Net-Zero standard, this goal has two interim objectives. The first aims for CO2 neutrality for operations (scopes 1 & 2) from 2025. The second sets the reduction of 45% of its emissions for scope 3 by 2030. By 2045, FORVIA will focus on neutralizing its residual emissions with CO2-sequestering products.
The Vice President in charge of climate strategy and the sustainable transformation is responsible for ensuring the deployment of this CO2 trajectory within the Group, in particular by ensuring the consistency of this strategy with other environmental issues.
SBTi Net-Zero certification
FORVIA is the first company in the world in the automotive sector with a CO2 neutrality roadmap that has been validated by the Science-Based Targets initiative (SBTi) against its new net-zero emissions standard.
Published in October 2021, SBTi’s net-zero emissions standard provides a common, science-based framework for understanding “net-zero” and applies to all sectors, everywhere in the world. To be certified according to this new standard, companies must achieve the objective of CO2 neutrality by 2050 at latest and reduce their emissions at the pace and scale required to limit global warming to 1.5°C by the end of the century compared to the pre-industrial period.
FORVIA’s commitment to reduce its emissions by 90% for scopes 1, 2 and 3 and neutralize residual emissions by 2045, has been approved according to the SBTi Net-Zero standard.
|
2019 |
2021 |
2022 |
TARGETS |
|
|||||
Faurecia |
FORVIA |
Faurecia |
FORVIA |
Faurecia |
FORVIA |
FORVIA 2025 |
FORVIA 2027 |
FORVIA 2030 |
|
|
NFPD CO2 emissions scopes 1 & 2 (MtCO2eq) |
0.86 |
1.21 |
0.70 |
1.04 |
0.60 |
0.83 |
CO2 neutral production |
|
|
|
NFPD CO2 emissions scope 3 (MtCO2eq) excluding use of products sold |
8.57 |
11.81 |
7.35 |
10.60 |
9.05 |
11.98 |
|
|
-45% (in absolute terms) |
|
CO2 intensity (tCO2eq scopes 1 & 2/€ millions of sales) |
47 |
48 |
45 |
48 |
32 |
33 |
/ |
/ |
|
|
4.2.1.2.FORVIA Greenhouse gas emissions
Since 2012, Faurecia has estimated its direct (scope 1)(1) and indirect (scope 2)(2) emissions and since 2016, has included its emissions related to the Group’s entire value chain, i.e. including upstream and downstream from its own business activity (scope 3)(3). Emissions displayed this year include HELLA.
In 2022, FORVIA updated its annual carbon footprint, in partnership with Deloitte. Several methodological improvements were made in order to refine the estimates, in particular for the significant items of the CO2 footprint (see Section “CO2 emissions calculation methodology”). FORVIA’s contribution to global greenhouse gas emissions in 2022 is estimated at 38.9 MtCO2eq (scopes 1, 2 and 3), i.e. an increase of 6% compared to 2019 (footprint recalculated according to the rules of the GHG protocol).
In 2022, FORVIA’s direct and indirect CO2 emissions (scopes 1 and 2) amounted to approximately 830,000 metric tons of CO2eq, a decrease of 31% compared to 2019. This reduction in emissions was driven by a decrease in energy consumption (-27% on scope 1, -14% on scope 2) and emission factors on scope 2 (-22% on weighted average) linked to the collection of emission factors from suppliers on part of the scope , the consumption of electricity from renewable sources of some sites via PPAs or on-site production, and finally the decarbonization of national electricity networks.
FORVIA's scope 1 and 2 CO2 intensity is down 32% compared to 2019 (48 tonnes of CO2eq/€M of turnover) and 31% compared to 2021 (47 tCO2eq/€M of turnover) due to the drop in emissions and an increase in FORVIA's turnover.
Note: The year 2019 includes emissions from FCE and SAS from November 2018 to October 2019, and from Hella from January to December 2019 (12 months) to be aligned with the GHG Protocol. The sales figures used correspond to the energy reporting period except for Hella where the sales figures in 2019 and 2021 are those published for the period from June to May (without BHS in 2019 and 2021). For FCE, an estimate of revenue from November 2018 to March 2019, before the integration of the acquired entities into Faurecia's accounts, was made from the following months.
NFPD Summary of GHG emissions in metric tons of CO2 equivalent – scope 1 and scope 2
FORVIA 2022 CO2 emissions breakdown, related to fuel, energy and investments
Detailed breakdown of emissions (tCO2eq) – Scopes 1, 2 and 3
In application of the recommendations of the GHG protocol, the CO2 emissions relating to the reference year 2019 and to the year 2020 have been recalculated to take into account changes in scope and methodological improvements (see Section 4.6.3.2 Methodology for calculating CO2 emissions).
|
2019 baseline |
2021 |
2022 |
Level of uncer- |
||||||
Faurecia |
FORVIA |
Faurecia |
FORVIA |
Faurecia |
FORVIA |
|||||
Scope 1 |
Scope 1 direct emissions |
156,000 |
213,000 |
173,000 |
231,000 |
121,000 |
170,000 |
low |
||
Scope 2 |
Scope 2 indirect emissions |
707,000 |
992,000 |
526,000 |
804,000 |
478,000 |
660,000 |
low |
||
Scopes 1 and 2 (internal emissions) |
863,000 |
1,205,000 |
699,000 |
1,035,000 |
599,000 |
830,000 |
low |
|||
|
|
|
Purchased goods and services |
6,218,000 |
8,102,000 |
5,227,000 |
7,103,000 |
6,502,000 |
8,177,000 |
medium |
Capital goods |
389,000 |
614,000 |
253,000 |
530,000 |
304,000 |
573,000 |
high |
|||
Fuel & energy related emissions |
245,000 |
359,000 |
208,000 |
319,000 |
203,000 |
302,000 |
low |
|||
Upstream transport and distribution |
783,000 |
944,000 |
909,000 |
1,094,000 |
1,079,000 |
1,262,000 |
medium |
|||
Wastes generated |
186,000 |
202,000 |
121,000 |
134,000 |
119,000 |
141,000 |
medium |
|||
Business travel |
68,000 |
76,000 |
18,000 |
20,000 |
42,000 |
50,000 |
medium |
|||
Employee commuting |
176,000 |
230,000 |
137,000 |
179,000 |
175,000 |
209,000 |
medium |
|||
Upstream leased assets |
50,000 |
58,000 |
54,000 |
62,000 |
58,000 |
65,000 |
medium |
|||
|
Downstream transport and distribution |
118,000 |
167,000 |
112,000 |
168,000 |
127,000 |
183,000 |
medium |
||
Processing of sold products |
85,000 |
278,000 |
73,000 |
239,000 |
81,000 |
275,000 |
high |
|||
Products end of life |
228,000 |
681,000 |
219,000 |
668,000 |
331,000 |
682,000 |
medium |
|||
Downstream leased assets |
|
|
|
|
|
|
N/A |
|||
Franchises |
|
|
|
|
|
|
N/A |
|||
Investments |
23,000 |
96,000 |
23,000 |
80,000 |
26,000 |
65,000 |
medium |
|||
Scopes 1, 2 and controlled scope 3 (excluding the use of products) |
9,432,000 |
13,012,000 |
8,053,000 |
11,631,000 |
9,646,000 |
12,814,000 |
medium |
|||
|
|
Use of products sold in the car |
19,240,000 |
23,776,000 |
14,029,000 |
18,148,000 |
18,627,000 |
22,817,000 |
medium |
|
Scope 3 total |
27,809,000 |
35,583,000 |
21,383,000 |
28,744,000 |
27,674,000 |
34,801,000 |
medium |
|||
|
Scopes 1, 2 and 3 TOTAL |
28,672,000 |
36,788,000 |
22,082,000 |
29,779,000 |
28,273,000 |
35,631,000 |
medium |
||
|
|
|
|
|
|
|
|
|
|
|
For scope 3.11 (use of products sold), a finer methodology was applied to the FCM CVI Business Group by obtaining more precise data. The methodology applied is the same as for the other Business Groups and the rest of FCM. Until now, the data used for FCM CVI were averages by product category. This methodological change led to a recalculation and a significant reduction in FCM CVI emissions for 2019 and 2021. This recalculation was carried out on the basis of volumes sold by product category.
4.2.1.3.Climate governance
Responsibility for climate-related issues lies at the highest level of FORVIA’s organization. Climate governance is integrated into sustainability issues (see Section 4.1.2.2.). The governance bodies of Faurecia and HELLA are responsible for defining, monitoring and reviewing FORVIA’s climate strategy and performance. FORVIA’s Climate Strategy and Sustainable Transformation Committee monitors the deployment of the climate strategy.
At the operational level, CO2 coordinators ensure the deployment of the strategy in the various functions and Business Groups. The CO2 “pioneer” network brings together around one hundred employees from all Group departments to coordinate the approach with employees (awards, best practice competitions, etc.).
CO2 targets are included in the criteria for the variable compensation of the Chief Executive Officer, Faurecia Top 300 leaders and Faurecia’s 4,800 managers (see Section 4.1.2.3).
The Group has also set an internal price for CO2 of €75/metric ton to anticipate and guide the development of its new products by integrating the CO2 impact.
4.2.1.4.Climate risk management
Climate transition risk management
Climate risk mapping is fully integrated into the Group’s risk mapping. In this context, it monitors the process and pace of the Group’s risk review. (see Section 2.2).
- ■The risk universe is updated annually on the basis of various data, including interviews with key stakeholders, and according to different categories (strategic, operational, compliance, financial, etc.) and by risk level (major, secondary, etc.).
- ■The mapping of the main risks is validated each year by Faurecia’s Executive Committee, the Audit Committee and the Board of Directors. It is reviewed quarterly by the Faurecia Risk Committee.
- ■In addition, the Audit Committee of Faurecia’s Board of Directors conducts an in-depth review of at least four risks each year. The climate transition risk was reviewed in 2022 by this Committee.
Also identified among the CSR risks included in the Non-Financial Performance Statement (see Section 4.7.1), the climate transition risk is audited by an external third party according to a moderate level of assurance (see Section 4.5).
Climate scenarios and resilience strategy
As part of the CO2 neutrality project launched at the end of 2019, Faurecia’s Executive Committee was able to assess three forward-looking scenarios (economic, social and environmental – by 2050) related to the impact of climate change. These scenarios enabled the Executive Committee to take into account the internationalization of the costs of the climate transition, and then to integrate them into the Group’s risk matrix. Finally, the analysis of these scenarios shed light on the Group’s objectives and business strategy, in line with the objectives for 2025 and 2030 of the CO2 neutrality project.
The scenarios below were selected based on the transition financing process: private sector, governments or global institutions. All scenarios have common assumptions regarding climate and population in 2040 and differ in socio-economic status and the trajectory of global warming towards 2080. Each corresponds to a different climatic trajectory according to the assumptions of the IPCC (+1.5°C/2.5°C in 2080 [RCP 2.6], +2.5°C/3.5°C in 2080 [RCP 4.5/6.0], +3.5°C/4.5°C in 2080 [RCP 8.5]).
The time horizon considered is 2050, halfway between Faurecia’s targets for 2025 and 2030 and the climate effects of 2080.
These scenarios were developed in 2020 in partnership with the Toulouse School of Economics, and in collaboration with the Collège de France.
4.2.2.Climate: reduction of carbon emissions and adaptation of sites (scopes 1 & 2)
FORVIA has set itself the objective of CO2 neutrality of its sites by 2025 and is rolling out a program to control energy consumption and develop more low carbon energy.
- energy savings, in particular through smart meters, digitization, and the recovery and recycling of heat from manufacturing processes;
- production of renewable energy on-site (solar);
- development of renewable energies through long-term electricity purchase contracts (Power Purchasing Agreements, or PPA);
- electrification of processes and heat production.
For the strategic and operational deployment of each of these areas, Faurecia has forged partnerships with specialists recognized for their experience, expertise and international presence:
- ■Engie, Schneider Electric and, since the end of 2021, Green Yellow for heat recovery and recycling and energy savings;
- ■KPMG, Engie and EDP for the creation of on-site solar installations, supported through long-term PPAs;
- ■Schneider Electric as exclusive advisor for the purchase of off-site renewable electricity, in the form of long-term electricity PPAs.
4.2.2.1.Energy savings and heat recovery
On a daily basis, FORVIA sites are therefore committed to improving their energy consumption by optimizing the energy efficiency of their buildings and production facilities, and improving their energy purchases.
With our partners, “Invent the factory of the future”, frugal and efficient
As part of its partnerships with Engie, Schneider Electric and Green Yellow, from 2021 to 2022, Faurecia assessed the energy saving potential of 140 sites. The “Energy Efficiency as a Service” program made it possible to carry out detailed optimization studies on 100 of them. At the end of 2022, investments in energy savings were being rolled out at 60 sites worldwide. Studies are being finalized for around 30 additional sites. The amounts mobilized will be more than €100 million between 2021 and 2023. The first HELLA “pilot projects” of this program were initiated in mid-2022 and are being evaluated.
These energy performance contracts offer the sites the opportunity to equip themselves with measurement, regulation and automatic shut-off systems, making it possible to reduce the consumption of resources as necessary. New heat recovery systems have also been fitted to thermal machines. The investment in smart LED lighting and the plan to replace old and energy-intensive machines continued.
Digital technology for low energy use
The Group has analyzed its energy consumption and identified the areas for the energy optimization of machines and systems on its sites. Faurecia continues to roll out its consumer hypervision system. This tool allows a detailed analysis of energy consumption. Its implementation, which began last year at pilot sites, will continue in 2023. 280 Faurecia sites have thus been connected to this internet platform, making it possible to view energy consumption remotely. 101 plants were equipped with a connected measurement of their power consumption, making it possible to view it with a temporal accuracy of 10 to 15 minutes. HELLA has equipped its main production sites with equivalent measurement systems, whose shared data support the energy productivity plan.
As part of its cooperation with Palantir, Faurecia has developed the platform Foundry a solution integrating time-based energy data and production data from connected sites, in order to measure the consumption stub of its sites. By using its best plants, the Group was able to collate its best energy management practices and share them with as many people as possible. All of these measures, together with a sustained communication effort, have made it possible to reduce the consumption tail, contributing to an improvement in energy use.
Improving the energy efficiency of buildings and production facilities
In 2022, in order to participate in the European energy sobriety effort and ensure business continuity in a context of uncertainty over the availability of natural gas resources, at all its sites the Group deployed a white book on energy management in times of shortage (White Book: We Save Energy). This guide recommends best practices and disseminates the Group’s instructions, such as: adaptation and monitoring of temperatures, reduction of natural gas consumption, adaptation of work organization and work clothes, and provides for procedures to be followed in the event of a gas or electricity supply disruption.
Green Factory white book for all new units
Faurecia produced a white book in 2022, called Green Factory, for all new planned sites, either under construction or extension. This guide brings together all the criteria, translated into the technical specifications of new projects. These programs cover all Faurecia plants worldwide and can be extended to HELLA sites.
LEED® or BREEAM® certification of all new buildings
To improve the energy efficiency of buildings and, more generally, to reduce their environmental impact starting from the design phase, FORVIA encourages all of its new buildings (new constructions) to be Leadership in Energy and Environmental Design (LEED®) or BREEAM® certified. To obtain certification, new buildings must meet strict requirements in terms of site layout, efficient water management, energy use, the selection of materials, interior air quality and design factors.
To support the sites in these new certifications, the Group has set up a LEED® or BREEAM® certification procedure. In 2022, the Allenjoie site of the Clean Mobility Business Group obtained BREEAM Excellent certification. It is the first industrial building in France to obtain this certification and the second in Europe. In Germany, the Hanover site obtained Platinum Deutsche Gesellschaft für Nachhaltiges Bauen (DGNB) certification.
Elimination of fossil fuels
In partnership with Engie and Schneider Electric, the Group is committed to the electrification of heating systems and processes that currently consume fossil fuels and, in particular, gas. 15 pilot sites are in the process of gradually eliminating these energy sources.
These contracts are supplemented by an electrification program called “Heat as a Service”, set up for environmental reasons, and which aims to limit the Group’s dependence on gas while guaranteeing continuity of operations and solidarity with households that use natural gas for heating. This program was developed according to the principles of the program Energy Efficiency as a Service.
4.2.2.2.Renewable energy: on-site production and self-consumption
FORVIA wants to produce as much solar electricity at its sites as is technically feasible. In view of the Group’s global reach and its production capacity, it has set itself the target of installing more than 1.3 million m2 and 130 MWp (megawatt-peak) by 2025. Photovoltaic panels installed in buildings in around 20 countries should ultimately account for around 7% of the sites’ average consumption.
The Group is rolling out a global program for this. FORVIA has entrusted the installation and operation of the renewable electricity production assets to two developer partners, EDP and Engie. Over-the-counter PPAs are therefore directly involved in the creation of new solar capacity on the sites.
HELLA is also committed to this on-site solar panel deployment program. Faurecia’s approach and partnerships can be extended to HELLA sites.
4.2.2.3.Renewable energy: long-term electricity purchase contracts
Faurecia is committed to purchasing increasingly low-CO2 electricity, in collaboration with its suppliers, site by site. Since 2020, the Group has rolled out a global action plan for the period 2020-2025. This aims to produce or purchase electricity that is even lower carbon, better than local electricity grids, in particular through over-the-counter contracts, or by off-site Power Purchase Agreements (PPAs). These contracts cover all Faurecia plants worldwide and are extendable to HELLA sites.
At the end of 2022, the average percentage of the FORVIA’s renewable electricity was 0.8% (mainly wind, hydraulic and solar).
Forvia does not include in this 0.8% renewable energy certified by the Energy Attribute Certificates (Guarantees of Origin, REC, i-REC, etc.) of the "green" contracts that certain voluntary sites have entered into with suppliers of electricity. In addition, FORVIA also does not include the renewable share of national electricity grids when there are no residual or contractual values. This 0.8% therefore includes only the PPAs and the production of electricity from renewable sources on site. It would reach 14% in 2022 including "green" contracts.
Similarly, for the calculation of scope 2 emissions, the emission factor used for these "green" contracts is that of the national residual mix (when available) or production, and not 0 g CO2eq/kWh. The years 2019 and 2021 have been recalculated accordingly.
Geographic distribution of renewable electricity consumption
Group energy consumption
Electricity and natural gas are the two energy sources (respectively 72% and 25%) most used by FORVIA sites for industrial and service uses. This mix is similar for Faurecia (72%/24%) and also for HELLA (71%/27%), which uses cogeneration to produce electricity and heat in Europe.
In 2022, the total energy consumed by FORVIA reached 2,575,000 MWh (6% less on a like-for-like basis compared to 2021 and -18% compare to 2019 – MWh GCV (Greater Calorific Value includes the energy released by the condensing of water, called latent heat of condensation, after combustion) for scope 1, MWh for scope 2).
The decrease in energy intensity within the Faurecia scope is due to the energy saving and heat recovery actions described in Section 4.2.2.1 and to a sincere and shared commitment by all to reduce energy consumption, waste and dependence on natural gas.
The programs initiated in 2021 at the Faurecia sites have begun to bear fruit. Partial or complete installation of energy conservation measures on the 60 sites already under the Energy Efficiency as a Service contract contributed to this decrease. It should also be noted that all the sites involved in the program, whether already under contract or not, were able to gain in expertise by participating in the analyses. Energy waste reduction initiatives have multiplied. In Europe, faced with the risk of a natural gas supply disruption and the risk of a blackout, a resilience plan has been put in place. Adaptation of temperature settings, supply of warm clothing, optimization of processes: the plants competed in creativity to reduce their energy consumption and participate in the effort to protect strategic reserves. HELLA has also significantly reduced its consumption of natural gas by shutting down cogeneration in Germany.
Energy consumption, overall and by source
The breakdown of energy consumption remained almost identical between 2021 and 2022. The share of natural gas decreased slightly from 28% to 25%, and that of electricity increased from 67% to 72%.
Breakdown of total energy consumption by Business Group
4.2.2.4.Adaptation of sites to climate change
FORVIA integrates the management of natural disasters upstream into industrial projects, new plants, or any significant redevelopment of existing sites. The Group also has a system for monitoring natural phenomena (meteorological and physical: storms, floods, extreme temperatures, earthquakes...) (24/7) for the entire industrial portfolio (see Sections 2.2.1.8 and 4.6.2).
In 2022, FORVIA entrusted AXA-Climate with the analysis of the evolution of climate hazards at its sites by 2030 and 2050, according to two IPCC scenarios (SSP2-4.5 and SSP5-8.5 of the 2022 report). The Group has thus mapped its sites with regard to their exposure to two types of climate risk:
- ■impact of acute climate risks by 2030, i.e. risks of natural events with destructive consequences: floods, extreme winds, forest fires, heat waves, extreme precipitation;
- ■impact of chronic climate risks by 2030 induced by long-term changes in the average and variability of climate patterns: higher temperature or humidity, greater water stress, etc. due to climate change.
In light of this mapping, the Group is developing a short- and medium-term climate change adaptation plan, driven by the highest level of the Group’s organization and which will be rolled out in the functions and entities.
4.2.3.Climate: circular economy and reduction of carbon emissions from products (scope 3)
FORVIA implements a circular economy throughout the life cycle: eco-design, use of resources and raw materials, usage phase, end of life and recycling. Faurecia mainly uses metals (80% by weight of total raw materials purchased) and plastics (20%).
Faurecia assesses the environmental impact on the life cycle of its main innovation projects, with the aim of having 100% of innovation projects subject to a CO2e Life Cycle Analysis by 2023.
4.2.3.1.Sustainable Materials
Materials for CO2-neutral products
In view of its climate goals, and in particular its reduction target for scope 3 (see Section 4.2.1.1), FORVIA created MATERI’ACT in 2022. This new subsidiary benefits from more than ten years of Faurecia’s expertise in the formulation and processing of recycled and biosourced materials. It develops, sources, produces and sells advanced sustainable materials with a low and ultra-low CO2eq footprint.
MATERI’ACT thus offers materials whose CO2eq footprint is reduced by 20% to 95% compared to current materials, and focuses its innovations on four product lines:
- ■recycled and biosourced composite plastics for interiors, seats and lighting.
- Renewable polymers are made from recycled plastics or biomass. If they come from biomass, they sequester the CO2 in the atmosphere through photosynthesis. They are also offered outside the automotive industry;
- ■low CO2eq footprint covers for seats and interiors.
- They have a premium feel and appearance and thus offer an alternative to traditional leather. They can also be used in other sectors, such as fashion and furniture;
- ■carbon fibers with a low CO2eq footprint for pressurized hydrogen vessels, including, in the long term, biosourced elements;
- This technological innovation will drastically reduce emissions from carbon fiber production processes;
- ■green steel, produced by reducing iron oxides using hydrogen and low-carbon electricity.
- FORVIA is a founding partner of GravitHy, which will produce hydrogen-reduced iron in Fos-sur-Mer in 2027 (“direct reduced iron”), and is also working with the steelmaker SSAB to use the first European green steel in its seats from 2025.
Transforming the industrial ecosystem
MATERI’ACT aims to sell sustainable materials, worth €2 billion in 2030, to the automotive and other sectors, such as aeronautics, construction, clothing, etc. FORVIA thus intends to have a ripple effect on the entire industrial ecosystem.
MATERI’ACT has developed strong partnerships for bio-sourced and recycled materials. The objective is to secure raw materials, ensure the industrial ability to meet customer requirements and have a lasting impact on the industry. These partnerships take different forms, including:
- ■the APM joint venture with the agricultural cooperative INTERVAL for the introduction of hemp and its co-products such as fiber in plastic materials;
- ■partnerships for the introduction of recycled content into materials with key recycling players, including Veolia;
- ■the development and sale of a sustainable alternative to leather, made from pineapple fiber waste with AnanasAnam.
Lastly, MATERI’ACT has a project to create an open innovation center for sustainable materials in the Lyon metropolitan area in 2023, which will host an industrial ecosystem of universities, small companies and start-ups.
All MATERI’ACT sustainable materials are aligned with the European Union’s Green taxonomy (see Section 4.2.2)
4.2.3.2.Eco-design
Since 2021, Faurecia has used the Eco-design Assessment tool to assess the environmental impact of its innovations, with regard to eco-design criteria, throughout the life cycle of a product: from its design, sourcing, manufacture, usage, to end-of-life (for example the presence of substances of concern, the use of low-CO2eq impact raw materials – made from biomass or recycled sources, recyclability of innovation, etc.). Its use enables the proactive application of eco-design principles in the development of an innovation. In 2022, Faurecia further refined and formalized this tool by including circularity aspects. Eco-design Assessment is integrated into the core procedures of the innovation process and all innovations are now assessed according to this grid. Similarly, targets specifying the content of secondary (recycled) materials, the content of biomaterials, weight reduction and the potential for end-of-life recyclability have been introduced in the generic concepts of products under development for all product lines, and for all divisions.
4.2.3.3.Life Cycle Assessment (LCA)
Committed to the circular economy, the Group designs products taking into account their entire life cycle: use of resources and raw materials, product eco-design, usage and end-of-life recyclability. Beyond the specifications and objectives of the equipment manufacturers, Faurecia seeks to improve the industrial processes, the materials used and the design of its products in order to reduce the CO2 footprint of its systems throughout their life cycle.
Vehicle life cycle, Forvia's levers
Framed by the international standards ISO 14040 and ISO 14044, Life Cycle Assessment (LCA) measures impacts including greenhouse gas emissions, consumption of non-renewable resources and materials and water eutrophication. It takes into account the entire life cycle of products: extraction of materials, manufacture of products, delivery to the manufacturer, vehicle assembly, use by the consumer and end-of-life.
Faurecia conducts a simplified LCA of all its innovations on the impact of CO2eq. Depending on the criticality of the environmental risk or opportunity, Faurecia carries out a complete innovation LCA based on all environmental criteria. The Group has developed an internal database to identify the emission factors associated with the various activities that contribute to the CO2eq footprint of the Group and its products. This database currently contains nearly 1,900 emission factors, and is constantly evolving, with a very high percentage of primary data (specifically collected and provided by the production ecosystem, unlike secondary, generic data representing an average).
In 2022, nearly 40% of revenues generated by development projects were covered by a CO2e LCA of the products. The Group expect to reach 80% by the end of 2023.
Against a backdrop of increasingly stringent environmental requirements, particularly for the automotive sector, Faurecia is keen to develop LCA with automakers and partners in the automotive sector in order to have a shared understanding of environmental issues.
Faurecia actively participates in three working groups on LCA led by the main industrial associations, in order to share methodologies, data, results and impacts, and the flow of information:
- ■the life cycle analysis working group led by the automotive industry platform (PFA);
- ■the eco-design working group of the Verband der Automobilindustrie(4) (VDA);
- ■the European Association of Automotive Suppliers (CLEPA) sustainable development working group;
- ■ScoreLCA, a collaborative network on LCA in France that brings together major industrial players.
4.2.3.4.Products recyclability
Faurecia incorporates recyclability in its eco-design approach by anticipating the end-of-life phase and optimization of production waste recovery.
Faurecia systematically studies substitutes for plastics that are not yet recyclable (PVC, thermoset or composite plastics such as polypropylenes loaded with glass fibers).
In addition to materials, Faurecia builds into its designs the complete recyclability of interior modules. The Seating Business Group thus works to extend the use value of vehicle interiors by anticipating the replacement of parts. Interior modules are now designed to be removable, repairable and recyclable.
The Interiors Business Group has carried out recycling and recovery tests on complex products after dismantling and shredding vehicles. For example, the NAFCORECY (NAtural Fiber COmposites RECYcling) project was able to demonstrate, with the help of European companies specialized in recycling, that parts made of NAFILean® (polypropylene with natural fibers) can be processed with post-shredding technologies for end-of-life vehicles or recycling technologies used for industrial waste. The new generation of NAFILean® is being industrialized. NAFILean-R® will offer the greatest reductions in weight and CO2eq emissions to date (10% and 95% respectively). This material was recognized by the German Innovation Award 2022 and the Green Innovation Automobile Award 2022.
4.2.3.5.Electronic systems repairs: the “ReparLab”
Faurecia Clarion Electronics (FCE) offers a multi-brand electronics repair service throughout Europe. Since 2005 and in partnership with several automakers, including Stellantis and Renault, FCE has been offering electronic repairs based on a circular economy model. A total of 30,000 repairs are carried out each year, thus extending the useful life of resources and reducing the generation of electronic waste.
HELLA is also committed to a circular economy. HELLA’s Life Cycle Solutions business contributes to the protection of the environment and the prudent use of resources. As part of its after-sales services, it provides wholesalers with around 35,000 different spare parts and provides repair shops with diagnostic equipment and additional tools. Thus, it helps to extend the life of vehicles and get them back on the road quickly and efficiently.
4.2.4.Environmental impact of operations
Faurecia makes a priority commitment to managing energy and CO2 emissions from waste as well as reducing the impacts on air, water and soil. The Group takes measures to prevent pollution, climate change and protect biodiversity. To this end, the Group’s environmental policy consists of:
- ■ensuring regulatory compliance and meeting the expectations of its stakeholders;
- ■setting and deploying targets for reducing the waste produced and increasing the recycling rate;
- ■reducing its impact on water use, starting with actions in water-stressed areas;
- ■identifying biodiversity action plans for sites located near protected areas;
- ■training employees and suppliers to instill a personal sense of environmental responsibility, including the “10 Green Attitudes”;
- ■implementing continuous improvement, in particular by deploying ISO 14001 certification procedures through its production and operations organization management tool, the Faurecia Excellence System.
- ■the Business Groups implement this policy in their respective areas. The Group ensures that their roadmaps are aligned with the highest level of requirements and objectives.
The environmental policy is steered by the Group’s HSE (hygiene, safety and environment) department. It is broken down into action plans aimed at improving the Group’s environmental performance. It is part of the overall CARE approach, which aims to reduce HSE risks in its operations.
Faurecia’s Vice President HSE coordinates a network of HSE leaders in each Business Group and a network of HSE managers at the level of the operating divisions and sites. The HSE organization of HELLA is also based on an HSE department and an HSE network, and will be gradually integrated with that of Faurecia. The position of Environment Director was created on September 1, 2022.
4.2.4.1.Environmental culture of the teams
With its “10 Green Attitudes” campaign, Faurecia raises awareness of the ten environmental attitudes to be systematically adopted. It is based on four themes: soil and subsoil protection, energy management, the quality of air emissions and waste management. In 2023, FORVIA will strengthen its campaign on the issues of water and biodiversity. The awareness-raising process takes the form of posters, online training and a self-assessment questionnaire. The latter enables the progress by sites in adopting good environmental attitudes to be measured. Knowledge and implementation of these environmental attitudes are assessed as part of the industrial audits of the Faurecia Excellence System (FES) management system.
In 2022, Faurecia set up “monthly highlights” on environmental topics. The green moments are an opportunity to share on an environmental subject, policy or objective: refrigerant gases, rainwater protection, waste management, etc. They are intended for all operators, at all sites – in plants and at research and development sites.
In addition, Faurecia launched a best practices competition in 2022. All Group sites and entities share their best practices on a monthly basis, whether they apply or exceed Faurecia standards. In 2022, more than 300 best environmental practices were identified on the topics of water resource conservation, waste sorting and optimization, and the prevention of emergency situations. These best practices are shared at a monthly meeting with all Group HSE leaders.
4.2.4.2.The Faurecia Excellence System: an operational management tool
All FORVIA plants are IATF 16949 certified, a standard specific to the automotive sector that defines quality management requirements (continuous improvement, defect prevention, reduction of non-compliance and production scraps in the supply chain, etc.). The management system relies heavily in terms of operational control on the Faurecia Excellence System (FES), which is the tool for managing the organization of production and operations. FORVIA has been working for the past year to integrate the HELLA production system into the FES. The Group implemented the first pilots for key functionalities in 2022. The testing of these pilots will continue in 2023, and will allow the unification of the first elements of the FES. The system will be fully unified for the FORVIA scope in 2024.
The FES is based on more than 20 years of experience. It guarantees that the operational performance of production plants is at the highest level, regardless of their geographical position and local specificities. It is based on more than 60 fundamentals, each consisting of around ten criteria.
- ■the environmental policy of operations (see Section 4.2.4);
- ■occupational safety (see Section 4.3.2);
- ■product safety (see Section 4.3.3).
The FES thus aims to support plants with the operational requirements of quality, environment and safety standards for the automotive industry. Its criteria are the first steps towards IATF 16949, ISO 14001, ISO 50001 and ISO 45001 certifications.
The application of the FES fundamentals and criteria is subject to a self-assessment and Internal Audit program:
- ■the sites carry out a monthly self-assessment and an in-depth review every three months;
- ■the divisions conduct annual internal mock audits;
- ■lastly, the Group conducts Internal Audits of more than 200 plants that are representative in terms of their workforce and sales. The audit frequency, currently two or three years, will be annual from 2023.
The FES is enriched annually with best internal and external lean manufacturing practices (Lean Manufacturing). In 2023, the tool will be redefined to:
- ■strengthen the energy efficiency criteria across several fundamentals;
- ■reduce waste at source and sorting;
- ■include data digitization.
4.2.4.3.Employee training
All new employees arriving at a certified site attend an awareness-raising session on best environmental practices.
Environmental training is mainly carried out internally. The sessions, either regulatory or at the Group’s initiative, deal with environmental impact and risk management, waste classification and management, chemicals management, implementation of natural disaster emergency response plans and also the environmental monitoring of subcontractors’ sites.
The training provided by external organizations mainly aims to develop internal expertise, such as mastering the ISO 14001 certification process.
4.2.5.Environmental impact of operations
Since 2017, Faurecia has been rolling out 10 Green Attitudes, ten good environmental attitudes, at its sites to protect soil, reduce energy consumption and CO2 emissions, prevent air pollution and control waste production:
- protect soil and groundwater from contamination;
- comply with the site’s operating permit or license;
- carry out a comprehensive assessment of the site’s risks, including environmental risks;
- monitor energy consumption when production is stopped; identify and stop leaks (oil, compressed air, water, etc.);
- take into account the energy consumption and environmental impacts of new equipment and insulate all heating devices;
- regulate buildings when production is stopped: cooling, heating, lighting, etc.;
- shut down unnecessary equipment when production is stopped;
- reduce volatile organic compound (VOC) emissions by implementing best practices;
- sort hazardous waste from non-hazardous waste;
- sort waste by type to increase its recycling rate.
The action plan related to the implementation of the 10 Green Attitudes is reviewed during FES audits. These attitudes will be reviewed in 2023 by the Group’s Environment Committee.
4.2.5.1.ISO 14001
FORVIA is committed to ISO 14001 certification for all production plants with more than two years of activity. The percentage of sites with ISO 14001 certification (or with an action plan for ISO 14001 certification, with more than two years of activity) is tracked every six months by the Risk Committee.
|
|
Within the Faurecia scope, 88% of production sites are certified, i.e. 143 sites. The change between 2021 and 2022 is explained by the sale of the AST sites as well as the shutdown of certain Russian sites, representing eleven certified sites. Four new sites were also certified.
Number of ISO 14001 certified production plants or with ISO 14001 certification pending in 2022
4.2.5.2.Biodiversity
In order to reduce the footprint of its sites and preserve biodiversity, FORVIA joined Act4Nature in 2022. This international alliance, led by the French association of “Enterprises for the Environment” (EpE), was initiated to accelerate the concrete actions of companies in favor of biodiversity. In this context, the Group has made commitments and has set itself targets for biodiversity, water, waste and the environment.
FORVIA is committed to biodiversity, water and waste
In addition, the white book, Green Factory, oversees the identification and management of potential impacts on biodiversity for all new units (see Section 4.2.2.1).
For existing sites, identification of neighboring areas (15 km radius around the site) of interest for biodiversity (key biodiversity areas) was carried out in 2022. For sites close to sensitive areas, an action plan will be defined and implemented in 2023.
4.2.5.3.Production waste
FORVIA’s industrial sites work on a daily basis to reduce, recover or recycle whenever possible the waste generated throughout the production chain.
Reduction and recovery actions implemented by the sites
To date, 90% of FORVIA’s industrial waste is weighed individually and known in detail. The rest of the waste is generally pooled with other manufacturers in the same supplier industrial park.
Sites are also implementing local initiatives that improve the sorting and recovery of waste as energy or materials, and reincorporating production scraps into processes or reusing waste.
As part of its Act4Nature commitment (see Section 4.2.5.2.) FORVIA is committed to systematizing best waste management practices at 100% of industrial sites by 2025. These consist, for example, in optimizing offcuts through more precise cutting, regrinding and reusing plastic raw materials and packaging, the implementation of local circular economy loops, the optimization of industrial waste sorting, etc.
FORVIA has also committed to reducing its waste intensity by 28% by 2025 (vs. 2019) and by 34% by 2027.
Stable waste generation thanks to optimization actions
Within the Faurecia scope, 196,000 metric tons of waste were generated, a reduction of 5.62% compared to 2021.
The Group’s sales figures correspond to the results generated during the environmental reporting period.
For the Faurecia scope, the recycling rate achieved is similar, at 69%, showing Faurecia’s commitment to reducing the landfill of its waste to a minimum and increasing its recycling (+2% compared to 2021).
Breakdown of total amount of waste generated, in metric tons, by treatment method
The Group’s priority remains to avoid the production of waste, and it always favors internal and external recycling before opting for other disposal methods such as incineration with energy recovery.
It should be noted that some of the production sites are located on industrial sites dependent on manufacturers. At these sites, waste collection cannot be traced back to the waste generated and collected for Faurecia.
Every year the sites develop initiatives to reduce their environmental impact, particularly for the waste generated, of which the following is a list of examples:
- ■in order to improve knowledge of the areas and types of waste generated, some sites such as Pisek in Poland (FAS and FCM) have optimized their sorting at source, at the level of the production lines;
- ■some sites such as the Méru site in France (FIS) monitor and report their water consumption and waste management on a monthly basis;
- ■the Étupes and Méru sites in France (FIS) grind plastic offcuts and dismantle non-compliant parts to reinject them into the process;
- ■in addition to traditional packaging (pallets, cardboard, plastic) recycled for a large part of FORVIA sites, some sites reuse packaging, such as the Puebla techno (FIS) site in Mexico, Changshu (FAS) in China and Augsburg (FCM) in Germany; other sites, such as Cut & Sew (FAS) reuse textiles and vinyl to fill seats;
- ■most FORVIA plants are equipped with compactors to reduce the volume of waste transported.
4.2.5.4.Water resources
A third of FORVIA’s water consumption is used for industrial purposes and two-thirds is for sanitary use (showers, catering, toilets).
Water consumption by source of supply (in m3)
In 2022, the Faurecia sites maintained their efforts to reduce water consumption, with a total reduction of 455,000 m3 compared to 2021.
This reduction is mainly due to a decrease in the use of water for industrial purposes, which represents around one third of total consumption. Faurecia encourages its sites to ensure the proper functioning of their existing facilities while implementing actions to identify and reduce their water consumption, such as the following:
- ■the Étupes sites in France and Puebla Injection in Mexico (FIS) use a connected system to monitor their water consumption in real time; the Nelas site (FAS) in Portugal uses it to identify leaks;
- ■the Tarazona site (FIS) in Spain has set up a system to control the quality of the water in the cooling circuit to prevent it from being discharged into the wastewater network; other sites, such as the Chakan sites in India (FCM), monitor their daily wastewater consumption and carry out inspections of their underground supply networks; they use the gray water to water the green areas of the site or facilities;
- ■still others, such as the one in Chennai (FIS) in India, ensure the good condition of the installations and in particular the insulation panels in the paint cabinets in order to avoid water loss due to corroded elements;
- ■a large number of sites have installed foamers or reducers on the heads of faucets and ecological toilets;
- ■Bampton (FCM) in England and Pitesti (FIS) in Romania have installed closed circuit cooling circuits when replacing the cooling towers;
- ■the Puebla techno (FIS) and Queretaro (FCM) sites in Mexico and Tianjian (FAS) in China, recover process and cooling water for use as gray water in toilets, cleaning water or for watering green spaces;
- ■the FCM site in Cape Town in South Africa has installed rainwater harvesting tanks.
All new site projects, new construction or extensions, deploy effective water resource management. The white book, Green Factory, completed in 2022, presents the mandatory installations to reduce water consumption: permanent and connected water sub-meters, sanitary equipment with water consumption control, rainwater harvesters and gray water for sanitary purposes (see Section 4.2.2.1).
Breakdown of water consumption, by use - périmètre FORVIA
Breakdown of water consumption, by use - périmètre Faurecia
Destination of released water
Faurecia has taken actions to improve the monitoring of ultimate destination of wastewater. The water discharged into the natural environment is cooling water that is therefore not contaminated by the manufacturing process and is used to irrigate green spaces.
4.2.5.5.Preventing environmental pollution
Limiting the use of chemical products of concern
Faurecia has implemented a system for managing substances throughout the supply chain, from suppliers to manufacturing customers, for all its products delivered. Among other benefits, this approach gives the Group access to complete information on the substances entering into its products, in compliance with regulations such as the European Union’s REACH (Registration, Evaluation and Authorization of Chemicals) regulation.
Identifying substances of concern
Faurecia has developed an anticipatory approach to the identification and sharing of information within the supply chain on substances of concern, based on a list of substances considered as potentially of concern for its products and their use. In some cases, such as catalyst protectors in exhaust systems (ceramic fibers), Faurecia has defined an internal procedure that is more stringent than REACH.
Anticipating and proposing substitutes
Faurecia participates in the work carried out in collaboration with automakers and various professional associations to anticipate possible restrictions on the use of substances in the coming years, in order to be able to anticipate and to carry out projects to replace certain substances when this is preferable.
The Group oversees the REACH and Global Automotive Declarable Substance List (GADSL) working groups, through the Global Automotive Stakeholders Group (GASG) and the European Association of Automotive Suppliers (CLEPA).
Limiting emissions of Volatile Organic Compounds (VOCs) from production
Faurecia monitors atmospheric emissions of VOCs related to its business. In 2022, the sites emitted around 1,170 metric tons of VOCs during production, a decrease of 24% compared to 2021. This is due to the sale of the AST business and the shutdown of certain Russian sites. On a like-for-like basis, it should be noted a reduction of 10% obtained by the optimization of processes at the Puebla FIS & FAS sites, via the reduction of the use of solvent-based paints, the recycling of solvents (Puebla FIS), and the use of water-based mold release agent by Puebla FAS.
Despite the replacement of solvent-based adhesives and paints by water-based products, the Faurecia Interiors System business still requires the use of solvents for certain adhesives, paints and release agents. This activity alone accounts for 71% of the Group’s VOC emissions.
Avoiding accidental discharges into water and soil
In order to eliminate the risk of accidental releases inherent to industrial activity, Faurecia trains all site operators to anticipate any risk and on how to react in the event of an accidental spill, through the training program on “10 Environmental attitudes”. All ISO 14001 certified sites integrate the prevention of this risk into their management system.
Faurecia assesses the environmental risks of its industrial projects by systematically conducting environmental audits and subsoil studies research when appropriate.
Lastly, in the context of industrial restructuring resulting in plant closures, the Group systematically assesses the environmental impact and carries out a soil and subsoil study when appropriate.
4.2.6.Sustainable technologies and alignment with European taxonomy
4.2.6.1.Note on the Taxonomy Regulation and alignment of FORVIA activities
Context
Pursuant to the EU Regulation 2080/852 of June 18, 2020 (known as the “Taxonomy Regulation”) and the EU Delegated Climate Regulation 2021/2139 of June 4, 2021 that determine the conditions under which economic activities can be considered as substantially contributing to climate objectives, FORVIA is required to disclose the share of its revenue, its capital expenditure, and certain operational expenses for the 2022 fiscal year resulting from economic activities considered eligible and aligned in terms of the objectives of mitigation and adaptation to climate change.
An economic activity is eligible if it is part of the list of activities described by the Delegated Acts to the Taxonomy Regulation, corresponding to the activities identified by the European Commission as likely to substantially contribute to one of the six environmental objectives:
- ■climate change mitigation;
- ■climate change adaptation;
- ■sustainable use and protection of water and marine resources;
- ■transition to a circular economy;
- ■pollution prevention and control;
- ■protection and restoration of biodiversity and ecosystems.
- ■it substantially contributes to one or more environmental objectives, by meeting the specific technical criteria detailed in the Delegated Acts to the Taxonomy regulation;
- ■it does not cause any significant harm to the other environmental objectives, meeting the applicable “Do Not Significant Harm” criteria described in the Delegated Acts to the Taxonomy regulation;
- ■it is carried out in accordance with minimum safeguards and complies with the OECD Guidelines for Multinational Enterprises and UN Guiding Principles on Business and Human Rights.
December 31, 2022, reporting
Eligible activities
FORVIA conducted a detailed analysis of all activities and product lines within its various consolidated entities.
This analysis, carried out jointly by the Sustainability department, the Finance department, the Operations department, the Strategy department, and the Industrial departments of the Business Groups, and business line experts, led to the identification of the following eligible activities for the year ended December 31, 2022:
- ■activity 3.2 – Manufacture of equipment for the production and use of hydrogen: FORVIA manufactures hydrogen storage systems for light and commercial vehicles, buses and trucks;
- ■activity 3.4 – Manufacture of batteries: FORVIA manufactures components of battery systems consisting for instance of battery management systems, intelligent battery sensors and DC/DC voltage converters;
- ■activity 3.6 - Manufacture of other low carbon technologies: in 2022, FORVIA launched MATERI’ACT to develop cutting-edge sustainable materials fit for the automotive industry and beyond with low, and ultra-low footprint (up to 85% CO2 reduction versus current material).
FORVIA has analyzed its activities in consideration of the Taxonomy Regulation and of the Draft Commission Notice on the interpretation and implementation of certain legal provisions of the EU Taxonomy Climate Delegated Act of December 19, 2022. Given the essential role of automotive equipment suppliers in achieving the carbon neutrality objectives of automotive manufacturers, FORVIA considers that business activities related to the following activity should also been taken into consideration as part of low-carbon vehicles manufacture in the service of hybrid (< 50 gCO2/km), hydrogen and electric vehicles. However, to comply with the legal provision of the above-mentioned document, FORVIA is presenting the results of the consideration of its KPI excluding this activity and a separate set of KPI showing what it would be if this activity is included into the computation.
- ■activity 3.3 – Manufacture of low carbon technologies for transport: FORVIA took into consideration its business activities in the service of hybrid (< 50 gCO2/km), hydrogen and electric vehicles as part of the activity “3.3 Low-carbon manufacturing technologies for transport” of the Taxonomy Regulation. These vehicles are designed and produced as part of a joint effort between carmakers and equipment manufacturers. While manufacturers translate consumer preferences into clear parameters for the design and assembly of vehicles, FORVIA supplies the technologies and components that meet these parameters. FORVIA researches, designs, and industrializes systems (including interiors, seats, electronics, lighting technologies and depollution systems) that are a part of low-carbon vehicles. These systems are inseparable from hybrid, hydrogen and electric vehicles and their environmental performance.
Aligned activities
Regarding the substantial contribution criteria, 100% of FORVIA eligible activities contribute substantially to the climate mitigation objective:
- ■regarding the activity 3.2 – Manufacture of equipment for the production and use of hydrogen, all of the hydrogen storage tanks manufactured by FORVIA meet the substantial contribution criteria related to the manufacture of equipment for the use of hydrogen;
- ■regarding the activity 3.4 – Manufacture of batteries, the substantial contribution criteria relate to the manufacturing of battery components that result in substantial greenhouse gases emission reductions in transport, stationary and off-grid energy storage and other industrial applications. Battery components produced by FORVIA contribute substantially to GHG reduction in the automotive sector, for instance via start-stop functionalities and recuperation for internal combustion engines;
- ■regarding the activity 3.6 – Manufacture of other low carbon technologies, MATERI’ACT products demonstrate lifecycle GHG emission reduction between 20% and 85% depending on the product versus current materials, with GHG emissions calculated in line with ISO 14040, 14044 & 14067 and verified by an independent third party in 2023;
- ■regarding the activity 3.3 – Manufacture of low carbon technologies for transport, in line with the analysis performed for the eligibility, FORVIA considered its business activities in the service of hybrid (< 50 gCO2/km), hydrogen and electric vehicles meet the substantial contribution criteria related to the manufacture of electric, hydrogen-powered or low-carbon (< 50 gCO2/km) vehicles.
Preliminary note: All do not significant harm criteria have been assessed at FORVIA level only. FORVIA did not assess do not significant harm criteria at automotive manufacturers level.
FORVIA conducted an analysis (see Section 4.6.2 Climate transition risks for more details) of the exposure and vulnerability of its activities to climate physical risks under two global warming scenarios (IPCC scenario SSP2-4.5 and IPCC scenario SSP5-8.5) under future time horizon (2030 and 2050). For the risks identified as the most material for FORVIA activities, FORVIA developed action plans to reduce and prevent these risks. FORVIA will ensure a strong monitoring of the implementation of these action plans over the next years.
FORVIA conducted a water risk analysis covering all its production sites, to identify risks related to preserving water quality and avoiding water stress. Action plans were set up locally according to the Environmental Management System in place to cover the risks identified (see Section 4.2.4.3. Water resources for more details). The risk-based water protection approach is part of the environmental management system of these sites and is subject to operational control and monitoring of the various regulatory obligations.
Waste is managed on all production sites worldwide as well as a follow-up of the waste recycling rate is considering standards defined in European Regulation. Information on and traceability of substances of concern throughout the lifecycle of the manufactured products is managed through the International Material Data System (IMDS). In addition, FORVIA is assessing its impact on circular economy by monitoring for instance recycled content and End of Life recycling potential.
Through the automotive sector data collection system (International Management Data System) FORVIA ensures the management of hazardous substances throughout the supply chain, from suppliers to manufacturing customers, for all its eligible products delivered.
The management of substances used in FORVIA production process is ensured by FORVIA at Group level and monitored at site level through the General purchasing terms and conditions (reference to Preventing environmental pollution). FORVIA aims to ensure compliance with European Regulations, including the REACH Regulation (see Section 4.2.4.3. Preventing environmental pollution for more details). Before the validation of any entry of chemicals, the sites make sure, through operational procedures, that the use of these products complies with regulations. In 2022, some substances of very high concern (SVHC) considered as of essential use are still used in FORVIA manufacturing processes in insignificant quantities due to industrial constraints. FORVIA is continuously evaluating the possibility to replace such substances. In any case, FORVIA ensures good health and safety conditions and pollution prevention by implementing appropriate means and controls, to reduce their level of risk, regarding the use of such substances.
As of December 31, 2022, products using SVHC have been considered not aligned under the pollution prevention and control DNSH:
- ■100% of FORVIA activities eligible under activity 3.2 – Manufacture of equipment for the production and use of hydrogen meet those criteria;
- ■100% of FORVIA activities eligible under activity 3.4 – Manufacture of batteries meet those criteria;
- ■100% of FORVIA activities eligible under activity 3.6 – Manufacture of other low carbon technologies meet those criteria;
- ■99.9% of FORVIA activities eligible under activity 3.3 – Manufacture of low carbon technologies for transport meet those criteria.
FORVIA has conducted an assessment covering all its production sites to identify all its sites located near a Key Biodiversity Area (see Section 4.2.4.3. Preventing environmental pollution for more details). Management of potential impacts on biodiversity is ensured through the principles described in the FORVIA Green Factory White Book. FORVIA is also committed to Act4Nature to limit its impact on biodiversity and help preserve resources by improving knowledge of the areas of natural habitats and safeguarding biodiversity around the sites (up to 15 km) in order to implement improvement actions to reduce the sites’ local impact.
Preliminary note: Minimum safeguards have been assessed at FORVIA level only. FORVIA did not assess minimum safeguards at automotive manufacturers level.
FORVIA considers in all its business activities the OECD Guidelines for Multinational Enterprises and the UN Guiding Principles on Business and Human, including all principles and rights set out in the International Labor Organization’s Declaration on Fundamental Principles and Rights at Work and the International Bill of Human Rights. In addition, Faurecia is a signatory of the United Nations Global Compact and is committed to aligning its operations and strategy with ten universally accepted principles in the areas of human rights, labor standards, the environment, and the fight against corruption.
FORVIA respects all international commitments and principles regarding human rights and labor standards. Robust processes have been put in place to ensure that adequate due diligence is performed at all levels of our organization. An updated Human Rights Policy has been published, laying out our expectations for our stakeholders regarding the implementation of the due diligence process.
Following a risk-based approach, human rights risks are continually analyzed, prioritized, and communicated as a preemptive measure for preventing breaches of our human rights policy. Any violation is communicated to the Executive Committee and remedial actions are immediately put in place.
FORVIA’s commitment to fight against corruption is embedded into the Code of Conduct and compliance policies. In addition, Faurecia is subject to the Sapin II French legislation and has implemented an internal compliance program to comply with the eight anti-corruption pillars.
FORVIA aims to comply with both the letter and spirit of fiscal law in countries of implantation. Our Tax Policy complies with the OECD guidelines, and all tax risks are closely monitored by the Legal, Tax and Finance departments.
FORVIA is committed to fostering a positive business environment with its partners and competitors. To do so, a global risk management program related to anti-competitive practices has been developed aimed at increasing awareness among internal stakeholders and providing preventative training activities.
FORVIA ensures close legal monitoring at Group and business level, with proactive identification of potential risks. Anonymous whistle-blowing hotlines “Speak Up” and “tellUs” are available to all employees, business partners, suppliers, and any other stakeholder to report any violations of its Code of Conduct, human rights policy, or any other serious misconduct.
Economic Activities (1) |
Code(s) (2) |
Absolute turnover (3) |
Proportion of turnover (4) |
Substantial contribution criteria |
DNSH criteria |
Taxonomy-aligned proportion of turnover, year N (18) |
Taxonomy-aligned proportion of turnover, year N-1 (19) |
Category (enabling activity or) (20) |
Category (transitional activity) (21) |
|||||||||||
Climate change mitigation (5) |
Climate change adaptation (6) |
Water and marine resources (7) |
Circular economy (8) |
Pollution (9) |
Biodiversity and ecosystems (10) |
Climate change mitigation (11) |
Climate change adaptation (12) |
Water and marine resources (13) |
Circular economy (14) |
Pollution (15) |
Biodiversity and ecosystems (16) |
Minimum safeguards (17) |
||||||||
M€ |
% |
% |
% |
% |
% |
% |
% |
Y/N |
Y/N |
Y/N |
Y/N |
Y/N |
Y/N |
Y/N |
Percent |
Percent |
E |
T |
||
A. Taxonomy-eligible activities |
|
|
|
|
|
|
|
|
|
|
|
|
|
|
|
|
|
|
|
|
A.1.Environmentally sustainable activities (Taxonomy-aligned) |
|
|
|
|
|
|
|
|
|
|
|
|
|
|
|
|
|
|
|
|
Manufacture of equipment for the production and use of hydrogen |
3.2 |
28.0 |
0.1% |
100% |
0% |
0% |
0% |
0% |
0% |
Y |
Y |
Y |
Y |
Y |
Y |
Y |
0.1% |
|
|
|
Manufacture of batteries enabling Electric Vehicles manufacturing |
3.4 |
395.4 |
1.6% |
100% |
0% |
0% |
0% |
0% |
0% |
Y |
Y |
Y |
Y |
Y |
Y |
Y |
1.6% |
|
|
|
Manufacture of other low carbon technologies |
3.6 |
509.7 |
2.0% |
100% |
0% |
0% |
0% |
0% |
0% |
Y |
Y |
Y |
Y |
Y |
Y |
Y |
2.0% |
|
|
|
Turnover of environmentally sustainable activities (Taxonomy-aligned) (A.1) |
|
933.1 |
3.7% |
100% |
0% |
0% |
0% |
0% |
0% |
|
|
|
|
|
|
|
3.7% |
|
|
|
A.2 Taxonomy-Eligible but not environmentally sustainable activities (not Taxonomy-aligned activities) |
|
|
|
|
|
|
|
|
|
|
|
|
|
|
|
|
|
|
|
|
Manufacture of equipment for the production and use of hydrogen |
3.2 |
- |
0.0% |
|
|
|
|
|
|
|
|
|
|
|
|
|
|
|
|
|
Manufacture of batteries enabling Electric Vehicles manufacturing |
3.4 |
- |
0.0% |
|
|
|
|
|
|
|
|
|
|
|
|
|
|
|
|
|
Manufacture of other low carbon technologies |
3.6 |
- |
0.0% |
|
|
|
|
|
|
|
|
|
|
|
|
|
|
|
|
|
Turnover of Taxonomy-eligible but not environmentally sustainable activities (not Taxonomy-aligned activities) (A.2) |
|
- |
0.0% |
|
|
|
|
|
|
|
|
|
|
|
|
|
|
|
|
|
Total (A.1 + A.2) |
|
933.1 |
3.7% |
|
|
|
|
|
|
|
|
|
|
|
|
|
|
|
|
|
B. Taxonomy-non-eligible activities |
|
|
|
|
|
|
|
|
|
|
|
|
|
|
|
|
|
|
|
|
Turnover of Taxonomy-non-eligible activities (B) |
|
24,525.1 |
96.3% |
|
|
|
|
|
|
|
|
|
|
|
|
|
|
|
|
|
Total (A + B) |
|
25,458.2 |
100.0% |
|
|
|
|
|
|
|
|
|
|
|
|
|
|
|
|
|
Economic Activities (1) |
Code(s) (2) |
Absolute CapEx (3) |
Proportion of CapEx (4) |
Substantial contribution criteria |
DNSH criteria |
Taxonomy-aligned proportion of turnover, year N (18) |
Taxonomy-aligned proportion of turnover, year N-1 (19) |
Category (enabling activity or) (20) |
Category (transitional activity) (21) |
|||||||||||
Climate change mitigation (5) |
Climate change adaptation (6) |
Water and marine resources (7) |
Circular economy (8) |
Pollution (9) |
Biodiversity and ecosystems (10) |
Climate change mitigation (11) |
Climate change adaptation (12) |
Water and marine resources (13) |
Circular economy (14) |
Pollution (15) |
Biodiversity and ecosystems (16) |
Minimum safeguards (17) |
||||||||
M€ |
% |
% |
% |
% |
% |
% |
% |
Y/N |
Y/N |
Y/N |
Y/N |
Y/N |
Y/N |
Y/N |
Percent |
Percent |
E |
T |
||
A. Taxonomy-eligible activities |
|
|
|
|
|
|
|
|
|
|
|
|
|
|
|
|
|
|
|
|
A.1.Environmentally sustainable activities (Taxonomy-aligned) |
|
|
|
|
|
|
|
|
|
|
|
|
|
|
|
|
|
|
|
|
Manufacture of equipment for the production and use of hydrogen |
3.2 |
18.7 |
0.8% |
100% |
0% |
0% |
0% |
0% |
0% |
Y |
Y |
Y |
Y |
Y |
Y |
Y |
0.8% |
|
|
|
Manufacture of batteries enabling Electric Vehicles manufacturing |
3.4 |
54.8 |
2.3% |
100% |
0% |
0% |
0% |
0% |
0% |
Y |
Y |
Y |
Y |
Y |
Y |
Y |
2.3% |
|
|
|
Manufacture of other low carbon technologies |
3.6 |
6.3 |
0.3% |
100% |
0% |
0% |
0% |
0% |
0% |
Y |
Y |
Y |
Y |
Y |
Y |
Y |
0.3% |
|
|
|
CapEx of environmentally sustainable activities (Taxonomy-aligned) (A.1) |
|
79.7 |
3.4% |
100% |
0% |
0% |
0% |
0% |
0% |
|
|
|
|
|
|
|
3.4% |
|
|
|
A.2 Taxonomy-Eligible but not environmentally sustainable activities (not Taxonomy-aligned activities) |
|
|
|
|
|
|
|
|
|
|
|
|
|
|
|
|
|
|
|
|
Manufacture of equipment for the production and use of hydrogen |
3.2 |
- |
0.0% |
|
|
|
|
|
|
|
|
|
|
|
|
|
|
|
|
|
Manufacture of batteries enabling Electric Vehicles manufacturing |
3.4 |
- |
0.0% |
|
|
|
|
|
|
|
|
|
|
|
|
|
|
|
|
|
Manufacture of other low carbon technologies |
3.6 |
- |
0.0% |
|
|
|
|
|
|
|
|
|
|
|
|
|
|
|
|
|
CapEx of Taxonomy-eligible but not environmentally sustainable activities (not Taxonomy-aligned activities) (A.2) |
|
- |
0.0% |
|
|
|
|
|
|
|
|
|
|
|
|
|
|
|
|
|
Total (A.1 + A.2) |
|
79.7 |
3.4% |
|
|
|
|
|
|
|
|
|
|
|
|
|
|
|
|
|
B. Taxonomy-non-eligible activities |
|
|
|
|
|
|
|
|
|
|
|
|
|
|
|
|
|
|
|
|
CapEx of Taxonomy-non-eligible activities (B) |
|
2,260.3 |
96.6% |
|
|
|
|
|
|
|
|
|
|
|
|
|
|
|
|
|
Total (A + B) |
|
2,340.0 |
100.0% |
|
|
|
|
|
|
|
|
|
|
|
|
|
|
|
|
|
Economic Activities (1) |
Code(s) (2) |
Absolute |
Proportion of OpEx (4) |
Substantial contribution criteria |
DNSH criteria |
Taxonomy-aligned proportion of turnover, year N (18) |
Taxonomy-aligned proportion of turnover, year N-1 (19) |
Category (enabling activity or) (20) |
Category (transitional activity) (21) |
|||||||||||
Climate change mitigation (5) |
Climate change adaptation (6) |
Water and marine resources (7) |
Circular economy (8) |
Pollution (9) |
Biodiversity and ecosystems (10) |
Climate change mitigation (11) |
Climate change adaptation (12) |
Water and marine resources (13) |
Circular economy (14) |
Pollution (15) |
Biodiversity and ecosystems (16) |
Minimum safeguards (17) |
||||||||
M€ |
% |
% |
% |
% |
% |
% |
% |
Y/N |
Y/N |
Y/N |
Y/N |
Y/N |
Y/N |
Y/N |
Percent |
Percent |
E |
T |
||
A. Taxonomy-eligible activities |
|
|
|
|
|
|
|
|
|
|
|
|
|
|
|
|
|
|
|
|
A.1.Environmentally sustainable activities (Taxonomy-aligned) |
|
|
|
|
|
|
|
|
|
|
|
|
|
|
|
|
|
|
|
|
Manufacture of equipment for the production and use of hydrogen |
3.2 |
(27.8) |
1.8% |
100% |
0% |
0% |
0% |
0% |
0% |
Y |
Y |
Y |
Y |
Y |
Y |
Y |
1.8% |
|
|
|
Manufacture of batteries enabling Electric Vehicles manufacturing |
3.4 |
(14.2) |
0.9% |
100% |
0% |
0% |
0% |
0% |
0% |
Y |
Y |
Y |
Y |
Y |
Y |
Y |
0.9% |
|
|
|
Manufacture of other low carbon technologies |
3.6 |
(22.4) |
1.5% |
100% |
0% |
0% |
0% |
0% |
0% |
Y |
Y |
Y |
Y |
Y |
Y |
Y |
1.5% |
|
|
|
OpEx of environmentally sustainable activities (Taxonomy-aligned) (A.1) |
|
(64.5) |
4.3% |
100% |
0% |
0% |
0% |
0% |
0% |
|
|
|
|
|
|
|
4.3% |
|
|
|
A.2 Taxonomy-Eligible but not environmentally sustainable activities (not Taxonomy-aligned activities) |
|
|
|
|
|
|
|
|
|
|
|
|
|
|
|
|
|
|
|
|
Manufacture of equipment for the production and use of hydrogen |
3.2 |
- |
0.0% |
|
|
|
|
|
|
|
|
|
|
|
|
|
|
|
|
|
o/w Lifecycle Solutions |
|
- |
0.0% |
|
|
|
|
|
|
|
|
|
|
|
|
|
|
|
|
|
Manufacture of batteries enabling Electric Vehicles manufacturing |
3.4 |
- |
0.0% |
|
|
|
|
|
|
|
|
|
|
|
|
|
|
|
|
|
Manufacture of other low carbon technologies |
3.6 |
- |
0.0% |
|
|
|
|
|
|
|
|
|
|
|
|
|
|
|
|
|
OpEx of Taxonomy-eligible but not environmentally sustainable activities (not Taxonomy-aligned activities) (A.2) |
|
- |
0.0% |
|
|
|
|
|
|
|
|
|
|
|
|
|
|
|
|
|
Total (A.1 + A.2) |
|
(64.5) |
4.3% |
|
|
|
|
|
|
|
|
|
|
|
|
|
|
|
|
|
B. Taxonomy-non-eligible activities |
|
|
|
|
|
|
|
|
|
|
|
|
|
|
|
|
|
|
|
|
OpEx of Taxonomy-non-eligible activities (B) |
|
(1,444.9) |
95.7% |
|
|
|
|
|
|
|
|
|
|
|
|
|
|
|
|
|
Total (A + B) |
|
(1,509.4) |
100.0% |
|
|
|
|
|
|
|
|
|
|
|
|
|
|
|
|
|
The denominators of the KPI were defined in accordance with the definition of the delegated act of July 6, 2021, and its appendices supplementing the Taxonomy Regulation.
The underlying financial information was checked jointly by the finance and operational teams to ensure consistency and reconciliation with the annual financial statements. They are presented after elimination of reciprocal transactions and cover the entire scope of consolidation of the Group (excluding companies consolidated by the equity method).
The total turnover used as the denominator for the calculation of the Turnover Taxonomy KPI amounts to €25,458.2 million as of December 31, 2022, and corresponds to the total amount of sales disclosed in the Group consolidated financial statements.
The eligible turnover amounts to €933.1 million as of December 31, 2022, and corresponds to the following activities:
- ■€28.0 million related to hydrogen storage systems;
- ■€395.4 million related to the sale of batteries components;
- ■€509.7 million related to the MATERI’ACT activity.
The aligned turnover amounts to €933.1 million as of December 31, 2022, and corresponds to the following activities:
- ■€28.0 million related to hydrogen storage systems;
- ■€395.4 million related to the sale of batteries components;
- ■€509.7 million related to the MATERI’ACT activity.
As of December 31, 2022, the total capital expenditures used as a denominator for the calculation of the Taxonomy capital expenditure indicator amounts to €2,340.0 million and corresponds to additions to tangible and intangible assets over the period, including capitalized development costs and additions related to business combinations.
It can be reconciled as follows with the figures displayed in the notes 11 and 12.a of the Consolidated Financial statements and with the figures displayed into the Consolidated Cash flow statement.
Capital expenditure related to eligible and aligned activities were also classified as eligible and aligned. It is only this type of capital expenditure that is reported in the eligibility and alignment ratios.
“Individual” capital expenditure is not included in the calculation of the ratios: it is not material and cannot be identified. This will correspond mainly to capitalized expenditure on the energy efficiency of buildings meeting the requirements of activities 7.3 to 7.6 of the Taxonomy Regulation.
The eligible capital expenditures amount to €79.7 million as of December 31, 2022, and correspond to the following activities:
- ■€18.7 million related to hydrogen storage systems;
- ■€54.8 million related to the sale of batteries components;
- ■€6.3 million related to the MATERI’ACT activity.
The aligned capital expenditures amount to €79.7 million as of December 31, 2022, and correspond to the following activities:
- ■€18.7 million related to hydrogen storage systems;
- ■€54.8 million related to the sale of batteries components;
- ■€6.3 million related to the MATERI’ACT activity.
As of December 31, 2022, the total operating expenditures used as a denominator for the calculation of the Taxonomy operating expenditure indicator amount to €1,509.4 million and correspond essentially to not capitalized R&D expenses, and maintenance and repair expenses.
The operating expenses related to the eligible and aligned activities were qualified as eligible and aligned and estimated on the basis of the eligible and aligned revenue ratio according to allocation keys. They include R&D expenses, upkeep, maintenance, and repair of assets, building renovation measures and any other expenses related to the daily maintenance of assets. They do not include purchases of renewable energy, electricity, and heat (scopes 1 and 2) and non-capitalized expenses incurred in addressing the energy efficiency of the sites.
Key Performance Indicators as of December 31, 2022 including the assessment of activity 3.3
(as commented in paragraph above for eligible activities)
Economic Activities (1) |
Code(s) (2) |
Absolute turnover (3) |
Proportion of turnover (4) |
Substantial contribution criteria |
DNSH criteria |
Taxonomy-aligned proportion of turnover, year N (18) |
Taxonomy-aligned proportion of turnover, year N-1 (19) |
Category (enabling activity or) (20) |
Category (transitional activity) (21) |
|||||||||||
Climate change mitigation (5) |
Climate change adaptation (6) |
Water and marine resources (7) |
Circular economy (8) |
Pollution (9) |
Biodiversity and ecosystems (10) |
Climate change mitigation (11) |
Climate change adaptation (12) |
Water and marine resources (13) |
Circular economy (14) |
Pollution (15) |
Biodiversity and ecosystems (16) |
Minimum safeguards (17) |
||||||||
M€ |
% |
% |
% |
% |
% |
% |
% |
Y/N |
Y/N |
Y/N |
Y/N |
Y/N |
Y/N |
Y/N |
Percent |
Percent |
E |
T |
||
A. Taxonomy-eligible activities |
|
|
|
|
|
|
|
|
|
|
|
|
|
|
|
|
|
|
|
|
A.1.Environmentally sustainable activities (Taxonomy-aligned) |
|
|
|
|
|
|
|
|
|
|
|
|
|
|
|
|
|
|
|
|
3.2. Manufacture of equipment for the production and use of hydrogen |
|
28.0 |
0.1% |
100% |
0% |
0% |
0% |
0% |
0% |
Y |
Y |
Y |
Y |
Y |
Y |
Y |
0.1% |
|
|
|
3.3 Manufacture of low carbon technologies for transport |
|
4,539.9 |
17.8% |
100% |
0% |
0% |
0% |
0% |
0% |
Y |
Y |
Y |
Y |
Y |
Y |
Y |
17.8% |
|
|
|
3.4. Manufacture of batteries enabling Electric Vehicles manufacturing |
|
395.4 |
1.6% |
100% |
0% |
0% |
0% |
0% |
0% |
Y |
Y |
Y |
Y |
Y |
Y |
Y |
1.6% |
|
|
|
3.6 Manufacture of other low carbon technologies |
|
509.7 |
2.0% |
100% |
0% |
0% |
0% |
0% |
0% |
Y |
Y |
Y |
Y |
Y |
Y |
Y |
2.0% |
|
|
|
Turnover of environmentally sustainable activities (Taxonomy-aligned) (A.1) |
|
5,473.1 |
21.5% |
100% |
0% |
0% |
0% |
0% |
0% |
|
|
|
|
|
|
|
21.5% |
|
|
|
A.2 Taxonomy-Eligible but not environmentally sustainable activities (not Taxonomy-aligned activities) |
|
|
|
|
|
|
|
|
|
|
|
|
|
|
|
|
|
|
|
|
3.2. Manufacture of equipment for the production and use of hydrogen |
|
- |
0.0% |
|
|
|
|
|
|
|
|
|
|
|
|
|
|
|
|
|
3.3 Manufacture of low carbon technologies for transport |
|
25.9 |
0.1% |
|
|
|
|
|
|
|
|
|
|
|
|
|
|
|
|
|
3.4. Manufacture of batteries enabling Electric Vehicles manufacturing |
|
- |
0.0% |
|
|
|
|
|
|
|
|
|
|
|
|
|
|
|
|
|
3.6 Manufacture of other low carbon technologies |
|
- |
0.0% |
|
|
|
|
|
|
|
|
|
|
|
|
|
|
|
|
|
Turnover of Taxonomy-eligible but not environmentally sustainable activities (not Taxonomy-aligned activities) (A.2) |
|
25.9 |
0.1% |
|
|
|
|
|
|
|
|
|
|
|
|
|
|
|
|
|
Total (A.1 + A.2) |
|
5,499.0 |
21.6% |
|
|
|
|
|
|
|
|
|
|
|
|
|
|
|
|
|
B. Taxonomy-non-eligible activities |
|
|
|
|
|
|
|
|
|
|
|
|
|
|
|
|
|
|
|
|
Turnover of Taxonomy-non-eligible activities (B) |
|
19,959.2 |
78.4% |
|
|
|
|
|
|
|
|
|
|
|
|
|
|
|
|
|
Total (A + B) |
|
25,458.2 |
100.0% |
|
|
|
|
|
|
|
|
|
|
|
|
|
|
|
|
|
Economic Activities (1) |
Code(s) (2) |
Absolute CapEx (3) |
Proportion of CapEx (4) |
Substantial contribution criteria |
DNSH criteria |
Taxonomy-aligned proportion of turnover, year N (18) |
Taxonomy-aligned proportion of turnover, year N-1 (19) |
Category (enabling activity or) (20) |
Category (transitional activity) (21) |
|||||||||||
Climate change mitigation (5) |
Climate change adaptation (6) |
Water and marine resources (7) |
Circular economy (8) |
Pollution (9) |
Biodiversity and ecosystems (10) |
Climate change mitigation (11) |
Climate change adaptation (12) |
Water and marine resources (13) |
Circular economy (14) |
Pollution (15) |
Biodiversity and ecosystems (16) |
Minimum safeguards (17) |
||||||||
M€ |
% |
% |
% |
% |
% |
% |
% |
Y/N |
Y/N |
Y/N |
Y/N |
Y/N |
Y/N |
Y/N |
Percent |
Percent |
E |
T |
||
A. Taxonomy-eligible activities |
|
|
|
|
|
|
|
|
|
|
|
|
|
|
|
|
|
|
|
|
A.1.Environmentally sustainable activities (Taxonomy-aligned) |
|
|
|
|
|
|
|
|
|
|
|
|
|
|
|
|
|
|
|
|
3.2. Manufacture of equipment for the production and use of hydrogen |
|
18.7 |
0.8% |
100% |
0% |
0% |
0% |
0% |
0% |
Y |
Y |
Y |
Y |
Y |
Y |
Y |
0.8% |
|
|
|
3.3 Manufacture of low carbon technologies for transport |
|
395.6 |
16.9% |
100% |
0% |
0% |
0% |
0% |
0% |
Y |
Y |
Y |
Y |
Y |
Y |
Y |
16.9% |
|
|
|
3.4. Manufacture of batteries enabling Electric Vehicles manufacturing |
|
54.8 |
2.3% |
100% |
0% |
0% |
0% |
0% |
0% |
Y |
Y |
Y |
Y |
Y |
Y |
Y |
2.3% |
|
|
|
3.6 Manufacture of other low carbon technologies |
|
6.3 |
0.3% |
100% |
0% |
0% |
0% |
0% |
0% |
Y |
Y |
Y |
Y |
Y |
Y |
Y |
0.3% |
|
|
|
CapEx of environmentally sustainable activities (Taxonomy-aligned) (A.1) |
|
475.3 |
20.3% |
100% |
0% |
0% |
0% |
0% |
0% |
|
|
|
|
|
|
|
20.3% |
|
|
|
A.2 Taxonomy-Eligible but not environmentally sustainable activities (not Taxonomy-aligned activities) |
|
|
|
|
|
|
|
|
|
|
|
|
|
|
|
|
|
|
|
|
3.2. Manufacture of equipment for the production and use of hydrogen |
|
- |
0.0% |
|
|
|
|
|
|
|
|
|
|
|
|
|
|
|
|
|
3.3 Manufacture of low carbon technologies for transport |
|
0.2 |
0.0% |
|
|
|
|
|
|
|
|
|
|
|
|
|
|
|
|
|
3.4. Manufacture of batteries enabling Electric Vehicles manufacturing |
|
- |
0.0% |
|
|
|
|
|
|
|
|
|
|
|
|
|
|
|
|
|
3.6 Manufacture of other low carbon technologies |
|
- |
0.0% |
|
|
|
|
|
|
|
|
|
|
|
|
|
|
|
|
|
CapEx of Taxonomy-eligible but not environmentally sustainable activities (not Taxonomy-aligned activities) (A.2) |
|
0.2 |
0.0% |
|
|
|
|
|
|
|
|
|
|
|
|
|
|
|
|
|
Total (A.1 + A.2) |
|
475.4 |
20.3% |
|
|
|
|
|
|
|
|
|
|
|
|
|
|
|
|
|
B. Taxonomy-non-eligible activities |
|
|
|
|
|
|
|
|
|
|
|
|
|
|
|
|
|
|
|
|
CapEx of Taxonomy-non-eligible activities (B) |
|
1,864.6 |
79.7% |
|
|
|
|
|
|
|
|
|
|
|
|
|
|
|
|
|
Total (A + B) |
|
2,340.0 |
100.0% |
|
|
|
|
|
|
|
|
|
|
|
|
|
|
|
|
|
Economic Activities (1) |
Code(s) (2) |
Absolute |
Proportion of OpEx (4) |
Substantial contribution criteria |
DNSH criteria |
Taxonomy-aligned proportion of turnover, year N (18) |
Taxonomy-aligned proportion of turnover, year N-1 (19) |
Category (enabling activity or) (20) |
Category (transitional activity) (21) |
|||||||||||
Climate change mitigation (5) |
Climate change adaptation (6) |
Water and marine resources (7) |
Circular economy (8) |
Pollution (9) |
Biodiversity and ecosystems (10) |
Climate change mitigation (11) |
Climate change adaptation (12) |
Water and marine resources (13) |
Circular economy (14) |
Pollution (15) |
Biodiversity and ecosystems (16) |
Minimum safeguards (17) |
||||||||
M€ |
% |
% |
% |
% |
% |
% |
% |
Y/N |
Y/N |
Y/N |
Y/N |
Y/N |
Y/N |
Y/N |
Percent |
Percent |
E |
T |
||
A. Taxonomy-eligible activities |
|
|
|
|
|
|
|
|
|
|
|
|
|
|
|
|
|
|
|
|
A.1.Environmentally sustainable activities (Taxonomy-aligned) |
|
|
|
|
|
|
|
|
|
|
|
|
|
|
|
|
|
|
|
|
3.2. Manufacture of equipment for the production and use of hydrogen |
|
(27.8) |
1.8% |
100% |
0% |
0% |
0% |
0% |
0% |
Y |
Y |
Y |
Y |
Y |
Y |
Y |
1.8% |
|
|
|
3.3 Manufacture of low carbon technologies for transport |
|
(165.8) |
11.0% |
100% |
0% |
0% |
0% |
0% |
0% |
Y |
Y |
Y |
Y |
Y |
Y |
Y |
11.0% |
|
|
|
3.4. Manufacture of batteries enabling Electric Vehicles manufacturing |
|
(14.2) |
0.9% |
100% |
0% |
0% |
0% |
0% |
0% |
Y |
Y |
Y |
Y |
Y |
Y |
Y |
0.9% |
|
|
|
3.6 Manufacture of other low carbon technologies |
|
(22.4) |
1.5% |
100% |
0% |
0% |
0% |
0% |
0% |
Y |
Y |
Y |
Y |
Y |
Y |
Y |
1.5% |
|
|
|
OpEx of environmentally sustainable activities (Taxonomy-aligned) (A.1) |
|
(230.3) |
15.3% |
100% |
0% |
0% |
0% |
0% |
0% |
|
|
|
|
|
|
|
15.3% |
|
|
|
A.2 Taxonomy-Eligible but not environmentally sustainable activities (not Taxonomy-aligned activities) |
|
|
|
|
|
|
|
|
|
|
|
|
|
|
|
|
|
|
|
|
3.2. Manufacture of equipment for the production and use of hydrogen |
|
- |
0.0% |
|
|
|
|
|
|
|
|
|
|
|
|
|
|
|
|
|
3.3 Manufacture of low carbon technologies for transport |
|
(0.5) |
0.0% |
|
|
|
|
|
|
|
|
|
|
|
|
|
|
|
|
|
3.4. Manufacture of batteries enabling Electric Vehicles manufacturing |
|
- |
0.0% |
|
|
|
|
|
|
|
|
|
|
|
|
|
|
|
|
|
3.6 Manufacture of other low carbon technologies |
|
- |
0.0% |
|
|
|
|
|
|
|
|
|
|
|
|
|
|
|
|
|
OpEx of Taxonomy-eligible but not environmentally sustainable activities (not Taxonomy-aligned activities) (A.2) |
|
(0.5) |
0.0% |
|
|
|
|
|
|
|
|
|
|
|
|
|
|
|
|
|
Total (A.1 + A.2) |
|
(230.8) |
15.3% |
|
|
|
|
|
|
|
|
|
|
|
|
|
|
|
|
|
B. Taxonomy-non-eligible activities |
|
|
|
|
|
|
|
|
|
|
|
|
|
|
|
|
|
|
|
|
OpEx of Taxonomy-non-eligible activities (B) |
|
(1,278.7) |
84.7% |
|
|
|
|
|
|
|
|
|
|
|
|
|
|
|
|
|
Total (A + B) |
|
(1,509.4) |
100.0% |
|
|
|
|
|
|
|
|
|
|
|
|
|
|
|
|
|
The eligible turnover amounts to €5,499.0 million as of December 31, 2022, and corresponds to the following activities:
- ■€28.0 million related to hydrogen storage systems;
- ■€395.4 million related to the sale of batteries components;
- ■€509.7 million related to the MATERI’ACT activity;
- ■€4,565.9 million related to activities in the service of hybrid (< 50 gCO2/km), hydrogen and electric vehicles.
The aligned turnover amounts to €5,473.1 million as of December 31, 2022, and corresponds to the following activities:
- ■€28.0 million related to hydrogen storage systems;
- ■€395.4 million related to the sale of batteries components;
- ■€509.7 million related to the MATERI’ACT activity;
- ■€4,539.9 million related to activities in the service of hybrid (< 50 gCO2/km), hydrogen and electric vehicles.
The eligible capital expenditures amount to €475.4 million as of December 31, 2022, and correspond to the following activities:
- ■€18.7 million related to hydrogen storage systems;
- ■€54.8 million related to the sale of batteries components;
- ■€6.3 million related to the MATERI’ACT activity;
- ■€395.7 million related to activities in the service of hybrid (< 50 gCO2/km), hydrogen and electric vehicles.
The aligned capital expenditures amount to €475.3 million as of December 31, 2022, and correspond to the following activities:
- ■€18.7 million related to hydrogen storage systems;
- ■€54.8 million related to the sale of batteries components;
- ■€6.3 million related to the MATERI’ACT activity;
- ■€395.6 million related to activities in the service of hybrid (< 50 gCO2/km), hydrogen and electric vehicles.
4.2.6.2.Hydrogen technologies for zero emission mobility
FORVIA is investing heavily in hydrogen storage system technologies, eligible under category 3.2. of European taxonomy (see Section 4.2.6).
FORVIA is convinced that hydrogen mobility and fuel cell technology will occupy an important place in the propulsion energy mix for the next 10 to 15 years. The Group provides automakers with complete hydrogen storage system integration for different vehicle architectures, offering delivery of end-of-line tested turnkey systems. The Group is positioned in three markets, estimated to have a potential of €20 billion, in which it aims to generate revenue of €3.5 billion by 2030:
Hydrogen development
Produced from a multitude of energy sources, this source of storable energy generates no CO2 emissions or polluting gases when using the fuel cell-powered vehicle. Hydrogen can also be used to store excess renewable energy. Green hydrogen is produced by electrolysis of water using electricity generated by carbon-free energies. It is an essential lever for zero pollution and zero CO2 emission mobility.
As part of the “Fit for 55” legislative package, the European Union has adopted the goal of installing a hydrogen station every 100 km along main roads. FORVIA estimates that 1.2 to 1.7 million hydrogen passenger and utility vehicles will be produced worldwide by 2030.
FORVIA participates in national and international hydrogen development bodies. The Group is a Board member of the Hydrogen Council, a global organization bringing together more than 140 leading companies in the fields of energy, transport, industry and investment. In 2022, this committee published a forward-looking study on the hydrogen market and is working on the development of a second study on the role of hydrogen in global energy. The Group is also a member of Hydrogen Europe and the National Hydrogen Council in France. It was co-chaired in 2022 by Patrick Koller, Chief Executive Officer of Faurecia.
Hydrogen fuel cell systems
In 2019, Michelin and Faurecia joined forces, pooling their hydrogen fuel cell activities within Symbio, a joint company. This has brought together a unique combination of industrial and automotive expertise and innovation capability to develop, produce and market hydrogen fuel cell systems for all types of electric vehicles. With an initial investment of €140 million, Symbio brings together the business of Faurecia and Michelin in the field of hydrogen fuel cells, with a new plant dedicated to the production of fuel cells in the Lyon region. Faurecia and Symbio cover 75% of of the hydrogen propulsion system value chain. Symbio is also aiming to produce 200,000 StackPacks® – its pre-validated and pre-integrated hydrogen systems – per year by 2030, for manufacturers worldwide. In 2022, Symbio opened new production sites in France, China and the United States. The entity has also entered into a partnership with Stellantis to equip new ranges of light commercial vehicles with fuel cell systems.
Hydrogen storage systems
FORVIA produces hydrogen tanks, both for hydrogen vehicles and for the transportation and distribution of hydrogen. In 2022, the Group acquired two new production entities in China and Korea. The Group will open future sites in France (in 2023) and in the United States (in 2025).
Hydrogen storage systems for mobility
FORVIA encourages automakers to integrate hydrogen storage systems for different types of vehicles that meet industry requirements, with the delivery of turnkey systems tested at the end of the chain.
FORVIA is already recognized for its production of hydrogen storage systems for fleets of heavy vehicles and light commercial vehicles for several international manufacturers. The Group has a global industrial footprint and currently has the capacity to produce several thousand hydrogen storage systems per year, and aims to reach production of more than 100,000 tanks per year in the medium term.
The center of expertise for hydrogen storage systems in Bavans, France, has more than 200 high value-added engineer and technician positions entirely dedicated to the development of hydrogen storage systems.
- ■with HYVIA, a subsidiary of Renault and Plug Power, for the supply hydrogen storage systems for fuel cell-powered light commercial vehicles;
- ■in Germany, for the Bavarian region, the Group will equip a fleet of heavy vehicles supplied by the manufacturer MAN with complete hydrogen storage systems;
- ■with Hyundai Motor Company to equip 1,600 heavy goods vehicles.
Since 2021 and in parallel with the development of gaseous hydrogen storage system, the Group has been developing in partnership with Air Liquide, a global supplier of gas for the industry, a solution for storing hydrogen in liquid form for heavy mobility, providing greater autonomy for trucks and other vehicles with very intensive use cases.
Hydrogen storage systems for distribution
FORVIA develops large capacity hydrogen storage systems for transporting hydrogen. In 2022, the Group was chosen by Air Flow to deliver large capacity storage systems as part of the French Zero Emission Valley project. The objective is to provide systems for the safe transport of hydrogen within the Zero Emission Valley.
4.2.6.3.Battery systems technologies
The strong growth of electric vehicles increases the need for eligible battery system technologies according to category 3.4 of the European taxonomy (see Section 4.2.6). FORVIA is developing integrated thermal and energy management solutions for batteries and lightweight compartments for more economical electric driving.
Battery management systems (BMSs) from FORVIA ensure the safe and reliable operation of the lithium-ion batteries in fully electric vehicles and hybrid and rechargeable vehicles (Plug in and Hybrid Vehicles – PHEVs). These BMSs monitor battery voltage, temperature and current, while providing various safety functions, including those related to high voltage. Modular and scalable, BMSs are designed to be integrated into various electronic command and control systems.
The Group’s expertise is also illustrated in the thermal management of battery cooling circuits, electric motors and vehicle interiors. Smart battery sensors measure the state of charge and health of the vehicle’s batteries.
48V DC/DC converter
FORVIA’s 48V DC/DC converter enables the two-way transmission of energy between the 48V and 12V networks for light hybrid vehicles, while powering fuel-saving options such as electric power steering or windshield heating. It also enables CO2 reduction functionalities such as energy recovery during braking, improved Start-Stop function, and idle coasting mode with the engine off.
4.2.6.4.Low-carbon vehicle technologies
Whether they are hybrid, hydrogen or electric vehicles, low-carbon vehicles are characterized by emissions of less than 50 gCO2/km. FORVIA is developing eligible technological systems for these vehicles in accordance with category 3.3 of the European taxonomy (see Section 4.2.2). The systems aim for sustainable design and materials, energy efficiency, extending the life of products and increasing their recyclability.
Complete systems for interiors
FORVIA develops sustainable materials for instrument panels, door panels and center consoles, as well as for the seamless integration of smart functionalities. The use of bio-sourced materials (for example plant fibers mixed with a resin) makes it possible to reduce the weight of the vehicle’s parts and considerably reduce environmental impacts.
FORVIA’s innovation program “Interior for the Planet” is based on three pillars: using less, incorporating recyclable and recycled materials, and creating alternatives to petroleum solutions. By 2030, FORVIA aims to reduce the carbon footprint of its new interiors by up to 85% throughout their life cycle.
Seating and seating systems
FORVIA develops complete and eco-designed technologies for seats: seat mechanisms and frames, covers and comfort solutions aimed at optimizing safety, comfort and well-being. As an alternative to leather, the Group is working on textiles with a low CO2eq content. It is also innovating to reduce the complexity of the design of its seats from 80 to 20 elements. This innovation, based on frugality, will facilitate the customization and renovation of the seats throughout their life, as well as their recycling at their end-of-life.
FORVIA’s innovation program “Seat for the Planet” is based on life cycle management. It implements five requirements:
- ■use sustainable materials: natural, low-carbon, recycled or recyclable;
- ■use less (and reduce waste during manufacturing);
- ■avoid mixed materials (to facilitate their recyclability);
- ■focus on fully satisfying the consumer experiences and needs;
- ■design seats that are easy to assemble and disassemble.
By 2030, FORVIA aims to reduce the carbon footprint of its seats by up to 55%, throughout their entire life cycle.
The DECORE project (Decarbonation, COckpit, REcycling/Reconditioning) was created by Faurecia with Renault, the French Atomic Energy and Alternative Energies Commission (CEA) and MTB Recycling. Its purpose is to:
- ■reduce the carbon footprint of vehicles of the future using technologies that emit the least CO2;
- ■increase the useful life of vehicles through modernization and refurbishment;
- ■and thus provide cockpits designed with 40% recycled materials and a CO2eq impact reduced by 85% by 2030.
Electronics
Vehicle electrification is a major lever for CO2-neutral mobility. FORVIA therefore offers a complete portfolio that includes sensors and actuators, automated driving, lighting, body electronics, cockpit electronics, human-machine interface, displays and energy management. FORVIA’s Advanced Driver Assistance Systems (ADAS) contribute to reducing CO2 emissions when driving.
Range of electric mirrors
FORVIA’s range of electric mirrors replaces traditional exterior mirrors. A smart sensor provides drivers with a dynamic view and safety alerts, improving fuel consumption by up to 1.6% and reducing CO2 emissions to as little as 4.6 g/km.
Clean mobility
One-third of the energy currently produced by automotive drive trains is lost in the form of heat by the exhaust system. FORVIA’s Exhaust Heat Recovery Systems (EHRS) is suitable for use in hybrid vehicles. It allows them to run more often in electric mode, which saves fuel and reduces CO2 emissions.
Compact EHRS
FORVIA’s compact EHRS can be installed close to the engine for maximum heat recovery. It reduces fuel consumption by 3 to 7% in cold weather thanks to faster engine warm-up and increased use of electric mode.
4.2.6.5.Other sustainable technologies
FORVIA develops sustainable materials that offer substantial reductions in greenhouse gas emissions throughout the life cycle compared to the most efficient alternative technologies available on the market.
NAFILean®
FORVIA’s NAFILean® technologies incorporate hemp fibers into interior components made of non-visible plastic. In addition to being fully recyclable, they can reduce weight by as much as 40% and up to 95% of CO2 emissions compared to a market benchmark. Around 13 million vehicles worldwide are already equipped with NAFILean® products.
FORVIA en 2022
- ■2 073 € millions in R&D investments
(R&D expenses including depreciation and amortization of capitalized development costs)
4.2.7.Environmental performance indicators
|
Faurecia reference year 2019 |
FORVIA reference year 2019 |
Faurecia 2021 |
Faurecia 2022 |
Faurecia 2022 |
FORVIA |
FORVIA |
---|---|---|---|---|---|---|---|
Energy consumption, overall and by source |
|||||||
Electricity |
67.1% |
67.2% |
68.3% |
71.9% |
3.6 pts |
67.4% |
71.6% |
Of which renewable electricity (share in total electricity consumption) |
0.0% |
0.0% |
0% |
0.7% |
0.7 pts |
0% |
0.8% |
Natural Gas |
25.8% |
27.2% |
26.2% |
23.9% |
-2.3 pts |
28.5% |
24.9% |
LPG |
3.4% |
2.4% |
2.9% |
2.3% |
-0.6 pts |
2.0% |
1.5% |
External heat and cooling circuit |
2.7% |
2.3% |
1.7% |
1.1% |
-0.6 pts |
1.5% |
1.2% |
Diesel |
0.8% |
0.7% |
0.6% |
0.7% |
0.1 pts |
0.4% |
0.6% |
Gasoline |
0.0% |
0.0% |
0.0% |
0.1% |
0.1 pts |
0.0% |
0.1% |
Wood |
0.2% |
0.2% |
0.3% |
0.0% |
-0.3 pts |
0.2% |
0.0% |
Breakdown of total energy consumption by Business Group in 2021 |
|||||||
Faurecia Interiors Systems |
47% |
32% |
51% |
47% |
0.1pts |
32% |
32% |
Faurecia Automotive Seating |
26% |
18% |
25% |
26% |
1.1 pt |
17% |
18% |
Faurecia Clean Mobility |
20% |
14% |
20% |
20% |
-0.8 pts |
14% |
14% |
Faurecia Clarion Electronics |
3% |
2% |
3% |
3% |
-0.3 pts |
2% |
2% |
Faurecia Interior Modules (SAS) |
2% |
1% |
2% |
2% |
-0.2 pts |
1% |
1% |
HQ |
2% |
1% |
1% |
2% |
0.2 pts |
1% |
1% |
HELLA |
|
32% |
|
|
|
32% |
32% |
Geographic distribution of renewable energy consumption |
|||||||
Europe |
|
|
100% |
6% |
|
|
8% |
North America |
|
|
0% |
0% |
|
|
0% |
Asia |
|
|
0% |
94% |
|
|
92% |
South America |
|
|
0% |
0% |
|
|
0% |
Africa |
|
|
0% |
0% |
|
|
0% |
Share of ISO 14001 certified production plants |
|||||||
Share of ISO 14001 certified production plants ✔ |
77% |
|
85% |
88% |
+3 pts |
|
90% |
Breakdown of total amount of waste generated, in metric tons, by treatment method |
|||||||
Total (in metric tons) |
250,000 |
|
205,000 |
196,000 |
(9,000) |
|
226,000 |
Externally recycled |
59% |
|
64% |
69% |
+5 pts |
|
70% |
Disposed of in landfill |
18% |
|
17% |
12% |
-5 pts |
|
11% |
Incinerated with energy recovery |
13% |
|
13% |
11% |
-2 pts |
|
11% |
Reused externally, without transformation |
2% |
|
1% |
1% |
- |
|
1% |
Eliminated by other treatments |
3% |
|
3% |
3% |
- |
|
3% |
Incinerated without energy recovery |
1% |
|
2% |
3% |
+1 pt |
|
3% |
Unknown treatment sector |
3% |
|
1% |
<1% |
- |
|
1% |
Breakdown of quantities of water consumed by use |
|||||||
Domestic use of water |
36% |
|
67% |
68% |
+1 pt |
|
65% |
Industrial use |
64% |
|
33% |
32% |
-1 pt |
|
35% |
Water consumption by source of supply in m3 |
|||||||
City water network |
2,144,000 |
|
2,177,000 |
2,080,000 |
(97,000) |
|
2,630,000 |
Water table |
794,000 |
|
511,000 |
168,000 |
(343,000) |
|
396,000 |
Surface water |
40,000 |
|
19,000 |
5,000 |
(14,000) |
|
101,000 |
Total |
2,978,000 |
|
2,707,000 |
2,253,000 |
(454,000) |
|
3,127,000 |
Destination of released water |
|||||||
Discharged into the natural environment with on-site treatment |
14% |
|
12% |
7% |
-5 pts |
|
7% |
Released to the Public Wastewater network |
67% |
|
74% |
91% |
+17 pts |
|
91% |
Released into the environment without on-site treatment (used for open loop water cooling system) |
17% |
|
13% |
0.1% |
-12.9pts |
|
0.1% |
Released into the environment without on-site treatment |
2% |
|
1% |
0.5% |
-0.5 pts |
|
0.5% |
4.3.Business: perform in a responsible way
With a global presence and more than 150,000 employees in 2022, FORVIA is convinced of the importance of promoting a culture of integrity, safety and vigilance wherever the Group operates.
A member of the United Nations Global Compact since 2004, Faurecia is committed to respecting and promoting the international conventions of the International Labor Organization (ILO) on human rights, labor standards and the environment in its business practices.
The Faurecia Code of Ethics contains all of its rules and principles, which must be understood and respected in all countries, by all employees and partners, in each line of business. Faurecia is therefore committed to:
- ■remaining vigilant and complying with the highest ethical standards (see Section 4.3.1): this is an essential part of the corporate culture, anchored in Faurecia’s convictions and values;
- ■guaranteeing a safe working environment for all staff working on its sites (see Section 4.3.2), whether they are employees or external parties;
- ■developing products and services of irreproachable quality and safety and technologies for an ever safer and smarter driving environment (see Section 4.3.3);
- ■building a responsible supply chain (see Section 4.3.4) through solid and lasting relationships with suppliers whose ethical and social values and environmental priorities are aligned with our own.
In 2022, Faurecia and HELLA continued to align their management systems with a common FORVIA approach, taking into account, among other things, the French anti-corruption law Sapin II.
4.3.1.Business ethics
4.3.1.1.Ethics and compliance
Ethics and compliance culture
Faurecia’s ethics and compliance program helps to build a strong culture of integrity. It includes policies and procedures that are the subject of training and communication campaigns.
Code of Ethics
Created in 2005 and revised several times, the Code of Ethics(5) of Faurecia encompasses respect for human rights and fundamental labor rights, economic and social dialog, respect for the environment, ethics and rules of conduct – in particular those related to the prevention and detection of corruption.
It includes updates to Faurecia’s compliance systems and tools resulting from the requirements of the Sapin II law. The Code is intended to strengthen the Group’s ethical culture. The Management Code and the other systems, such as the Anti-Corruption Code of Conduct and the Best Practices Guide in the fight against anti-competitive practices, translate many of the principles set out in the Code of Ethics into operational requirements (see also Chapter 2 of this document).
Whistle-blowing procedure
In accordance with the Sapin II law and the law on the duty of vigilance (see Section 4.3.4.4), Faurecia has set up an alert system to manage allegations of violations of regulations and the Group’s internal rules. Thus, employees (including temporary employees, subcontractors, etc.), partners, suppliers, and civil society (NGOs), civil society organizations and local communities have access to the reporting system described in the Code of Ethics.
Employees are invited to contact their line manager, the human resources manager or a compliance manager (including the Compliance Leaders identified within each division), orally or in writing.
The other method of reporting, accessible internally and externally to all stakeholders, is a dedicated whistle-blowing hotline – Speak-up, accessible via an internet link (http://faurecia.ethicspoint.com/). Depending on the nature and importance of the events reported, additional investigations may be launched, an inquiry may be set up or an Internal Audit decided upon.
The identity of any person using the hotline, as well as all the details enabling them to be identified, are protected and kept confidential by the persons responsible for them within Faurecia. These people are specially trained to receive and investigate this type of alert.
Alerts can be entered into the tool in the desired language by the whistle-blower. Upon receipt of this request, the investigation procedure is initiated in order to deal with it in accordance with the applicable internal and local rules. At the end of the investigation, corrective actions can be taken. The Compliance department (see Section 2) monitors the implementation of these actions and periodically reports on the trends identified.
This entire system is the subject of regular communications, which will be strengthened with civil society in 2023.
Training
In order to maintain a strong ethics and compliance culture, the Compliance department has set up different training sessions accessible to all employees (including part-time employees, interns, consultants, etc.). These training courses are tailored to Faurecia’s risk profile with which local teams may be confronted.
Along with the Human Resources, Internal Audit and Control teams, the Compliance department ensures that all the identified people are effectively trained in the internal rules, in order to maintain a strong ethics and compliance culture in the Group.
- ■Over the last three years, a total of 43,573 employees (employees, consultants, interns, etc.) have taken Ethics (22,249) and Antitrust (21,324) MOOCs.
- ■By the end of 2022, 32,070 employees (employees, consultants, interns, etc.) took the Anti-corruption MOOC, including 96.2% of the target population.
- ■Refresher training sessions are regularly organized at the industrial sites and in the divisions, in particular on the risks of breaches of best practices in the fight against anti-competitive practices.
Employees also have access to practical guides on anti-competitive practices, reporting and managing conflicts of interest and the internal whistle-blowing procedure on allegations of non-compliance with the Code of Ethics. Significant communication efforts have ensured that these guides are widely distributed.
Risk identification and monitoring
In 2020, in addition to these actions, and in the context of the Sapin II law in particular, the risk of corruption mapping was updated based on interviews and questionnaires sent to people exposed to the identified corruption risks. It is currently being updated on the basis of the new compliance indicators that were created and collected in 2021 and 2022. This risk mapping takes into account various quantified data to prepare remediation plans suited to the level of residual risk. The identification of these risks is integrated into Faurecia’s overall risk mapping process (see Chapter 2).
The Compliance department works closely with legal experts on antitrust issues and with the control functions, whether permanent or periodic, in order to ensure effective control of the risks identified.
4.3.1.2.Prevention of tax evasion
In support of its overall business strategy and objectives, Faurecia’s tax policy complies with the Code of Ethics. It is entrusted to a global team of tax professionals and is based on a firm set of principles.
Regulatory compliance
Faurecia complies with the letter and spirit of applicable laws and regulations, and relies on the relevant international standards (for example, the OECD guidelines).
Faurecia ensures that tax filings and payments are made in accordance with all local regulations. The Group also maintains all tax records and performs tax reporting as required by any law in countries in which the Group operates.
Integrity and transparency
Faurecia is committed to showing integrity and total transparency and to establishing constructive relationships with the tax authorities. In the event of a legal interpretation that does not agree with the tax authorities, Faurecia is prepared to refer the matter to the competent court to defend the interpretation of the law made by the Group.
Absence of subterfuges on structures and transfers between companies
Faurecia manages tax affairs in a pro-active manner and does not use contrived or abnormal tax structures that are intended for tax avoidance, have no commercial substance and do not meet the spirit of local or international law. Faurecia does not use secret jurisdictions or so-called “tax havens” for tax avoidance.
The aim is to pay an appropriate amount of tax according to where value is created within the normal course of industrial or commercial activity. Consequently, all transfers of goods and services between companies within the Group are conducted on an arm’s length basis. The pricing of such transactions between Group companies is based on fair market terms and reflects the commercial nature of the transactions.
Meeting stakeholder expectations
The assessment of taxes respects shareholder value and fully complies with all legal and regulatory obligations, in line with stakeholders’ expectations.
4.3.1.3.Respect for human rights
Faurecia wants to ensure that human rights are respected everywhere in the world, by all its stakeholders, in particular its employees, business partners and suppliers.
Signed by the Group’s highest governing bodies, the human rights policy is based on international standards: the International Charter of Human Rights, the fundamental conventions of the ILO (1998), the guiding principles of the United Nations on Business and Human Rights (2011) and the OECD Guidelines for Multinationals (2011). It is published on the Faurecia website.
- ■the Code of Ethics (see Section 4.3.1.1);
- ■the Code of Conduct for suppliers and service providers (see Section 4.3.4);
- ■the vigilance plan (see Section 4.3.4.4).
- prohibition of child labor;
- prohibition of all forms of forced labor and free choice of employment;
- freedom of association and the right to collective bargaining;
- non-discrimination and equal opportunities;
- salaries in accordance with local law and that ensure a decent life for employees;
- regulatory working hours with respect for the health and safety of employees and the work-life balance;
- development of employee education and training;
- right to health and safety of employees in the course of their activities;
- consideration of human rights and respect for local communities when acquiring and managing land or buildings;
- respect for human rights by all staff responsible for ensuring the safety of employees and buildings.
The policy also reiterates Faurecia’s commitments to preserve the environment and natural resources and the transition to a low-carbon economy, which are prerequisites for the respect of human rights and human health. These commitments include activities regulated by international conventions, such as the prohibition of the use of mercury and other specific chemicals and the management of hazardous waste.
To avoid any infringement, any negative impact or any abuse of rights, Faurecia’s human rights approach is based on a risk assessment, preventive measures, corrective action plans, and the collection of alerts via a whistle-blowing system (see Section 4.3.4.4).
Within its Business Groups, Faurecia annually analyzes the risks – at Group and local level – and the conclusions of the complaints procedure. Human rights or environmental violations would lead to prompt corrective measures.
Within the Business Group supply chains, Faurecia also relies on risk analysis to prevent and eliminate violations of human and environmental rights, in particular via its partner EcoVadis, which enables the Group to assess its suppliers. Faurecia reserves the right to verify the compliance of its suppliers with the obligations imposed concerning these issues: supplier self-assessments, on-site visits and audits. In the event of violations, corrective measures are taken, and Faurecia may ultimately re-examine the business relationship.
4.3.2.Workplace safety
Faurecia undertakes to guarantee a safe working environment for all staff working on its sites, whether they are employees or external parties. The Group takes actions that aim to reduce the main safety risks identified: that of physical injury related to production activities, and that of occupational illnesses related to the ergonomics of workstations.
Faurecia has set two priorities: protecting the health of employees and improving workplace safety. To this end, the Group is committed to implementing the policies and measures necessary to anticipate and manage the risks that could affect the safety of employees and subcontractors in their daily operations.
|
2019 Year of reference |
2021 |
2022 |
Target |
|
Faurecia |
Faurecia |
Faurecia |
FORVIA |
FORVIA 2027 |
|
NFPD Accidents per million hours worked without lost time (FR1t indicator) |
2.05 (NB: baseline without SAS) |
1.49 |
1.47 |
2.08 |
1.5 |
Accidents per million hours worked with lost time (FR0t indicator) involving an employee or temporary worker |
0.82 (NB: baseline without SAS) |
0.72 |
0.82 |
1.31 |
- |
In 2022, the focus was on the proper application of the rules common to all, the “Seven Fundamental Principles for Safety”, in particular in the sites that had the highest FR1t frequency rate during the previous year. Systematic audits have highlighted operational priorities and helped to support managers to accelerate the deployment of their accident prevention system. This had a positive impact from the second half of 2022.
For 2023, the focus will be on integrating HELLA into this approach in order to accelerate convergence with the rest of the Group.
4.3.2.1.Excellence approach: Faurecia Excellence System
The health and safety of employees is the cornerstone of Faurecia’s HSE management tool, the Faurecia Excellence System (FES). It is based on active methods of preventing risks that could affect employee safety, and makes it possible to regularly check their proper application and measure their effectiveness. It supports all production activities, where employees and subcontractors may be exposed to the risk of work-related accidents. It incorporates the quality, environmental and safety standards of the automotive industry, and thus helps to enable compliance with these standards: IATF 16949, ISO 14001, ISO 45001.
This tool is already deployed within the Faurecia scope, and is being rolled out across the HELLA scope.
4.3.2.2.Workplace safety culture: the CARE program
In order to create a global culture of safety and ergonomics at work, Faurecia designed the CARE program. Deployed at nearly 300 Faurecia sites worldwide, it raises awareness and engages all employees and subcontractors on a daily basis as they go about their work. This program is based on the four fundamental principles of which it is the acronym:
- ■Compliance: compliance with HSE rules through training and audits;
- ■Attitudes: reflexes and practices for the safety of all employees;
- ■Risk mitigation: prevention and detection of risks;
- ■Everyone’s engagement: the commitment of everyone, from operators to executives, and including all levels of management.
4.3.2.3.Workplace safety deployment
Training, awareness-raising and sharing
On site, several communication media (videos, messaging, presentations) remind all employees of the “Seven Fundamental Principles for Safety” on a daily basis. And in a systematic way, all meetings begin with an aspect of safety.
Lastly, an online platform enables the sharing of best safety practices, with nearly 850 practices recorded in 2022. On a monthly basis, site HSE representatives vote for their best practice. These actions promote exemplary behavior and enhance the commitment of employees in the process of the continuous improvement of safety and the reduction of environmental impacts.
In-plant audits and risk assessment
Each year, an internal team conducts FES audits to verify compliance with the “Seven Fundamental Principles for Safety” and assess the level of risk at all sites. In 2022, 98 FES audits were carried out.
In addition, the Group regularly launches actions to detect and prevent occupational safety risks in all its plants. Each “Autonomous Production Unit” aims to detect one risk per day. At the heart of the safety approach, employees participate directly in the daily identification of risks to better anticipate accidents. In 2022, more than 33,000 risks were detected and resolved each month on average across the Group.
Health and ergonomics
The main occupational illnesses reported throughout the Group are musculoskeletal disorders. In this context, Faurecia has been implementing measures for several years to better take into account and reduce the arduous nature of the workstations concerned, with each workstation being classified according to its level of arduousness.
- ■reduce the risk of accidents;
- ■enable operators to ensure quality and performance under the best possible conditions;
- ■make workstations accessible to as many employees as possible.
The ergonomics and industrial hygiene guide presents the essential rules for workstation design and aims to develop a culture of ergonomics within the Group.
Integrated into the FES tool, workstation ergonomics are systematically taken into account from the design stage of new products and production tools and checked on a daily basis and during production plant audits. These analyses, whose efficiency has been improved by the introduction of digital technology augmented by artificial intelligence, guide the implementation of workstation improvement solutions.
Employees at production sites and all operations and plant managers receive training in ergonomics. A compendium of best practices in terms of ergonomics is being drawn up.
Well-being at work and prevention of psychosocial risks
As part of its vigilance plan, FORVIA implements measures for well-being at work (see Section 4.3.4.4).
Right to disconnect: in France, Faurecia has taken specific measures to ensure that its employees have the right to disconnect. Indeed, the development of digital tools, levers of performance and responsiveness, can tend to blur the boundaries between private and professional life. Faurecia wishes to ensure respect for rest periods and holidays as well as personal and family life. All employees, including managers and professionals and Executive Management, have the right not to be contacted outside their normal working hours, whether by e-mail, messaging or telephone calls.
Psychological counseling service: as part of the psychosocial risk prevention plan, Faurecia has used an external service provider for the past ten years to provide its employees with a psychological counseling service. The specialist firm also conducts targeted training and interventions on the sites: support for employees, discussion groups, individual interviews, etc.
4.3.2.4.Workplace safety results for 2022
The change in the frequency rate of work-related accidents is analyzed in order to measure the effectiveness of actions carried out in this area. To guarantee the same level of workplace safety for all employees, temporary workers are included in the same manner as Faurecia employees in the following indicators.
Each accident is analyzed according to a problem-solving method: “Quick Response Continuous Improvement”. The analyses, based on best problem-solving practices, enable the implementation of preventive actions distributed to all sites.
- ■FR0t: measures the number of work-related accidents involving a Faurecia employee or temporary worker, with lost time, per million hours worked;
- ■FR1t: measures the number of work-related accidents involving a Faurecia employee or temporary worker, with or without lost time, per million hours worked;
- ■FR2t: number of first aid procedures performed following an incident per million hours worked.
Monitoring the FR2t enables Faurecia sites with few accidents, with or without lost time, to focus on prevention and the corresponding priorities.
First aid is monitored at all production plants. A problem-solving guide is provided to all production managers, which helps them to make progress in the appropriation of accident analyses and to increase their responsiveness.
In order to better identify priorities for action in terms of prevention, Faurecia also monitors an accident severity indicator. In 2022, it reached 36 days lost due to temporary disability per million hours worked, an increase of 13% compared to 2021.
Despite the actions launched through the CARE project, the FR0t accident rate increased by more than 15% while the FR1t accident rate remained stable between 2021 and 2022. This is linked to an increase in the number of accidents during the first half of 2022, caused by a relative loss of focus on the proper application of the Fundamental Principles of Safety by certain management teams, which were very mobilized by the preventive measures implemented during the Covid pandemic in 2020 and 2021. This observation led to the implementation of specific audits on the sites whose results deteriorated the most, and the positive effects appeared during the second half of 2022.
4.3.3.Product safety
4.3.3.1.Safety policy: zero-defect
Safety policy
The product safety approach is the result of the zero defect quality policy and is part of the Total Customer Satisfaction (TCS) strategy. It aims to:
- ensure the intrinsic safety of products and systems, thanks to their materials, their design, and the quality of their production processes with regard to criteria such as emissions of volatile organic compounds, mechanical resistance, etc.;
- design products ensuring the active and passive safety of drivers and passengers.
Faurecia is committed to ensuring that all its products are irreproachable in terms of quality and safety, which are essential criteria for customer satisfaction. Faurecia’s safety policy applies to its entire value chain: sourcing of components from suppliers, development, production, monitoring customer satisfaction and, where applicable, product recalls.
Faurecia also wants to play a leading role in safety in the automotive sector. In particular, the Group is committed to combating counterfeiting, a safety and health risk factor for consumers, and to continually improving product safety with regard to changes in mobility.
Safety regulations and criteria
The Group also ensures that its products comply with local regulations. These cover, depending on the country: mandatory equipment or qualifications, performance tests or impact tests. Regulatory compliance is validated, depending on local legislation, either by self-certification or by the certification of accreditation laboratories.
In some countries, voluntary commitment agreements, additional to the regulations, are signed at the national level between the countries and the automotive industry.
Faurecia is also committed to designing the safest products based on independent assessments conducted on the safety of drivers and passengers, in particular those conducted as part of the international New Car Assessment Programs (NPACs). The tests carried out relate to the avoidance of accidents and the consequences of the various types of impacts.
Finally, Faurecia is committed to implementing its quality and safety approach to meet the requirements and qualifications defined by the equipment manufacturers and which go beyond the regulatory framework. In 2022, Faurecia implemented mandatory quality and safety rules in its processes. 14 fundamental criteria including essential criteria, preventive criteria and continuous improvement criteria governing quality and safety. They are rolled out by process and are managed within the Faurecia Excellence System (see Section 4.2.4.2).
4.3.3.2.Product safety culture
The Total Customer Satisfaction Strategy
The Total Customer Satisfaction Strategy (TCS) enhances and affirms Faurecia’s competitive advantage in terms of quality and customer loyalty. Product safety occupies a central place in this strategy, which is deployed worldwide: quality agreements, shared vision in all regions, integration of local needs.
Customer satisfaction index
- ■performance (complaints): main indicator for customers based on the number of incidents.
- In 2022, 4,858 complaints were recorded corresponding to approximately 4 ppm (parts per million), an improvement of more than 14% compared to 2021 considering the increase in sales;
- ■NFPD perception (customer survey and 5-star score): indicator based on a survey sent to all of the Group’s customers, which includes a score from 0 to 5 stars, 0 being the lowest rating, 5 the highest.
- In 2022 was 4.7/5 vs. a target set at 4.5. In 2022, the various surveys received 2,076 responses, an increase of more than 20% compared to 2021.
Training and awareness
When they join Faurecia, all operators receive training in working standards, including product safety.
The Faurecia University Quality Academy, deployed at all Group sites, ensures that all employees are aware of and apply quality and safety rules. In 2022, Faurecia continued to enhance the quality academy offering. It now offers a catalog of multi-format training courses on quality and safety: face-to-face training, MOOCs and e-learning, quizzes and Q&As, etc. Faurecia has also displayed posters and banners at its sites reaffirming the essentials of quality and safety.
4.3.3.3.Safety management
Faurecia integrates end-user security into its processes throughout its value chain. Safety is thus integrated into the management tool for the organization of production and operations: the Faurecia Excellence System (FES) (see Section 4.2.4.2.). This includes the automotive industry quality and safety standards: IATF 16949 and ISO 9001.
Safety of components and materials
Safety is a key criterion in the choice of suppliers, components and materials. Faurecia shares its goal of zero defects with its suppliers through its Supplier Quality Requirements described in Section 1.3. For each part, Faurecia defines the qualifications of the components and materials with regard to safety. The Group relies on existing qualifications or supports the qualification of new materials. Faurecia then ensures the safety of the samples and audits the development processes at the suppliers’ sites to ensure the compliance of future parts. In the event of an incident, Faurecia carries out a root cause analysis at the supplier’s premises. The Group works in partnership with its suppliers and promotes support and the establishment of corrective plans in the event of non-conformities. Nevertheless, Faurecia may be required to dismiss a supplier that does not comply with its safety requirements.
Safety built into design
As the transformation of components and materials has an impact on the safety of the product and end-users, each part is subject to safety design rules. The teams define the safety qualifications of products and their implementation throughout the product design process. The safety criteria are thus translated operationally by tool, by procedure, by production line and by plant.
During the launch of any new product, Faurecia conducts a preventive analysis of failure modes and their effects (e.g. Design/Process Failure Mode and Effects Analysis, D/P FMEA). In a continuous improvement approach, this method analyzes the total safety of the product through the design and the process, from the project phase to the delivery of products. Faurecia completed the deployment of this method in 2022. The Group thus meets the requirements of its customers and has already seen the benefits.
The safety qualifications validated by Faurecia enable the Group to capitalize on its know-how to innovate quickly and safely.
Safety checks during production
Production includes the safety qualifications specifically intended for each part during the design phase. The production procedures thus include sections dedicated to safety.
Systematic control points punctuate production. Each operator checks the correct application of the safety criteria on his or her workstation, upon receipt and transmission of the product. Each team, at the start of its shift, checks the safety qualifications of products, procedures and workstations. Finally, product safety qualifications are checked at the end of the production line, before the product is released.
Faurecia also carries out regular checks and tests on the total compliance of products or complete systems with regard to safety. The Group pays particular attention to products that contribute to the active or passive safety of drivers and passengers.
Product cybersecurity
New regulations and standards such as UNECE R-155 and ISO/SAE 21434 require vehicles and their electronic control units to be secured against malicious attacks by hackers. In agreement with the automotive manufacturers, HELLA implements strict cybersecurity controls. Affected products include smart car access systems, electronic power steering units, radar sensors and battery management systems. These practices will be adopted by Clarion on a pilot basis, then by Faurecia.
Continuous improvement
Several levels of assessment and audit make it possible to assess the level of compliance of FORVIA sites in terms of quality and safety:
- ■self-assessments carried out by the plant quality teams, at least monthly, at the level of each plant and production line;
- ■standardized, annual internal audits for each site;
- ■external, annual audits carried out at all plants.
At-risk sites rate
Under the direction of the Faurecia group Risk Committee, the organization ensures strict compliance with the automotive quality standard IATF 16949.
Faurecia identifies potentially at-risk sites based on 16 criteria that assess site maturity, human resources management, number of programs managed, sales and customer satisfaction. Actions to mitigate risks are defined and monitored continuously.
- ■20 sites were potentially at risk out of a total of 250 (8% of the sites concerned) working on more than 760 ongoing programs.
Traceability
Faurecia ensures the traceability of each of its products and systems. The safety compliance of each part produced is traced digitally at each control point, with regard to the products and production procedures. Successive recordings, from the supplier to the customer, make it possible to associate each batch with production events, and each event with several batches. This cross-traceability of products and events enables Faurecia to analyze any problem with precision and anticipate recall campaigns, if necessary.
Alert and problem resolution system
The quality and safety alert system enables any employee to report a non-conformity. This generates a corrective action plan that may go as far as calling into question the specifications. In 2022, Faurecia reviewed and strengthened the alert procedure. A MOOC dedicated to the procedure was seen by all plant, management and operational teams.
Recognized methods of problem-solving and continuous improvement, stemming from the culture of lean manufacturing of Faurecia, are used for safety issues. Depending on the methods used, the various levels of the company concerned participate in the analysis of the problem, its root causes, corrective actions, associated management actions, etc.
4.3.3.4.Sharing of expertise on product safety
Blockchain
Beyond its own scope, Faurecia wishes to participate in developing the blockchain of the automotive sector. Faurecia relies on the European electronic compliance certificate requirement(6) and the desire to fight against fraud and counterfeiting to emphasize the importance of such sectoral traceability. Faurecia is already working with several suppliers and customers on a blockchain system. The Group presents this project to its partners as well as to sectoral bodies, such as the Federation of Vehicle Equipment Industries – FIEV, or European bodies.
In addition to product safety, the blockchain will measure the environmental and carbon impact of products throughout the value chain.
Research for safety tests
Faurecia contributes to safety assessment research. In particular, the Group is working to assess new types of dummies to further enhance the safety of vehicles and people. Faurecia uses innovative virtual dummies and human body models to identify and prevent specific types of injuries.
Air quality
Faurecia also participates in working groups on Vehicle Interior Air Quality at the United Nations, in collaboration with representatives of the manufacturers. The aim is to monitor the health of people on-board and improve the automotive industry’s knowledge in measurement methodologies and the impact of products present inside vehicles.
4.3.3.5.Innovation
Innovate through new active safety management systems
In order to create an ever smarter and safer driving environment, Faurecia is developing a range of detection technologies applicable to safety:
- ■hypovigilance control solutions (Driver Monitoring Systems), which monitor the driver’s alertness and state of vigilance;
- ■occupant detection systems in the passenger compartment (Occupant Monitoring Systems) capable of detecting improper positioning of occupants putting them at risk or of alerting to the presence of living beings remaining in the passenger compartment when the vehicle is locked;
- ■electronic rear-view mirrors, known as e-mirrors, reduce cognitive load and enhance driver safety and comfort while improving visual perception. This technology allows possible changes in the merging of the various sensors integrated into the vehicle and thus offers a global view of its environment.
In addition, Faurecia has a proactive approach to develop new technological applications for passenger safety and comfort through an ecosystem of open innovation and partnerships:
- ■Faurecia has formed a partnership with the German automotive supplier ZF to develop new active safety management systems, with a view to increasing vehicle automation. The connected seat cover Active Wellness Express™, for example, detects a state of fatigue or stress and applies countermeasures for greater safety, comfort and well-being at the wheel;
- ■Faurecia also collaborates with HumanFab, a partner with solid anatomical and physiological knowledge. The identification of specific fatigue markers linked to long journeys will make it possible to offer relief through comfort and well-being (seat massage, heating or cooling systems).
Anticipating the passive safety of autonomous vehicles
Autonomous driving will broaden the field of uses within the vehicle interior. As seats may no longer be fixed facing forward and upright, new solutions for seat-belts and air bags will be needed. Faurecia is working on adapting and developing safety systems that enable passengers to continue to travel in complete safety whatever the seat position, and whether driving to work or for pleasure.
4.3.4.Responsible value chain, including vigilance plan
FORVIA Value Chain
The responsible purchasing policy reflects Faurecia’s commitment to respect the Universal Declaration of Human Rights, the International Labor Organization (ILO) Declaration on Fundamental Principles and Rights at Work, the Rio Declaration on the environment and development, as well as the United Nations Convention against Corruption. This policy is deployed by the Group Purchasing department. It includes the four fundamentals of the ISO 26000 international procurement standard: environmental protection, respect for human and labor rights, ethical business conduct and sharing of best practices in the Group’s global supply chain. Since 2013, Faurecia has asked its suppliers to comply with its sustainable purchasing policy.
In support of its convictions and its Code of Ethics, Faurecia has developed a Code of Conduct for sourcing and the supply chain. This describes the Group’s expectations in its relations with its suppliers to promote responsible business practices from a social, environmental and economic point of view.
|
2019 Year of reference |
2021 |
2022 |
Target |
Faurecia |
Faurecia |
Faurecia |
FORVIA 2025 |
|
Share of direct purchasing volume assessed for CSR performance (representing around 2,000 direct suppliers) |
80% |
97% |
93% |
95% |
NFPD % of suppliers included in the panel assessed on sustainable development by EcoVadis |
80% |
86% |
77% |
95% |
NFPD Minimum EcoVadis score of the suppliers in the panel |
30/100 |
35/100 |
40/100 |
55/100 |
4.3.4.1.Assessment of subsidiaries, subcontractors and suppliers
Risk mapping and assessment
All Faurecia suppliers that are aligned with the Group’s convictions, and with which Faurecia has a long-term relationship, are subject to the supplier risk assessment process(7). These assessments are integrated into the purchasing process and systematically taken into account when contracts are awarded. They also feed into the supply chain risk mapping, which is then integrated into the Group risk mapping.
In 2022, Faurecia acquired a risk detection and alert tool for its suppliers. It takes into account supplier assessment criteria (below), and additional criteria such as risks of natural disaster and geopolitical risks. This alert system offers several functionalities: visualize supply chain risks, monitor incidents, track geographical risk exposure, personalize alerts, mitigate risks and access analyses and reports. It is also used to define action plans.
Supplier assessment
All Faurecia’s buyers use quantitative criteria to which they add a qualitative assessment based on their own experience or view of the supplier. All these criteria enable the buyers to build a detailed action plan.
- ■internal risk factors including risks to the financial health of our suppliers, risks related to their social responsibility, operational risks related to their performance as well as the risks of fire that may occur on their various sites;
- ■external risk factors, including risks of natural disasters, risks of political violence, political and social risks, social responsibility risks related to country of origin as well as risks related to changes in market prices.
Internal risk factors
- ■Financial assessment: the assessment, carried out by Standards & Poor’s and Dun & Bradstreet, is based on the financial performance of the company in question (via general screening or more in-depth ad hoc studies); an alert process is set up for any major financial risk event. In addition to the classic financial assessment, Faurecia has added a financial stress test process that allows the financial health of a supplier to be projected based on stress scenarios.
- ■Economic dependence assessment: the assessment of the level of mutual dependence with suppliers makes it possible to weight the level of the action plan to be implemented.
- ■Corporate Social Responsibility (CSR) assessment: in partnership with EcoVadis, Faurecia assesses:
- ethical business practices: assessment of the organization’s ability to implement tangible actions to ensure data protection, fight corruption, fraud, anti-competitive practices and money laundering and avoid conflicts of interest;
- working conditions: assessment of the organization’s level of maturity in terms of employee health and safety, working conditions, labor relations, forced labor and child labor, discrimination and the respect for fundamental rights;
- the environment and sustainable procurement: assessment of the formal policy, verification mechanisms and certifications obtained.
- In 2022, Faurecia increased the minimum score required by its suppliers by five points, and will continue to increase it until 2025 to reach the target of 55/100. In 2022, suppliers with a score of less than 40 were considered at-risk. In addition, since 2021, this minimum score is required for each of the three assessment pillars (and no longer on average). In 2022, 10% of the suppliers assessed were given a lower score and were subject to a corrective action plan. A figure that was up by 1% compared to 2021 (9%), mainly due to the increase in the required score.
- ■Operational risk assessment: assessment of suppliers’ operational performance.
- ■Fire risk assessment: in 2022, Faurecia developed a process for measuring the risk of fire in the most at-risk categories. This process will be tested during the first half of 2023 on a sample of suppliers. The deployment is planned for the second half of 2023.
External risk factors
An alert system is built into the risk analysis tool enabling buyers to be alerted in the event of risks that could impact the supply chain.
Suppliers Council
Since 2020 and the start of the Covid-19 health crisis, Faurecia has had a Suppliers Council. Twice a year, it brings together representatives of 12 suppliers to share strategy, discuss the challenges of the future, changing markets and trends, as well as the carbon reduction policy. In 2021, the Board met to discuss three priority topics in terms of sustainable development: Power Purchase Agreements (PPAs), best practices in energy management to achieve carbon neutrality and, finally, alternative materials. In 2022, the Board focused on best practices in energy management and control, and decided to maintain discussions on this priority subject for 2023 given the context of the energy crisis in Europe.
Supplier qualification and audit
SSupplier quality audits, which are a prerequisite to joining Faurecia’s panel of “direct” suppliers, include CSR issues. Suppliers with an EcoVadis score above 62 are audited every three years. The others are audited annually. EcoVadis supports Faurecia on the CSR aspects of these audits.
In addition to the partnership with EcoVadis, Faurecia ensures compliance with the REACH regulation, the regulation on “conflict minerals”, the level of fire protection and the level of risk related to natural disasters.
Procedure for minerals from conflict zones
Faurecia pays particular attention to the origin of the minerals used in its products. The Group ensures that the minerals used do not fuel any conflicts and do not come from supply chains that do not meet its ethical criteria. Gold, tin, tantalum and tungsten are considered “conflict minerals” because they play a role in certain guerrilla groups in sub-Saharan Africa. Mica is also included in the procedure due to the human rights risks existing in this supply chain.
The procedure for minerals from conflict zones is managed by the Purchasing department, which systematically checks the use of materials that may be conflict minerals in its products.
Thanks to an international declaration platform, Faurecia is able to identify all the products containing these minerals as well as the suppliers using them. Faurecia uses the questionnaire Conflict Mineral Reporting Template (CMRT) of the Responsible Minerals Initiative (RMI) for its annual supplier risk assessment campaign. The Group also ensures that suppliers use channels approved by the automotive manufacturers who are Faurecia customers. Otherwise, an action plan is requested from the supplier to change their supply source.
Responsible sourcing of leather
Faurecia takes care to use responsible sourcing, particularly for its leather-related activities for seating products. For this activity, the Group works with around ten direct suppliers imposed and assessed by the manufacturer. These suppliers market byproducts of the food chain and are assessed via EcoVadis.
4.3.4.2.Sustainable supplier management
- improve the monitoring accuracy and visibility of the environmental footprint of Faurecia’s purchases;
- engage the supplier network on a robust and ambitious decarbonization trajectory aligned with the Group’s objectives;
- extend the sustainable approach to environmental and societal issues, in particular human rights.
CSR assessment of suppliers
The comprehensive assessment of risks, including the CSR assessment, is part of the entry process for suppliers to Faurecia’s panel.
The qualification of a supplier depends on its level of risk. The award of new projects is subject to obtaining an analysis by EcoVadis.
A discussion is organized with at-risk suppliers, who must then present an action plan. Corrective action plans are monitored on a daily basis by buyers. Since 2021, they have also been reviewed monthly by the Commodities Director. If they are deemed insufficient, Faurecia may, as a last resort, delist a supplier.
Faurecia takes part in the precise management of substances and systematically participates in the collection of data from the automotive sector, the International Material Data System (IMDS). This shared database for archiving, exchanging and managing materials helps prevent unauthorized use and facilitates the recycling and reuse of end-of-life vehicles and their components.
Supplier satisfaction survey
To assess the level of satisfaction of the relationship between Faurecia and its suppliers, Faurecia conducts an annual satisfaction survey. The index is established on a scale of one to four and measures supplier satisfaction in five areas: strategy, innovation, operational excellence, business ethics and decarbonization. In 2021, the survey was conducted among 1,000 direct suppliers, representing 42% of the Group’s direct industrial purchasing volume. The level of satisfaction reached 2.95 on a scale of 1 to 4. The survey, which was scheduled for 2022, has been postponed to the first quarter of 2023, the priority of this end of the year having been given to the support of suppliers to manage the energy crisis in Europe.
4.3.4.3.Towards CO2 decarbonization in the supply chain
Suppliers with CO2 targets in line with those of Faurecia are essential to reduce its CO2 emissions by 45% for scope 3 (in absolute value) by 2030. Purchases represent 70% of controlled emissions in scope 3.
- ■supplier commitment to CO2 targets;
- ■CO2 impact assessment using a common IT platform;
- ■sharing of best practices and existing data on energy efficiency and CO2 emissions in the plants;
- ■shared action plan to reduce the total CO2 footprint.
In 2022, Faurecia presented its climate commitment and strategy as well as the resulting purchasing approach to its suppliers during a webinar.
Faurecia also continued to raise awareness among its suppliers on the need for a CO2 commitment supported by Executive Management, and a gradual increase of their EcoVadis score. In addition, the Group offered to make a financial contribution to 500 of its suppliers for their first participation in the CDP Supply Chain, an accelerator for climate issues. More than 170 responded positively to this invitation.
Lastly, in 2022 Faurecia collected the climate trajectories and sustainability roadmaps of its priority suppliers. Based on the CO2 neutrality strategies of 80 suppliers, and the sustainability initiatives of 100 suppliers, Faurecia compiled a sustainability and climate roadmap for its suppliers. This was shared with them in 2022 through webinars.
4.3.4.4.Vigilance plan
The policies of Faurecia and HELLA frame the Group’s commitments and approach in terms of human rights, health and safety, climate and the environment (see Sections 4.3.1.3., 4.3.2., 4.2.1. and 4.2.4.).
This vigilance plan meets the regulatory obligations relating to the duty of care of parent and customer companies. It contains reasonable vigilance measures intended to prevent the risks of serious violations of human rights and fundamental freedoms, health, safety and the environment at Faurecia and HELLA, as well as its suppliers and subcontractors.
Vigilance system
As part of a continuous improvement approach, the vigilance plan is based on the mapping and identification of risks, and their prevention and monitoring, including the alert system.
Vigilance governance
FORVIA’s commitment to human rights, fundamental freedoms, personal safety and the environment is supported at the highest level of the Group. The Executive Committee reviews the vigilance plan annually. Within the Executive Committee, the Committee in charge of sustainable transformation ensures quarterly monitoring.
The mapping of vigilance risks is included in the Group’s risk mapping (see 2. “Risk factors & Risk management”).
Mapping of vigilance risks
FORVIA has set up a cross-functional working group on vigilance issues, made up of the purchasing, health, safety, environment, human resources, climate strategy and sustainable transformation, and Legal departments. The vigilance risks were identified and assessed on the basis of interviews, documentary analyzes and consultations.
Vigilance risks
Regular assessments of the entities’ situation
With regard to risk mapping, Faurecia regularly assesses the situation of its subsidiaries, subcontractors and suppliers with which it has a commercial relationship. The Group has a shared risk management tool, and integrates risk management into the qualification of subcontractors and suppliers.
ENVIRONMENT: Biodiversity risk prevention and mitigation measures
In 2022, Faurecia joined Act4Nature and made concrete commitments for biodiversity, water, waste and the environment (see Section 4.2.5.2.).
health & safety: Measures for well-being at work
- Physical health
- It includes safety at work, a priority objective for all, monitored and managed by the HSE department and which is based on an adapted human organization.
- Mental health
- The Group relies on an alert system and health support in the field. The Group also conducts an annual performance review of all employees, and deploys its strong training capacity to manage the employability and work-life balance of its employees.
- Societal commitment within the Company
- Each year, the Group measures commitment through a survey sent to all employees, which aims to develop local action plans and listen to weak signals. Faurecia also offers a hybrid way of working for eligible employees. The FORVIA Foundation offers all employees the opportunity to take part in solidarity actions. Lastly, the Group encourages living well together by creating ties and conviviality in the life of the Company, and spaces for discussion.
To strengthen the scope of its action plan, the Group has developed several types of training within its in-house University, including:
- ■14 MOOCs directly related to well-being at work and mental health that were made available to 25,000 employees by LearningLAB;
- ■six Drive Energy sessions that were organized in person and in virtual sessions for six months in 2022. A total of 126 people took part;
- ■a three-month coaching program was launched in June 2022 in cooperation with CoachHub, a provider of virtual coaching services. 38 people out of the 42 invited have already taken part.
human rights: Measures to prevent and mitigate risks
Faurecia has set up a process for assessing its suppliers with its partner EcoVadis, aimed at preventing and mitigating risks related to discrimination, a living wage and employee representation.
- ■prioritizing countries potentially at risk in terms of respect for human rights;
- ■identifying suppliers located in these at-risk countries;
- ■defining the criteria for selecting potentially at-risk suppliers;
- ■carrying out CSR assessments for the sites of suppliers identified as being at-risk;
- ■carrying out corrective action plans with suppliers identified as being at-risk.
Whistle-blowing system
- ■the Supplier Code of Conduct;
- ■during annual performance reviews with suppliers;
- ■the Group’s annual satisfaction survey;
- ■conferences with suppliers;
- ■etc.
Employees are invited to contact their line manager, a human resources manager or a compliance manager.
4.3.5.Business performance indicators
|
Faurecia year of reference 2019 |
Faurecia 2021 |
Faurecia 2022 |
Faurecia 2021 vs. 2022 |
FORVIA 2022 |
Comments |
|
|
|
|
|
|
|
|
|
|
|
|
|
|
|
|
|
|
|
|
|
|
|
|
|
|
|
|
|
|
|
|
|
|
|
|
|
|
|
|
|
|
---|---|---|---|---|---|---|---|---|---|---|---|---|---|---|---|---|---|---|---|---|---|---|---|---|---|---|---|---|---|---|---|---|---|---|---|---|---|---|---|---|---|---|---|---|---|---|---|---|
Business ethics |
|
|
|
|
|
|
|
|
|
|
|
|
|
|
|
|
|
|
|
|
|
|
|
|
|
|
|
|
|
|
|
|
|
|
|
|
|
|
|
|
|
|
|
|
|
|
|
|
NFPD Percentage of targeted employees trained on the Code of Ethics |
93% |
95% |
96.7% |
+1.7 pt |
- |
Awareness-raising campaign reinforced |
|
|
|
|
|
|
|
|
|
|
|
|
|
|
|
|
|
|
|
|
|
|
|
|
|
|
|
|
|
|
|
|
|
|
|
|
|
|
|
|
|
|
Workplace safety |
|
|
|
|
|
|
|
|
|
|
|
|
|
|
|
|
|
|
|
|
|
|
|
|
|
|
|
|
|
|
|
|
|
|
|
|
|
|
|
|
|
|
|
|
|
|
|
|
NFPD Number of accidents resulting in lost time per million hours worked (FR0t) – employees and temporary workers |
0.8 (NB: excluding SAS) |
0.72 (NB: with SAS – excluding SAS = 0.64) |
0.82 |
+14% |
1.31 |
A deterioration in performance in the first half (end of Covid) and a clear improvement in the second half following the implementation of targeted audits on the sites with the worst performance |
|
|
|
|
|
|
|
|
|
|
|
|
|
|
|
|
|
|
|
|
|
|
|
|
|
|
|
|
|
|
|
|
|
|
|
|
|
|
|
|
|
|
NFPD Number of accidents resulting in lost time or not per million hours worked (FR1t) – employees and temporary workers |
2.05 (1) (NB: excluding SAS) |
1.49 (NB: with SAS – excluding SAS = 1.33) |
1.47 |
-1% |
2.08 |
A stabilization corresponding to a clear decrease in the number of accidents without lost time offset by the increase in accidents with lost time detailed above. |
|
|
|
|
|
|
|
|
|
|
|
|
|
|
|
|
|
|
|
|
|
|
|
|
|
|
|
|
|
|
|
|
|
|
|
|
|
|
|
|
|
|
Product safety |
|
|
|
|
|
|
|
|
|
|
|
|
|
|
|
|
|
|
|
|
|
|
|
|
|
|
|
|
|
|
|
|
|
|
|
|
|
|
|
|
|
|
|
|
|
|
|
|
NFPD Customer Satisfaction Index based on the “perception” score of the customer survey ✔ |
4.0/5 |
4.5/5 |
4.7/5 |
+4% |
- |
The number of customer responses increased by 20% in 2022. This program was the subject of a strengthened process of monitoring and detailed analysis of customer perceptions, followed by specific action plans to improve results. |
|
|
|
|
|
|
|
|
|
|
|
|
|
|
|
|
|
|
|
|
|
|
|
|
|
|
|
|
|
|
|
|
|
|
|
|
|
|
|
|
|
|
Responsible supply chain |
|
|
|
|
|
|
|
|
|
|
|
|
|
|
|
|
|
|
|
|
|
|
|
|
|
|
|
|
|
|
|
|
|
|
|
|
|
|
|
|
|
|
|
|
|
|
|
|
Share of direct purchasing volume assessed for CSR performance (representing around 2,000 direct suppliers) |
80% |
97% |
93% |
-4 pts |
|
|
|
|
|
|
|
|
|
|
|
|
|
|
|
|
|
|
|
|
|
|
|
|
|
|
|
|
|
|
|
|
|
|
|
|
|
|
|
|
|
|
|
|
NFPD Share of direct purchasing volume assessed for CSR performance (representing around 2,000 direct suppliers) |
80% |
86% |
77% |
-9 pts |
- |
In 2022, integration of the volume of suppliers for the FCE business in the target panel Impact of the change in the target panel during 2022 |
|
|
|
|
|
|
|
|
|
|
|
|
|
|
|
|
|
|
|
|
|
|
|
|
|
|
|
|
|
|
|
|
|
|
|
|
|
|
|
|
|
|
NFPD Minimum EcoVadis score of the panel suppliers |
30/100 |
35/100 |
40/100 |
+5 pts |
- |
|
|
|
|
|
|
|
|
|
|
|
|
|
|
|
|
|
|
|
|
|
|
|
|
|
|
|
|
|
|
|
|
|
|
|
|
|
|
|
|
|
|
|
[1] These data do not include SAS Automotive, which was acquired in 2020. |
|
|
|
|
|
|
4.4.People: creating a positive impact on the Company
The men and women of FORVIA represent an essential pillar of the Group’s success, which must be able to rely on the best teams around the world to maintain a competitive advantage, anticipate future trends, remain agile and invest in innovation.
- ■promoting diversity and inclusion (see Section 4.4.2): FORVIA is convinced that employee commitment and the promotion of diversity are major drivers of performance, representing considerable competitive advantages for the Group; technological progress and innovation through constantly changing working practices;
- ■developing the employability (see Section 4.4.3) of its employees throughout their professional lives through learning, mobility and vocational training. It is the best guarantee that employees and the Company can benefit from technological progress and innovation through constantly changing work practices;
- ■developing constructive social dialog for employees (see Section 4.4.4);
- ■attracting and developing talent (see Section 4.4.5);
- ■supporting employee engagement with local communities (see Section 4.4.7).
4.4.1.Workforce and employee commitment
4.4.1.1.Changes in headcount
A change in headcount marked by a recovery in activity:
The FORVIA Group has a total workforce of 157,460 people, including the HELLA workforce (43,647 people at the end of December 2022).
For Faurecia, the share of the total workforce increased by 2,673 people or 2.4% in 2022. The increase is due to the increase in the number of registered employees (+1,034 people) and the continuous adaptation of the temporary workforce (+1,639 people). The proportion of temporary employees was 20.3% (vs. 19.4% at the end of 2021).
Faurecia external hires
Over the past few years, Faurecia has grown significantly, with a headcount of 90,656 people, including 22,536 managers and professionals on open-ended contracts at the end of 2022.
In 2022, the Group recorded an increase of 3,626 open-ended and fixed-term contracts, i.e. 16.1% more than in 2021.
In a context of growing tension in labor markets, the teams of Faurecia’s Talent Hubs, particularly in Mexico, the US, India and China, have stepped up their activities to attract the best talent. 2022 was marked by the introduction of artificial intelligence into recruitment, with the use of matching, which significantly expands the identification of potential candidates aligned with the Group’s needs. This same technology also makes it possible to recruit young graduates and more experienced managers, through virtual recruitment campaigns, highlighting the Group’s new employer brand and new mission.
Faurecia received more than 30,000 résumés from young graduates during recruitment forums that were held in a number of countries (France, Mexico, India, etc.). Lastly, the presence on social networks continued to increase by 25% (with, for example, 90,000 additional subscribers on LinkedIn).
Faurecia registered employees
|
2021 |
2022 |
2022 vs. 2021 |
|
|
|
|
|
|
||||||||||||||||||
Hires on |
Hires on |
Total |
Hires on |
Hires on |
Total |
Hires on |
Hires on |
Total |
|
|
|
|
|
|
|
|
|
|
|
|
|
|
|
|
|
|
|
Faurecia |
12,403 |
10,057 |
22,460 |
13,153 |
12,933 |
26,086 |
+750 |
+2,876 |
+3,626 |
|
|
|
|
|
|
|
|
|
|
|
|
|
|
|
|
|
|
4.4.1.2.Employee commitments
Culture: Being Faurecia
“Being Faurecia” defines the Group’s culture and its management model, described and shared with all employees through:
- the Group’s values broken down into managerial values (entrepreneurship, autonomy, accountability) and behavioral values (respect, exemplarity, energy), enabling it to support the emergence of exemplary behavior within the organization;
- the Management Code for managers, explains the expected exemplary behavior. Training sessions are regularly organized for managers (see 4.4.5.2);
- organizational principles encourage decentralized decision-making processes in the different levels of the organization in order to strengthen the autonomy of the teams and facilitate decision-making.
Competent and autonomous teams
The Being Faurecia culture creates an environment that holds teams accountable for their performance through a horizontal organization of autonomous teams with appropriate skills and resources.
In this context, the management of jobs and skills by supporting all career paths and talent management, the implementation of a learning organization and team spirit are particularly essential to the success of the Company.
Measuring employee commitment
Faurecia conducts an annual satisfaction survey of all employees. This survey measures and collects feedback from employees on all aspects of their relationship with the Company.
- ■employee engagement which measures the level of motivation of employees in the performance of their work through job satisfaction; the recommendation of Faurecia as a responsible employer; pride in belonging and confidence in the strategy;
- ■the enablement of employees which measures the ability of employees to carry out their work through the understanding and commitment of employees to the Company’s strategy and culture, the quality of the relationship with the line manager, trust in general management, general perception of the Company, and well-being at work.
The other subjects addressed in the questionnaire relate to diversity, ethics and the whistle-blowing system, training and career development, compensation, health, safety, the environment, and the sustainable development strategy.
2022 results:
The response rate of employees to the 2022 survey reached a record level of 89%, and participation was consistent both within the Group’s entities and the countries. Employees in the managers and professionals category had the highest rating increase for 40% of the subjects addressed by the survey. The results for the rest of the salaried population were stable for 70% of the subjects addressed.
- ■The commitment index of Faurecia’s employees remained stable compared to 2021, with a result of 73% in 2022. This result is in line with the reference index for the goods and equipment industries (survey conducted among one million employees working in the sector). Faurecia is also well positioned compared to other international groups with a result of one point below the general industry benchmark (survey conducted among six million employees in the industrial sector);
- ■The index of enablement (ability of employees to perform their work) also remained stable compared to 2021, with a result of 74%, i.e. six points higher than the reference index of the goods and equipment industries and four points higher than the general industry benchmark.
The results are analyzed at Group, country and plant level. It enables each level to management of Faurecia to analyze and compare the results internally but also externally via benchmarks. On the basis of these results, the management draws up specific action plans to respond to the points raised by their teams. In Poland, for example, in 2022, it focused on the 2021 results around: pride in belonging and recommendation of the Company, training and career development, compensation and benefits, work-life balance. The sites have also set up commitment and motivation plans to encourage the organization of events around sustainable development, sport, health, diversity, etc.
The 2022 results reflect the measures taken by the Group to meet the needs expressed by employees during the 2021 survey, such as the increase in the budget allocated to salary expenses and the share of individual performance bonuses, and the setting up of a flexible working policy to improve work-life balance.
Remote work for employees
As an engineering and production company, most of Faurecia’s activity is carried out on-site, in engineering centers and production plants. The interactions are numerous and allow a great collective efficiency and a high level of innovation. The Covid-19 crisis revealed the effectiveness of remote working for some clearly identified activities, and also showed the importance that employees place on office interactions for socialization, team dynamics, and creative and informal discussions about work.
Since 2021, remote working has been offered as an effective and complementary tool for working in offices and sites. Eligible employees (i.e. 13,000 employees concerned) can work remotely for up to eight days per month – in agreement with their manager – depending on the needs related to their presence on this site with their teams. The objective is to develop a hybrid work culture, combining the efficiency of face-to-face work (innovation, creativity) and the flexibility of remote working, thanks to the opportunities offered by the digitization of tools (video meetings, shared work software, etc.).
- eligibility of employees according to their profession;
- a policy focused on managerial responsibility in implementation;
- an adapted digital tool to inform teams of on-site presence;
- a revised travel policy to optimize the frequency and duration of trips and make the best use of digital alternatives.
The roll-out of these guidelines was accompanied by numerous online training and communication tools with weekly reminders for people eligible for teleworking. The purpose of the training sessions is to share best practices in flexible efficiency, for example, they cover:
- ■the organization of work and the planning of face-to-face and remote activities, in particular thanks to a new matrix to help choose between face-to-face and distance learning;
- ■the choice of the most appropriate meeting format and the conduct of meetings adapted to the challenges;
- ■socialization with teams and customers who must be the subject of special attention in a context of increasing digitization.
4.4.2.Diversity & Inclusion
Diversity is one of Faurecia’s strengths and convictions. It is both a source of motivation for employees and a source of innovation. It has a positive impact on Faurecia’s performance and on the development of its employees. All of Faurecia’s actions aim to promote diversity as a real strength and an asset, to act for inclusion and to fight against all forms of discrimination.
Within the Human Resources team, the Vice President of Faurecia University and HR Transformation coordinates the deployment of the diversity and inclusion policy. They lead and coordinate initiatives and implement training and awareness-raising actions at Group level. They report to the Executive Vice President in charge of Human Resources.
Appointed “Champion” on diversity and inclusion topics, the senior Vice President in charge of Group Purchasing sponsors this program and coordinates the internal network of around 40 Diversity and Inclusion ambassadors around the world. Their role is to promote diversity in their scope of activity and in their country. With the support of local intermediaries, they coordinate and deploy actions for diversity and inclusion: training, awareness-raising on ordinary sexism, workshops on inclusion, sharing groups, etc.
Finally, the Code of Ethics and the Code of Ethics training MOOC are distributed to each new employee. Also available on the Faurecia website(8), the Code of Ethics specifies the Group’s commitment against discrimination of all types: age, gender, skin color, nationality, religion, state of health or disability, sexual orientation, and political and philosophical opinions or union membership. The Code of Ethics also includes the right to work in a healthy environment free from any form of hostility or harassment.
Training is a permanent and essential lever for accelerating cultural change. At Faurecia, diversity management is an integral part of training through a diversity and inclusion academy. Several training modules are aimed at managers to advance the inclusive culture in terms of unconscious biases, work on stereotypes or the effectiveness of a diverse team. In total, in 2022, more than 17,000 Faurecians received training in this area. In this context, and in order to ensure inclusive management that takes into account the challenges of gender diversity in team dynamics, more than 150 managers attended training sessions for the Management Committees.
Finally, to better recognize and promote internal best practices in diversity and inclusion, Faurecia also organized a second global digital event for employees: the Diversity and Inclusion Awards. More than 900 applications, from 25 countries, were received for 60 trophies awarded worldwide. The event, which was relayed on social media, generated more than 57,000 views.
4.4.2.1. Gender equality
FORVIA is particularly committed to gender equality. Since 2020, the Group has been a signatory of the Women Empowerment Principles (WEPs), an initiative established by the United Nations Global Compact and UN Women. HELLA signed up in 2022.
Faurecia has set itself the goal of boosting the recruitment and internal promotion of women in order to increase the presence of women among managers and professionals and the Top 300 leaders.
Targets for 2025, 2027 and 2030 (see table at the end of the section) have been put in place to ensure good progress, and are monitored by top management on a monthly basis. In particular, Faurecia’s objective for 2025 is 30% women among managers and professionals. This objective is also included in the long-term bonuses of the Top 300 of Faurecia leaders, which places the Group among the leading companies that have made this priority one of those of top management.
Hire talented women
Faurecia encourages the recruitment of talented women. The Group carries out actions to improve its attractiveness, particularly among female engineering students with the initiative “Women in technology”. In particular, Faurecia encourages its partner recruitment agencies on the issue of gender diversity. In 2021, the Group increased its target for the representation of women among the shortlisted candidates. From now on, two out of four profiles must be female (compared to one in three previously). Lastly, Faurecia launched a specific program to identify and recruit high-potential female executives to join the Top 300 leaders immediately or in the short term.
Faurecia in 2022
- ■35.4% of external hires of managers and skilled professionals were women, slightly down compared to 2021 (36.2%).
Attracting talent to the industrial sector
In 2022, the Group joined forces with the 11th edition of the Women in Industry Awards. The Group sponsored the “Production Women” category in order to promote women in industrial jobs and make these positions more attractive to other women. This initiative made it possible to highlight the Group’s women in various categories.
Promote talented women
Every quarter, Faurecia organizes specific reviews of female talent (“Female quarterly talent review”). The Group ensures that women have regular development opportunities and identifies female employees who are ready to advance. Candidates identified by their managers as ready for career move are systematically encouraged and promoted. In 2022, the internal promotion rate was 26%, down slightly compared to 2021. The aim is to align it with the growing presence of women at Faurecia, the principle of equal opportunity to which Faurecia is very committed.
Support female leadership: training, coaching, mentoring, exchanges
On its five campuses, Faurecia University offers two training programs to strengthen female leadership: “Female leadership program – young talent” and “Female leadership program – experimented one”. Delivered by diversity experts, these training courses are aimed at women who have the potential and the ambition to grow within the Group.
Faurecia is particularly attentive to the implementation of coaching and mentoring for female talent.
Faurecia supports a network of women, “Women at Faurecia”. Its purpose is to connect women with each other as soon as they arrive, to encourage exchanges, co-development and to guide them in their careers within the Group.
At the same time, throughout the year Faurecia hosts events and discussion sessions specifically targeting women.
- Local Let’s connect sessions: in addition to existing processes aimed at ensuring and accelerating the promotion of women within our organizations, local meeting sessions are systematically organized at site level. The aim is to connect women working on the same site (or in a neighboring region) as soon as they join Faurecia in order to facilitate exchanges and the sharing of experiences.
- The presentations of inspiring career paths for women Her Way: a digital event format that highlights inspiring women by inviting them to share their career paths and challenges, but also their successes.
- In Dialogue discussions: inspirational conversations in small committees between a role model leader and a group of around ten women in the Group.
Increase diversity within Faurecia’s governing bodies
Faurecia has set itself the target of reaching 24% women in the Top 300 leaders in 2025 (and 30% in 2030).
Several areas are being developed. The Vice President of Executive Development in the Human Resources department is in charge of this mission.
Internally, during annual talent reviews, “People Review”, the Group identifies women with such potential and provides individualized monitoring. An individual development plan is set up with mentoring and/or coaching and/or other specific actions.
The RISE program was put in place in 2022. It generates a virtuous circle for the internal promotion of women to the Top 300 leaders. This nine-month support program includes collective coaching sessions, co-development exercises and networking events. It is sponsored by four members of the Executive Committee, including the Chief Executive Officer. By developing female talent at the highest level, the Group is developing more inclusive management, allowing female potential to be developed in turn by these role models.
Then, the Female quarterly talent reviews make it possible to identify those ready for the next stage and to put them forward for positions to be filled.
Externally, we have launched a specific program with two partners to identify high-potential women in the market who can immediately or in the short term take up positions in management bodies. This reinforcement plan increases the possibility of appointing women to the Top 300 leaders.
Equal pay
Since 2016, Faurecia has analyzed pay equity between women and men in the Group’s main countries. The results do not show any major differences at the statistical level. Differences at the individual level are corrected on a case-by-case basis.
|
2019 Year of reference |
2021 |
2022 |
Target |
||
Faurecia |
Faurecia |
Faurecia |
FORVIA |
FORVIA 2027 |
FORVIA 2030 |
|
% of women hired among managers and professionals |
30% |
36.1% |
35.4% |
|
/ |
/ |
% of women among the Top 300 leaders |
15% |
21% |
23% |
|
25% |
30% |
% of women who are managers and professionals |
24.4% |
27% |
28.9% |
27.3% |
30% |
35% |
4.4.2.2.Diversity
Diversity of nationality
LOCAL EMPLOYMENT
Faurecia promotes local jobs for management positions in order to better understand specific cultural contexts and thus strengthen its performance. The Group also strives to have a positive impact on the economic development of the regions where it operates, by employing and developing local talent around the world.
Inclusion of young people
Faurecia has included its commitment to the professional integration and development of young people in its Code of Ethics(9). The Group promotes access by young people to various types of contracts, including apprenticeship contracts, and has a policy of hiring them early in their careers (see Section 4.4.5.1).
Faurecia in 2022
- ■more than 1,600 young people worldwide benefited from apprenticeship contracts in 2022.
Faurecia strives to give them access to the training necessary to carry out their activity and build their career path.
In 2022, Faurecia was awarded the Happy Index Trainees label in Europe, the Czech Republic, France, Mexico and Japan. This certification recognizes companies that take good care of the onboarding, support and management of their interns, work-study students and international volunteers (VIE).
Disability awareness
Faurecia launched an awareness-raising campaign on internal best practices, unconscious bias and possible blockages. In 2022, the Group also designed a library of ten online courses on this subject, the deployment of which will accelerate in 2023.
4.4.3.Learning organization
Faurecia is committed to supporting its employees in their learning and development. The Group ensures that employees acquire new skills through challenging positions (see Section 4.4.5.3). Faurecia also implements monitoring, coaching and training programs.
4.4.3.1.Training policy
Supporting the Group’s strategy
Training serves to implement Faurecia’s strategic orientations. It also supports changes in organizational methods and operating principles in force within the Group. Changes induced by the approach “Being Faurecia” are integrated into the Group’s training programs.
Among the priorities of the training plans, Faurecia has set itself the goal of improving the performance of plants, enhancing the appeal of its offerings to customers, increasing the technological expertise of products and processes, and strengthening the common culture and ethics, and combining the use of appropriate working methods.
Support the development and employability of employees
Training supports the development and employability of employees at all levels of responsibility. In conjunction with career management, it is a factor in terms of employee commitments.
Among the priorities of the training plans, Faurecia has set itself the goal of increasing the professionalization of employees, promoting their career development and strengthening their employability, and developing managerial skills in line with Faurecia’s managerial skills model (see Section 4.4.5.2), and developing the ability to work in a global context.
4.4.3.2.Training system
Faurecia’s training offer is intended for all employees. It is organized by major theme (leadership, finance, sales, HR, diversity, inclusion, etc.), then rolled out by targets with appropriate methods.
The formats are adapted to the pace and requirements of the business lines: action-training methods, internal training, use of adapted digital tools, workshops around the sharing of experience and expertise. In order to be accessible to all, numerous training courses are available in face-to-face and digital format.
- plant performance and optimal production start-up;
- offers to customers;
- technological expertise;
- managerial skills;
- value creation and enterprising spirit;
- working methods for excellence and creativity.
- understanding the challenges of hybrid work;
- the impact of the VUCA context (Volatile, Uncertain, Complex and Ambiguous) on business developments;
- energy management, to support managers and executives in their management of issues, in their effectiveness and the assessment of their priorities with the program drive energy.
Faurecia University
Faurecia University is present on five regional campuses: in Europe (Nanterre), in China (Shanghai), in North America (Auburn Hills and Puebla) and in India (Pune). 22,000 managers and professionals have access to Faurecia University’s programs and services. It aims to promote the development of managerial skills necessary for the Group’s transformation by:
- successful integration into the Group’s culture;
- acquisition of skills necessary for professional development in each function: sales, purchasing, human resources, HSE, etc.;
- strengthening their management skills and leadership;
- preparation for key positions: plant manager, program manager, engineering teams manager, etc.
It is enhanced by the constant presence of our managers or Executive Committee members who take part, speak to, or interact with participants.
This year, Faurecia University continued to roll out the program All on Board Connect. This learning community is dedicated to helping all Group employees better understand the major issues and engage in the Group’s transformation. Specific training and workshops have been developed to support the HELLA and Faurecia integration teams, who work together on a daily basis.
Since 2019, Faurecia University has been Corporate Learning Improvement Process (CLIP) accredited by the European Foundation for Management Development (EFMD). It is one of the 25 most mature corporate universities of major global groups (Siemens, Santander, Capgemini, Telecom Indonesia, Unicredit, etc.). These companies share joint ambitions and best industry practices. In particular, they are considered as a reference in terms of the strength of top management’s alignment with the role and mission of the Faurecia University, as well as the quality and speed with which the Faurecia University offer is being put online.
The Learning Lab
The Learning Lab is a digital learning platform. Its library has over 450 courses available in more than 33 languages. Accessible to as many people as possible, the platform is available on professional and personal computers or smartphones. Since this year, the platform is directly accessible on Teams, and has been opened to all HELLA managers and engineers.
The offer includes business and managerial training, as well as many discovery modules (digitization, artificial intelligence, etc.). Some knowledge is validated by internal certificates, on subjects such as communication, artificial intelligence, creativity, time management and sustainable development. It also offers training on the Group’s strategy and financial results.
In 2022, the Learning Lab had accumulated more than 1.7 million hours of training delivered (17 hours per person) since its launch at the end of 2015 and continued to increase its level of activity by 12% compared to 2021.
Training hours
The average number of training hours increased in 2022, from 22.6 in 2021 to 22.9 per Faurecia employee, an increase of 1.3%, due to the resumption of activity and a gradual return to face-to-face training in the second semester.
Face-to-face training was partially offset by the provision for all Group employees of the Learning Lab digital training platform. 364,035 hours of digital training were provided through MOOCs, representing nearly four hours per employee over the year.
In 2022, the average number of training hours per HELLA employee was 13.8. In total, 592,573 hours of training were completed by HELLA employees over the same year.
4.4.4.Social dialog
Social dialog plays a central role in the Group’s cultural transformation program, Being Faurecia. Considered as a real driver of operational efficiency and sustainable performance, the development of economic and social dialog is the subject of special attention.
Faurecia has included the development of economic and social dialog in its Code of Ethics(10), structured around a number of principles and policies such as:
- ■freedom of expression and social dialog;
- ■the right to and freedom of association (union membership);
- ■the promotion of an active policy of consultation and negotiation of collective agreements with employee representative bodies;
- ■anticipating, whenever possible, industrial and social redeployments in order to limit their impact.
Social dialog is also a privileged means of communication. Faurecia communicates regularly and in a structured manner to the various employee representative bodies on its achievements, its results and, more generally, its strategy. The Group promotes social dialog to discuss concrete achievements and best practices on safety and the improvement of working conditions. Whenever possible, Faurecia gives priority to finding and concluding agreements in the various projects where employee support is a guarantee of success.
Collective agreements
- ■working conditions;
- ■working hours, including the flexibility needed to manage fluctuations in activity related to the consequences of the semiconductor crisis and the war in Ukraine;
- ■salaries and other forms of compensation, employee profit-sharing and incentives;
- ■health and safety;
- ■the implementation of digital tools or processes.
Faurecia in 2022
- ■493 company or establishment agreements were signed in 23 countries;
- ■65% of the Company’s employees were covered by company agreements, establishment agreements and/or collective agreements of regional and/or national branches, slightly lower than in 2021 due to the absence of the renewal and/or signing of new agreements, particularly with regard to the improvement of health conditions related to Covid-19 in certain countries.
Industrial and social redeployments
In all the countries in which it operates, Faurecia is committed to reducing the impact on employment related to downturns in activity, in particular through negotiations on changes to the organization and working hours and implementation, where they exist, of measures intended to manage cyclical situations such as short-time working. At the same time, in any industrial redeployment operation undertaken to deal with situations of structural declines in activity, the Group favors the use of internal mobility, both geographical and functional, as well as voluntary departures. In the event that a site closure is required, the Group endeavors, where possible, to put in place re-industrialization projects by providing financial and/or operational assistance to industrial players that are likely to propose redeployment solutions to its employees. In cases where compulsory redundancies cannot be avoided, providing support for those employees seeking redeployment is a priority.
The European Works Council
The Faurecia European Works Council consists of 25 members broken down in proportion to the workforce of the different countries where FORVIA operates in Europe. In 2022, in accordance with the provisions of the agreement in force, three representatives of HELLA, from European countries where Faurecia was not present or had not reached the threshold to have a representative, joined the European Works Council until the end of the terms of the current members. As for every four years, in early 2023, the 25 seats will be distributed according to the number of registered employees in each of the countries where FORVIA operated at the end of December 2022.
This forum for dialog and discussion receives privileged information, in particular on the Group’s strategy, outlook, results, changes in the workforce, and social and industrial redeployments.
During 2022, as part of its usual activity, the European Works Council met digitally in plenary session once, while the Bureau met three times. it was possible to organize the Bureau meetings held in July and November face-to-face given the improvement in the health context.
In addition, an extraordinary meeting of the Bureau was also held in February 2022 on the HELLA integration process and the creation of the FORVIA banner to bring together Faurecia and HELLA.
Group Works Council France
The creation of the France Faurecia group Works Council in 2022 was the subject of an agreement signed unanimously by the trade unions. This new committee is a forum for information and discussion on Faurecia and HELLA group’s strategic orientations and activities in France. It consists of 17 members appointed by the national trade unions, according to their representativeness. Its first annual meeting was held in Paris in June, and focused on:
- ■the presentation of Faurecia’s results and annual financial statements as well as its outlook;
- ■the analysis of changes to the automotive sector;
- ■activity and outlook by entity;
- ■changes to headcount.
Information sharing with other countries
In the countries where the Group operates and within the framework of the main principles and policies, the various entities are autonomous in the implementation of an in-depth social dialog adapted to their realities and specificities.
In countries and/or regions that do not have central employee representative bodies, the Group Human Resources department coordinates the network of Human Resources Directors and country correspondents to discuss various topics and disseminate information on the Group’s strategy, results and outlook, as well as on cross-functional initiatives and/or common topics such as “Saving energy”.
Where there are central bodies such as the European Works Council or the France Group Works Council, the members also promote the sharing of information so that the greatest number of employees can discuss and thus contribute at their level to the development of social and economic dialog.
In 2022:
- ■✔ 63% of Faurecia employees were represented by at least one employee representative Body: European Works Council, France Group Works Council, Works or Establishment Council, Trade Unions, etc.
4.4.5.Talent management
4.4.5.1.Talent acquisition and retention
Early career hires
The recruitment management centers, called “talent hubs”, implement local recruitment programs for young graduates and early-career professionals. One of the key levers used by the Group to achieve its objectives of hiring young graduates is the international volunteer scheme in companies (VIE).
This year, Faurecia rolled out an Artificial Intelligence module in collaboration with a pioneering company in the field, which makes it possible to analyze candidates’ résumés in-depth to be able to offer them the most relevant job offers according to their profile. This new tool facilitates the right match between candidates and open positions, accelerates the identification of talent and quickly identifies specific and rare skills. It effectively enhances digital recruitment forums that manage very large volumes of candidates.
Faurecia in 2022
- ■More than 800 hires of international volunteers in companies (VIE) were carried out between 2021 and 2022.
- ■50% of international volunteers in companies (VIEs) at the end of their assignment were hired on fixed-term and open-ended contracts.
- ■28% of Faurecia managers and professionals hired were young graduates.
Recruitment of high potentials, particularly women
Faurecia has set up a recruitment program for high-potential profiles in France, Germany, the United States and China with the aim of preparing them, through an accelerated career plan, to become our future leaders. In addition, the Group carries out a specific recruitment plan aimed at detecting women who can join the Top 300 leaders immediately or in the medium term.
Onboarding new employees
All new hires follow a specific onboarding program called Welcome On Board to discover the Group, its values, its strategy, its organization and to familiarize themselves with the culture and its operational systems. It is an application integrated into Teams, which offers them personalized notifications every day, adapted to their needs. Faurecia received an award from Capital Humain at the end of 2022 for the joint deployment of artificial intelligence and the application Welcome on Board, thus recognizing the innovation and global deployment of the approach.
Some countries have held special events, such as orientation days, to expedite the integration of new hires.
4.4.5.2.Annual appraisals and skills development
Fair and evidence-based assessment of performance is an essential part of the “Being Faurecia” culture.
The managerial skills model
Aligned with Faurecia’s transformation strategy, the managerial skills model encourages the development of agile and inclusive leadership. It presents the essential skills that a leader must acquire according to their level of responsibility within the organization. It encourages everyone to develop their own leadership potential by providing illustrations of the different levels of ability, and ideas for key actions to be implemented to achieve this. It provides benchmarks for the self-assessment and assessment made by managers during annual performance appraisals. It serves as a reference for employees to build their individual development plan.
The annual performance appraisal of managers and professionals
Each year, the Group launches a campaign to assess the performance of managers and professionals. The annual appraisal, which takes place between a manager and his or her employee, aims to assess the achievement of individual objectives over the past year, and managerial skills and behavior in relation to Faurecia’s values.
The performance appraisal also makes it possible to define individual development plans. These enable everyone to define the development actions to be carried out over the coming year in order to develop the performance and potential of each employee.
It is also a key moment to discuss the coming year and jointly define the related individual objectives.
Anticipate and support jobs and career paths
Faurecia supports the needs of each manager and professional, with a particular focus on their expected potential over the coming years:
- twice a year, the Executive Committee reviews the Group’s high potentials with a particular focus on potential executive managers;
- the Group conducts an annual review of the teams (called “People reviews”) at all levels; sites, divisions, Business Groups, and Group. It makes it possible to identify potential, define succession plans for key positions and discuss career opportunities for the Group’s potential talents (see Section 4.4.5.3);
- reviews (known as “key reservoirs”) were organized in North America and Asia to develop promotion and internal mobility and optimize talent management at the local level;
- monthly reviews are carried out at Group and country level in order to promote the internal mobility of managers and professionals between the Group’s various entities;
- once a year, the Group’s succession plan is presented to members of the Board of Directors’ Governance, Nominations and Sustainable Development Committee, before being presented to the Board.
Faurecia is also particularly attentive to emerging skillsets: data, artificial intelligence, etc. The Group anticipates the deployment of these skills by developing ad hoc training offers (see Section 4.4.3) and identifying needs within the organization.
Coaching and mentoring
Faurecia offers its talents coaching and mentoring. The Group is particularly vigilant to ensure that these programs benefit female talent, in order to accelerate their careers (see Section 4.4.2.1).
4.4.5.3.Career opportunities
The Group’s internal promotion policy is to offer career opportunities to managers and professionals who are successful and demonstrate their potential. It is based on:
- ■annual talent and succession reviews;
- ■individual development plans;
- ■rigorous use of Faurecia’s managerial skills model;
- ■external assessments to best support potential and career choices.
Faurecia offers diverse career paths: inter-function or inter-division mobility, assignments to projects or short-term assignments, professional opportunities abroad or participation in international projects. The aim is to expose talents outside their comfort zone and enable them to develop their skills.
Lastly, Faurecia has a specific career management policy for its nearly 300 scientific and technical experts. The Group recognizes and particularly values their technical and technological expertise in order to strengthen business skills and the specificities of the products sold.
4.4.5.4.Talent retention
Development of leadership and career opportunities, but also training, coaching and mentoring help to retain talent.
In 2022, the resignation rate of Faurecia’s managers and professionals increased compared to 2021. The entire industry has shown an increase in the rate of resignations of talents, and Faurecia is at the same level as the market.
- ■actions to retain key skills;
- ■a plan to strengthen and attract talent;
- ■a robust skills development plan through the internal Faurecia University.
Resignation rate ✔ |
Faurecia 2019 |
Faurecia 2021 |
Faurecia 2022 |
Change 2022/2021 |
---|---|---|---|---|
Total |
8.9% |
11.0% |
12.6% |
+1.6 |
4.4.6.Compensation
The Group complies with the regulations in force in each country regarding minimum wages and compensation agreements.
In order to attract, retain and motivate talent, Faurecia’s compensation policy is determined in a way to ensure it is competitive with the internal compensation practices of the local market for each of the Group’s entities and complies with legal regulations. To this end, each year Faurecia examines market practices with firms specialized in compensation.
Compensation packages depend on several elements, including the level of responsibility exercised. Thus, the higher the level of responsibility, the greater the share of short-term and long-term variable components of total compensation.
Sustainable development criteria in variable compensation
Faurecia reviewed the nature of the quantifiable criteria for annual variable compensation, which until then had focused solely on financial items, in order to harmonize the structure for all eligible employees within Faurecia.
Given the strategic importance of a climate transition via the reduction of greenhouse gas emissions, and the response to the expectations of stakeholders in terms of non-financial objectives, the Group has included a quantifiable environmental criterion since 2022 in line with the Group’s carbon neutrality trajectory.
The criterion chosen is related to the reduction of CO2eq emissions (measured in tCO2eq for scopes 1 and 2) and energy consumption. This criterion, applied from 2022 for all eligible Faurecia employees, i.e. 4,800 managers & professionals, is a driver of motivation for the achievement of the objectives set by the Group.
- ■for the Chief Executive Officer:
- ■quantifiable criteria linked to the Group’s financial results representing 50% of the FVC target,
- ■a quantifiable criterion related to the reduction of CO2 emissions representing 15% of the FVC target,
- ■quantifiable criteria linked to synergies with HELLA representing 10% of the FVC target,
- ■qualitative criteria covering strategic, business development and managerial objectives and/or in line with the Group’s values representing 25% of the FVC target;
- ■for the other eligible members (members of the Faurecia Executive Committee, Faurecia’s Top 300 leaders and 4,800 managers and professionals), the structure has been harmonized as follows:
- ■quantifiable criteria linked to the financial results of the Group or the Business Group representing 50% of the FVC target,
- ■quantifiable criteria related to the reduction of CO2 consumption and energy savings for the Group and Business Groups representing 15% of the FVC target,
- ■qualitative criteria linked to the individual contribution to financial results representing 35% of the FVC target.
Change in compensation and benefits
In 2022
- ■For Faurecia, the total amount of compensation, social charges included, paid was €3,931.4 million
- ■For FORVIA, the total amount of compensation, social charges included, paid was €5,486.6 million
Grant of free shares subject to performance conditions
Faurecia has set up a free share allocation program subject to performance conditions. This is intended for members of the Faurecia Top 300 leaders with a view to creating motivation and loyalty.
For the Chief Executive Officer of Faurecia, the right to these shares is subject to a presence condition and to the following three performance conditions:
- ■an internal performance condition, linked to the Group’s net income after tax, representing 60%;
- ■a second internal performance condition linked to sustainable development, on the proportion of women among the Group’s managers and skilled professionals, representing 10%;
- ■an external performance condition, linked to the growth of Faurecia’s net earnings per share compared to that of a peer group consisting of 12 comparable global equipment manufacturers, representing 30%;
- ■for the other beneficiaries, a second non-financial objective has been added concerning the reduction of CO2 emissions compared to previous grants and the right to these shares is therefore subject to a presence condition and the following five performance conditions:
- ■an internal performance condition, linked to the Group’s operating income, representing 20%,
- ■a second internal performance condition, linked to the Group’s net cash flow, representing 25%,
- ■a third internal performance condition linked to sustainable development, on the proportion of women among the Group’s managers and professionals, representing 10%,
- ■a fourth internal performance condition linked to sustainable development, relating to the reduction of the Group’s CO2 emissions, representing 15%,
- ■an external performance condition linked to the growth of Faurecia’s net earnings per share compared to that of a peer group consisting of 12 comparable global equipment manufacturers, representing 30%.
4.4.7.Faurecia Foundation and corporate citizenship
- through employee projects or partnerships with associations financially supported by the Faurecia Foundation, which became the FORVIA Foundation in 2022;
- through the Foundation’s digital engagement platform, where each employee can take part in volunteer activities with local associations;
- at industrial site level, through collective solidarity actions organized by the sites themselves.
|
2019 |
2021 |
2022 |
Faurecia |
---|---|---|---|---|
Percentage of employees involved in local societal actions |
10% |
12% |
15% |
20% |
4.4.7.1.The FORVIA Foundation
Created in March 2020, the Faurecia Foundation became the FORVIA Foundation in 2022. It makes a positive contribution to society by supporting solidarity projects carried out by the Group’s employees to promote education, mobility and the environment. Thanks to the expertise and collective energy of its employees, the FORVIA Foundation supports projects and associations in the countries where the Group operates. At the end of 2022, it was estimated that more than 4,000 people in need had benefited from assistance through the Group’s solidarity projects.
Projects led by employees
With more than 150 projects submitted by employees around the world, the FORVIA Foundation’s 2021/2022 appeal for solidarity projects was a great success – mobilizing Faurecia employees for the third consecutive year, and those of HELLA for the first time.
Within the Foundation’s areas of intervention, 21 new projects were selected in 2022:
- ■five were existing projects, for which the Foundation renews its support;
- ■11 aim to ensure equal access to education;
- ■three aim to improve social inclusion through mobility;
- ■two aim to preserve the environment.
All these new 2022 initiatives were rolled out by the Group’s employees in partnership with non-profit organizations and were funded in the amount of €700,000 by the Foundation. They will benefit more than 2,000 people in 12 countries.
The FORVIA Foundation’s new 2022/2023 campaign to appeal for solidarity projects was launched for the employees at the end of 2022. At the end of January 2023, the sites have shortlisted promising projects, currently being selected by the FORVIA Foundation’s Board of Directors for a final selection in May/June 2023.
Societal action partnerships
In addition to inspiring projects led by the employees, the FORVIA Foundation has forged six partnerships with external players in order to strengthen its impact. In total, in 2022, funding of €415,000 was dedicated to these associations recognized for their societal action.
As the pandemic has caused significant disruptions in financial, social and emotional terms, the FORVIA Foundation decided to help hard-hit populations by creating a partnership in 2020 with the Fondation de France, which is the leading philanthropic network in France. For the past three years, the partnership has been evolving according to emerging needs:
- ■support for the French healthcare system in 2020: the Foundation committed alongside the Fondation de France by contributing to the “All United Against the Coronavirus” alliance to support healthcare workers, research and those working with the most vulnerable populations,
- ■support for French students in 2021: the FORVIA Foundation contributed to the emergency aid given by the Fondation de France to support French students disadvantaged by the crisis – food, basic necessities, psychological help and long-term educational support,
- ■support for vulnerable populations post-pandemic in 2022: this year, the partnership focused on post-pandemic issues, such as mental health support for young people and suicide prevention, daycare for children from families in difficulty in order to promote a return to employment, emergency shelters for women victims of violence and their children and, lastly, the financing of scholarships for young adults without family support.
The Simplon Foundation is a French organization whose mission is to accelerate the digital inclusion of vulnerable groups and support socio-professional integration into digital professions. Since 2021, the FORVIA Foundation has funded the program “Bac(k) on track”, an intensive learning program for people with few or no qualifications that prepares them before they resume their qualifying studies, as well as emergency scholarships for the most vulnerable students. The Foundation’s support benefited around 60 students in 2022.
Envie Autonomie is a French association that applies the principles of the circular economy to provide a solidarity-based offer of reusable medical equipment that has been reconditioned. This innovative approach makes it possible to reduce the environmental impact of the production of medical equipment, and to increase the financial accessibility of these technical aids for people in need while promoting the professional integration of people who are excluded from the employment market. Since 2021, the FORVIA Foundation has supported the launch of two new operating sites in France. In 2022, the FORVIA Foundation worked jointly with the Accenture Foundation to carry out a skills-based sponsorship enabling Envie Autonomie to structure its approach to the secondary market for spare parts and to benefit from FORVIA’s expertise in logistics management and assessment of the environmental footprint of its activities.
Mobile School is an international NGO whose mission is to provide an educational and social connection for street children. Since 2021, the FORVIA Foundation has provided financial support to four mobile schools that organize regular visits to disadvantaged neighborhoods in Mexico, Romania and Poland. These sessions, run by volunteers, help to create a local social and health link (education, prevention of drug-use and prostitution, etc.) with street children.
In 2022, the Foundation supported the opening of a new mobile school in Romania and Poland to help refugee children from the war in Ukraine. The Foundation also contributed to the translation of nearly 300 pieces of educational material into Ukrainian.
NOÉ is a French association that works for the protection of endangered species, the management of protected areas and the restoration of biodiversity and natural environments in France and abroad.
In 2022, the FORVIA Foundation supported the les prairies de NOÉ program dedicated to the protection of wild pollinators in France. With the help of NOÉ, the Foundation will develop, between 2023 and 2024, a project to restore wild pollinators on two FORVIA pilot sites in France and Germany. The project will focus on the rehabilitation of natural spaces, change in green space management practices, and employee awareness.
In 2022, the Foundation supported the Théâtre Nanterre-Amandiers located near the Group’s head office. As a national drama center, the mission of the Théâtre Nanterre-Amandiers is to support creations by young people that will be the theater of tomorrow. The Foundation contributes to the La Belle Troupe des Amandiers program, a two-year training course in acting for twelve young artists. During this training program, the apprentice actors perform their own creations across the Nanterre area and the Greater Paris region to reach the widest and most dispersed audience possible in order to make culture accessible to all.
FORVIA Foundation’s partnerships since 2020
Support of associations for diversity and inclusion
In 2022, the Faurecia Foundation also allocated €40,000 to support projects as part of the second internal Diversity and Inclusion Awards, which were aimed at all employees. The winning projects were able to make a special donation to a local association of their choice, working for the inclusion of vulnerable people. A total of five associations were chosen to receive an exceptional donation from the FORVIA Foundation in five countries where the Group operates.
In Poland, for example, the Cosmos Fondation (Fundacja Kosmos Dla Dziewczynek) benefited from a grant from the FORVIA Foundation. The association works to improve the conditions of young girls in Poland who face reductive stereotypes, educational barriers and a lack of self-confidence. The association carries out educational activities aimed at strengthening girls’ confidence in their own skills.
Exceptional support for the war in Ukraine
In March 2022, the FORVIA Foundation decided to provide exceptional support to populations affected by the war in Ukraine. It allocated €500,000 and launched an internal appeal for donations to support the solidarity initiatives led by more than 20,000 Group employees in neighboring countries (Poland, Romania, Hungary, Slovakia and the Czech Republic). This fundraising campaign raised €25,000 in donations from employees, which the Foundation matched donation for donation, adding an additional €25,000 to the “Ukraine emergency” budget. €300,000 was donated to the NGO Première Urgence Internationale for psychological support and the opening of an emergency logistics platform at the Polish border as well as the distribution of basic necessities directly inside Ukraine. €250,000 was donated for projects carried out by Group employees in partnership with several local NGOs in countries bordering Ukraine: Poland, Romania, Slovakia and the Czech Republic.
4.4.7.2.Commitment of local sites
FORVIA encourages solidarity initiatives at all its sites by facilitating the solidarity and local involvement of its employees, and by making its expertise available to the regions where the Group operates. Each site is invited to design its own local and annual societal action plan. Employees make a significant contribution to local communities through local solidarity actions, which can take the form of programs, events or fundraising campaigns.
FUELS initiative to fight hunger
For example, the “Faurecia Unites with Employees for Local Services” (FUELS) initiative was created in 2010 by Faurecia’s North American employees to fight hunger. It has gradually spread to a greater number of causes and countries. Among all the actions carried out in 2022, the teams in the United States, Mexico and Canada were encouraged to perform two hours of community service. More than 5,500 volunteers, employees, their friends and family members took part in this campaign. Together, they volunteered more than 16,000 hours cleaning parks and rivers or serving meals.
In the United Kingdom, teams raised nearly £5,000 for the charity Young Lives vs. Cancer. These amounts will support the care of families with children and young people suffering from cancer, and help to finance social workers.
Lastly, in China, more than 30 sites organized a “volunteer month” in November. Employees mobilized for fundraising, blood donation campaigns, and a solidarity walk ”Backpack-on-the-Go“ to donate 10,000 backpacks to children in need.
4.4.7.3.Solidarity engagement platform
To increase its societal impact and facilitate the commitment of employees in actions for the benefit of local communities, the FORVIA Foundation has rolled out its digital volunteering platform, the FORVIA Solidarity Hub. Throughout the year, this centralizes and promotes solidarity actions. The platform also offers employees volunteer assignments with non-profit associations on their personal time. This digital platform bridges the gap between the employees’ desire to act and the volunteer assignments offered by local associations. Launched in 2021 in the United States, Canada, Mexico and France, it was rolled out in 2022 to all sites where the Group operates.
In 2022, the platform recorded nearly 1,600 participations in solidarity actions worldwide and hosted several major initiatives such as:
- ■the FORVIA Foundation’s annual appeal for projects;
- ■the FUELS solidarity action campaign in North America, for which employees were able to register for the various missions offered on their respective sites;
- ■the campaign to appeal to employees for donations for the “Ukraine emergency”.
4.4.8.People performance indicators
|
News hires - |
Faurecia |
Comments 2022/2021 Faurecia |
FORVIA |
|
---|---|---|---|---|---|
2021 |
2022 |
2022 |
|||
|
Open-ended contract hires Fixed-term hires Total hires |
12,403 10,057 22,460
|
13,153 12,933 26,086
|
For all registered Faurecia group employees, the number of hires was up 16.1% compared to 2021, including a 6% increase for open-ended contracts and a 28.6% increase for hires on fixed-term contracts. The increase in the volume of hires on open-ended contracts follows the recovery in post-Covid activity (particularly in North America and Asia) and takes into account the increase in the number of resignations in 2022.
|
|
|
Resignation rate |
||||
|
Resignation rate of managers and professionals Resignation rate all employees |
11.0% 9.7%
|
12.6% 11.1%
|
Within the scope of the Faurecia group, resignations of employees on open-ended contracts represented 35.5% of departures in 2022 compared to 34.6% in 2021 (30% for operators, technicians, foremen & administrative staff, and 64% for managers). 61.5% of these resignations concerned operators & workers, 7.0% technicians, foremen & administrative staff, and 31.5% managers, an identical situation to 2021. For the latter category, the largest variations in both volume and as a percentage were in Europe (+30% vs. 2021), and Asia (+16% vs. 2021). |
|
Headcounts |
|||||
|
Registered employees Temporary employees Number of employees % of Faurecia employees % temporary employees |
89,622 21,518 111,140 80.6% 19.4%
|
90,656 23,157 113,813 79.7% 20.3%
|
Faurecia group’s total headcount increased by 2,673 people, or 2.4% in 2022. It increased by 1.8% in Europe (+825 employees), 2.4% in North America (+510 employees), 9.0% in South America (+437 employees) and 4.4% in Asia (+1,355 employees). In the rest of the world, a decrease of 454 employees, or 5%, was recorded, including a decline of 64% in Russia (-1,057 employees). Faurecia group’s registered headcount increased by 1.2% to 1,034 people in 2022. This increase was particularly noticeable in North America (+5.4% or 1,088 people), South America (+9.4% or 428 people) and Asia (+4.6% or 769 people). Europe saw a decrease of 2.9% or 1,174 employees. The proportion of temporary employees was 20.3% at the end of 2022 (vs. 19.4% at the end of 2021). |
129,028 28,432 157,460 81.9% 18.1%
|
|
|
|
|
|
|
|
Registered workforce by category |
|
|
|
|
|
Operators & workers Technicians, foremen & administrative staff Executives |
57,310 9,641 22,671
|
57,648 9,721 23,287
|
Faurecia group’s registered headcount increased by 1.2% in 2022, of which 0.6% for operators, 0.8% for technicians, foremen & administrative staff 2.7% for managers. For the latter category, the largest variations in volume were in North America (+11.1% or 472 employees vs. 2021), and Asia (+2.6% or 207 employees vs. 2021). |
75,215 14,193 39,620
|
Number of employees by type of contract |
|||||
|
Open-ended contracts (CDI) Fixed-term contracts (CDD) |
83,407 6,215
|
83,349 7,307
|
Faurecia group’s permanent headcount decreased by 0.1% or 58 people (-1,562 in Europe, +578 in North America, +346 in South America, +860 in Asia and -280 in the rest of the world). Over the same period, the number of employees on fixed-term contracts increased by 17.6%, or 1,092 employees. Open-ended contracts represented 91.9% of registered employees in 2022, compared to 93.1% in 2021. |
119,478 9,550
|
Age pyramid |
|||||
|
Men |
|
|
|
|
|
< 20 years 20-29 years 30-39 years 40-49 years > 50 years |
757 14,265 18,422 14,775 11,501 |
658 14,110 18,586 15,044 11,717 |
Women represented 33.7% of the Group’s registered headcount, an increase of 0.3 points compared to 2021. They represented 36.4% of operators & workers, 29.2% of technicians, foremen & administrative staff, and 28.9% of managers across the Group. Faurecia is a relatively young group with 56.3% of registered employees aged under 40 and 25.4% aged under 30. 16,499 registered employees, or 18.2%, are aged over 50, up 0.1 points compared to 2021. For all age brackets, the breakdown by staff category remained stable, with operators and workers accounting for 64% of registered employees, technicians, foremen & administrative staff representing 11%, and managers accounting for 25%. |
851 18,916 26,888 20,458 16,702 |
Total |
59,720 |
60,115 |
83,815 |
||
Women |
|
|
|
||
< 20 years 20-29 years 30-39 years 40-49 years > 50 years |
362 7,667 9,303 7,812 4,758 |
392 7,901 9,436 8,030 4,782 |
488 10,657 14,412 11,686 7,970 |
||
Total |
29,902 |
30,541 |
45,213 |
||
Registered |
|
|
Number of employees registered for the HELLA acquisition at end‐Dec. 22 |
||
|
Operators & workers Technicians, foremen & administrative staff Executives Open-ended contracts (CDI) Fixed-term contracts (CDD) |
-1,196 -285 -257 -1,583 -155
|
|
|
17,567 4,472 16,333 36,129 2,243
|
|
|
|
|
|
|
|
Departures by reason |
|
|
|
|
|
Resignations (open-ended contracts) Individual layoffs Group layoffs Other |
7,845 8,006 1,389 5,465 |
8,984 8,785 1,882 5,670 |
The number of employees who left Faurecia group totaled 25,321 in 2022, compared to 22,705 in 2021, an increase of 11.5%. 7.9% of them were at the end of fixed-term contracts versus 10% in 2021. Resignations of employees with open-ended contracts represented 35.5% of departures in 2022 compared to 34.6% in 2021, an increase of 14.2% for operators & workers, 7.6% for technicians, foremen & administrative staff, and 16.9% for managers. 61.5% of these resignations concerned operators & workers, 7.0% technicians, foremen & administrative staff, and 31.5% executives, an identical situation to 2021. The proportion of individual and group layoffs increased from 41.4% to 42.1% of total departures, mainly in North America, Asia and Russia. |
|
Total |
22,705 |
25,321 |
|
||
|
Disabled headcount |
|
|
|
|
|
Disabled headcount |
1,180
|
1,142
|
Faurecia group employs more than 1,100 people with disabilities, mainly in Europe. This figure was down by 3.2% compared to 2021. The notion of employees with disabilities is defined by legislation in each country, with more proactive legislation in Europe, and particularly in France and Germany, than in other countries |
|
Work organization |
|||||
|
Double shift Three shift Weekend (reduced weekend hours) Other |
31,008 20,828 394 37,392
|
27,503 21,833 270 41,050
|
The organization of work at Faurecia group aims to meet the needs of our customers taking into account the production capacity of our plants. The so-called shift working hours (1, 2 and 3), which mainly concern our production plants, represent 55% of our registered headcount. |
|
Absenteeism |
|||||
|
Sick leave Absence as a result of work-related accidents Miscellaneous unauthorized absences |
3,528,175 111,175 1,075,322 |
3,438,413 115,096 1,117,804 |
The number of hours of absence amounted to 4,671 million in 2022, down by 0.9% compared to 2021 for the Faurecia group. At the same time, hours worked increased by 1.2% from 158.7 million to 160.7 million over the period, the increase being linked to the recovery in activity compared to 2021. This resulted in a decrease in the absenteeism rate to 2.9% in 2022, down 0.1 points compared to 2021. |
|
Total |
4,714,672 |
4,671,313 |
|
||
Absenteeism rate |
3.0% |
2.9% |
|
||
|
|
|
|
|
|
Maternity/paternity/parental leave |
|
|
|
|
|
|
Maternity leave Paternity leave Parental leave |
1,769 1,525 1,179 |
1,679 1,596 1,203 |
Within the Faurecia group, the number of employees who benefited from maternity leave decreased by 5.1% in 2022, particularly in Central Europe and Asia. Those who benefited from paternity leave increased by 4.7%, mainly in North America. Parental leave increased by 2.0% (mainly in Asia). The conditions and the length of maternity, paternity and parental leave are governed by legislation in each country. |
|
|
Total |
4,473 |
4,478 |
|
|
Occupational illnesses by nature |
|
|
|
|
|
|
Musculoskeletal disorders of the arms Musculoskeletal back disorders Exposure to asbestos Deafness or hearing impairments Other |
199 20 - 2 32 |
184 34 - 1 40 |
0.3% of Faurecia group’s registered employees had an occupational illness in 2022. This ratio is identical to that of 2021. Musculoskeletal disorders of the arms accounted for more than 71% of the occupational illnesses recorded within the Group. The conditions for recognition of these different pathologies are governed by legislation in each country. |
|
Total |
253 |
259 |
|
||
Subcontracting |
|
|
|
||
|
One-off subcontracting projects Ongoing subcontracting |
1,455 3,519 |
1,464 4,052 |
Within Faurecia group, the call for subcontracting grew in 2022 in line with the resumption of activity in our production plants and greater use of security, cleaning and maintenance service providers in response to the health crisis. |
|
Total |
4,974 |
5,516 |
|
||
|
|
|
|
|
|
4.5.Report by one of the independent third-party organization on the verification of the consolidated non-financial statement included on a voluntary basis in the Group management report
This is a free translation into English of the independent third-party organization’s report issued in French and is provided solely for the convenience of English-speaking readers. This report should be read in conjunction with, and construed in accordance with, French law and professional standards applicable in France.
In our capacity as independent third-party organization, member of Mazars Group and accredited by COFRAC Inspection under number 3-1058 (scope of accreditation available on www.cofrac.fr), we have performed work to provide a reasoned opinion that expresses a limited level of assurance on the historical information (observed and extrapolated, hereinafter respectively the "Information") of the consolidated extra-financial performance statement, prepared in accordance with the entity’s procedures (hereinafter the “Guidelines”) for the financial year ended December 31, 2022, presented in the management report of the group (hereinafter the “Statement”), in application of the provisions of Article L. 310-1-1-1 of the Insurance Code which refers to Article L225-102-1 of the Commercial Code.
Conclusion
Based on the procedures we performed, as described in the "Nature and scope of our work” and the evidence we collected, nothing has come to our attention that causes us to believe that the consolidated non-financial statement is not presented in accordance with the applicable regulatory requirements and that the Information, taken as a whole, is not presented fairly in accordance with the Guidelines, in all material respects.
Preparation of the non-financial performance statement
The lack of a commonly used framework or established practice on which to base the assessment and evaluation of information allows for the use of alternative accepted methodologies that may affect comparability between entities and over time.
The Statement has been prepared in accordance with the entity’s procedures, the main elements of which are presented in the Statement and are available on request from the entity’s head office.
Restrictions due to the preparation of the Information
The Information may contain inherent uncertainty about the state of scientific or economic knowledge and the quality of external data used. Some of the Information is dependent on the methodological choices, assumptions and/or estimates made in preparing the information and presented in the Statement.
The entity’s responsibility
- ■selecting or setting appropriate criteria for the provision of the Information;
- ■preparing the Statement with reference to legal and regulatory requirements, including a presentation of the business model, a description of the principal non-financial risks, a presentation of the policies implemented considering those risks and the outcomes of said policies, including key performance indicators and also, the Information required by Article 8 of Regulation (EU) 2020/852 (EU Taxonomy);
- ■and implementing internal control procedures deemed necessary to preparation of information, free from material misstatement, whether due to fraud or error.
Responsibility of the Statutory Auditor
Based on our work, our responsibility is to provide a report expressing a limited assurance conclusion on:
- ■the compliance of the Statement with the requirements of article R. 225-105 of the French Commercial Code;
- ■the fairness of the Information provided in accordance with article R. 225-105 I, 3° and II of the French Commercial Code, i.e., the outcomes, including key performance indicators, and the measures implemented considering the principal risks (hereinafter the “Information”).
However, it is not our responsibility to comment on the entity’s compliance with other applicable legal and regulatory requirements, in particular the French duty of care law and anti-corruption and tax avoidance legislation nor on the compliance of products and services with the applicable regulations.
- ■the entity’s compliance with other applicable legal and regulatory requirements (in particular with regard to the Information required by Article 8 of Regulation (EU) 2020/852 (green taxonomy), the due diligence plan and the fight against corruption and tax evasion);
- ■the truthfulness of the Information provided for in Article 8 of Regulation (EU) 2020/852 (EU Taxonomy);
- ■the compliance of products and services with applicable regulations.
Regulatory provisions and applicable professional standards
The work described below was performed with reference to the provisions of articles A. 225-1 et seq. of the French Commercial Code, as well as with the professional guidance of the French Institute of Statutory Auditors (“CNCC”) applicable to such engagements and with ISAE 3000 (reviewed).
Independence and quality control
Our independence is defined by the requirements of article L. 822-11 of the French Commercial Code and the French Code of Ethics (Code de déontologie) of our profession. In addition, we have implemented a system of quality control including documented policies and procedures regarding compliance with applicable legal and regulatory requirements, the ethical requirements and French professional.
Means and resources
Our work was carried out by a team of 7 people between November 2022 and February 2023 and took a total of 6 weeks.
We conducted 30 interviews with the people responsible for preparing the Statement, representing the Sustainable Development, Human Resources, and Compliance and Health and Safety, Environment, Quality and Purchasing department.
Nature and scope of our work
We planned and performed our work considering the risks of significant misstatement of the Information.
We are convinced that the procedures we have carried out in the exercise of our professional judgment enable us to provide a limited assurance conclusion:
- ■we obtained an understanding of the consolidated entities’ activities and the description of the principal risks associated;
- ■we assessed the suitability of the criteria of the Guidelines with respect to their relevance, completeness, reliability, neutrality and understandability, with due consideration of industry best practices, where appropriate;
- ■we verified that the Statement includes each category of social and environmental information set out in article L. 225-102-1 III as well as information regarding compliance with human rights and anti-corruption and tax avoidance legislation;
- ■we verified that the Statement provides the Information required under article R. 225-105 II of the French Commercial Code, where relevant with respect to the principal risks, and includes, where applicable, an explanation for the absence of the Information required under article L. 225-102-1 III, paragraph 2 of the French Commercial Code;
- ■we verified that the Statement presents the business model and a description of principal risks associated with all the consolidated entities’ activities, including where relevant and proportionate, the risks associated with their business relationships, their products or services, as well as their policies, measures and the outcomes thereof, including key performance indicators associated to the principal risks;
- ■we referred to documentary sources and conducted interviews to:
- ■assess the process used to identify and confirm the principal risks as well as the consistency of the outcomes, including the key performance indicators used, with respect to the principal risks and the policies presented, and;
- ■corroborate the qualitative information (measures and outcomes) that we considered to be the most important presented in Appendix 1. Concerning certain risks such as social dialogue, business ethics, sustainable supply chain, product quality and safety, climate transition, for the others risks, our work was carried out on the consolidating entity and on a selection of entities;
- ■We verified that the Statement covers the scope of consolidation, i.e., all the consolidated entities in accordance with article L. 233-16 of the French Commercial Code within the limitations set out in the Statement;
- ■we obtained an understanding of internal control and risk management procedures the entity has put in place and assessed the data collection process to ensure the completeness and fairness of the Information;
- ■for the key performance indicators and other quantitative outcomes that we considered to be the most important presented in Appendix 1, we implemented:
- ■analytical procedures to verify the proper consolidation of the data collected and the consistency of any changes in those data;
- ■tests of details, using sampling techniques, in order to verify the proper application of the definitions and procedures and reconcile the data with the supporting documents. This work was carried out on a selection of contributing entities(11) and covers between 17% and 100% of the consolidated data relating to the key performance indicators and outcomes selected for these tests;
- ■we assessed the overall consistency of the Statement based on our knowledge of all the consolidated entities.
We are convinced that the work carried out, based on our professional judgement, is sufficient to provide a basis for our limited assurance conclusion; a higher level of assurance would have required us to carry out more extensive procedures.
Appendix: Information considered most important
Qualitative information (actions and results)
- ■Safety in the workplace
- ■Talents attraction and retention
- ■Social dialogue
- ■Employee commitments
- ■Business ethics
- ■Responsible supply chain
- ■Product quality and safety
- ■Environmental impact of sites and climate change
- ■Climate change
Quantitative indicators (including key performance indicators)
- ■Total number of employees recorded and split by contract
- ■FR0t (Accidents with lost time per millions of hours worked) by employees and temporary workers
- ■FR1t (Accidents without lost time per millions of hours worked) by employees and temporary workers
- ■Turnover rate of managers and professionals
- ■Employee Engagement Index
- ■Percentage of M&P having received training on the Code of Ethics
- ■Share of direct suppliers assessed for CSR performance
- ■Customer satisfaction index
- ■Part of ISO 14001-certified production plants
- ■Energy consumption (MWh)/€m of sales
- ■Tons of waste/€m of sales
- ■Tons of CO2 equivalent/€m of sales (scopes 1 and 2)
- ■Carbon footprint (scope 1, 2, 3)
4.6.Methodological note
FORVIA consolidates and discloses indicators according to the guidelines proposed by the Global Reporting Initiative (GRI).
The period covered by this Non-Financial Performance Declaration corresponds to 2021. The previous Non-Financial Performance Declaration was published in Faurecia’s Universal Registration Document and made available at https://www.faurecia.com/.
The social, environmental and societal information contained in this chapter meets the requirements of Article L. 225-102-1 and Articles R. 225-105 et seq. of the French Commercial Code, transposing Directive 2014/95/EU of the European Parliament and of the Council of October 22, 2014: the “Non-Financial Performance Declaration” (NFPD). Given the nature of the business of Faurecia, the following topics: food waste, fight against food insecurity, respect for animal well-being, responsible, fair and sustainable food does not do not constitute main CSR risks and do not justify a development in this management report
The scope, as well as the methodologies for calculating the social, environmental and societal indicators are described in Sections 4.2, 4.4 and 4.3 respectively. Changes made to previous data or adjustments are specified in each section.
4.6.1.Procedures for dialog and discussion with stakeholders
Stakeholders |
Information and communication |
Consultation and dialog |
Highlights of 2022 |
Key topics |
---|---|---|---|---|
Suppliers |
|
|
|
|
|
|
|
|
|
Customers |
|
|
|
|
Innovation partnerships |
|
|
|
|
|
|
|
|
|
Investors |
|
|
|
|
Local communities |
|
|
|
|
Employees |
|
|
|
|
Planet care |
|
|
|
|
4.6.2.Climate transition risks and opportunities
Risk factors |
Description |
|
Impacts and strategic responses to risks |
---|---|---|---|
Emerging regulations |
The automotive sector may be strongly affected by the tightening of emerging regulations on climate issues, particularly in the area of vehicle life cycle analysis. For example, regulations on the life cycle carbon footprint of vehicles would have a direct impact on the footprint of the parts and solutions provided by Faurecia. In addition, wider implementation of regulations aimed at reducing emissions of NOx in urban areas, reducing global CO2 emissions, etc., could lead to an increase in demand for zero-emission vehicles (therefore electric vehicles). |
|
To mitigate this risk, Faurecia is developing products for electric vehicles (batteries and fuel cells). The Group expects to spend between €80 and €100 million to develop solutions for electric vehicles over the next ten years. Faurecia has planned to invest €70 million in energy efficiency projects until 2023 in order to generate 15% energy savings as well as a reduction in the scope 1 and 2 CO2 footprint of more than 80%. |
Technology: substitution of existing products and services with lower emission solutions |
The majority (~70%) of Faurecia’s scope 3 footprint (controlled) consists of purchased goods and services, mainly steel and plastics. Faurecia’s strategic plans provide that low-carbon materials will be available and affordable, which means that Faurecia’s (B2B) customers and end customers will be willing to pay a CO2 premium. If the premium is not fully covered by our customers, or if the material is not available, the risk would be to miss commercial opportunities. |
|
Faurecia operates multiple moderate energy-intensive manufacturing processes, while its carbon footprint is mainly driven by its material purchases. Faurecia has initiated a CO2 neutral strategy to reach neutrality for scopes 1 & 2 by 2025, by reducing energy consumption and using renewable energy and to reduce by 45% its scope 3 controlled emissions by 2030. In this context, Faurecia entered into a partnership with Schneider Electric to conceptualize, manage and monitor the reduction and optimization of energy consumption. In addition, Faurecia manages the progress of materials purchased from its suppliers through tools for calculating and monitoring CO2 footprints. The Group has also set up an entity dedicated to the development of sustainable materials, (recycled, biosourced, from the circular economy), Materi’Act for the Group and other industries. Lastly, the Group is co-founder of the company GravitHy, which will produce very low-carbon steel from hydrogen (creation of a plant in France planned for 2027). |
Increase in extreme weather events |
Due to its international presence, some Faurecia sites are exposed to certain risks of extreme weather events (floods, cyclones, storms, etc.). |
|
For Faurecia’s facilities located near rivers or basins, extreme rainfall can lead to flooding and disrupt production in the short and long term. A disruption to a production plant can lead to customer delays or even loss of business. The prevention of natural risks is part of the Group’s overall industrial risk prevention policy, which aims to reduce accidents related to natural disasters in partnership with its insurer. Since 2014, Faurecia has systematically checked the exposure of its industrial projects to natural risks upstream of the project. This is one of the criteria for the selection matrix for new sites. The Group has also established a partnership with Predict Services in order to provide a 24/7 meteorological vigilance service to all its sites and a gradual alert system sent to site management by text message and email. These alerts are accompanied by recommendations to be implemented depending on the level of alert. In addition to these actions, at the end of 2022, the Group launched a study with AXA Climate in order to optimize and better anticipate the consequences of climate change at its production sites. This study is part of its climate change adaptation plan currently being drawn up. |
Climate change is also a source of opportunities, particularly through the development of new products and services. FORVIA is developing sustainable technologies that contribute to climate change mitigation and adaptation (see Section 4.2.6).
4.6.3.Specificities related to the environmental reporting and methodologies for calculating CO2 and volatile organic compound emissions
Faurecia consolidates and discloses indicators according to the guidelines proposed by the Global Reporting Initiative (GRI).
The period covered by this Non-Financial Performance Declaration corresponds to 2022. The previous Non-Financial Performance Declaration for 2021 was published in Faurecia’s Universal Registration Document made available at https://www.faurecia.com/ at the end of March 2022.
The social, environmental and societal information contained in this Chapter meets the requirements of Article L. 225-102-1 and Articles R. 225-105 et seq. of the French Commercial Code, transposing Directive 2014/95/EU of the European Parliament and of the Council of October 22, 2014: the “Non-Financial Performance Declaration” (NFPD). Social and societal information is published in the People and Business Sections.
4.6.3.1.Environmental reporting scope
The scope of this report covers 197 production plants (technological plants), 57 assembly sites (called “Just in Time” sites) and 22 R&D sites, a total of 276 sites. Compared to 2020, 35 new sites were included in the reporting scope and 15 sites were removed.
SAS, integrated within the Faurecia group in 2020 and included this year in the scope of reporting, is mainly involved in the assembly of cockpits. The integration of this Business Group accounts for 17 of the 33 new sites included in the report this year. See the list of sites subject to ICPE authorization (1).
The report covers the period from November 1, 2021 to October 31, 2022 to enable sites to collect, validate and publish data in a timely manner.
The Group’s sales figures correspond to the results generated during the environmental reporting period, i.e. from November 1, 2021 to October 31, 2022.
The reporting scope for GHG emissions covers more sites (450 sites in total for Faurecia, 132 sites for Hella on scope 1 and 2). The SAS, FCE and Hella acquisitions are included in the 2019, 2021 and 2022 carbon footprints, in line with the GHG Protocol.
Distribution of Forvia's production sites by continent (2022 Scope)
Distribution of Faurecia’s production sites by continent (2022 Scope)
Coverage rates* for environmental indicators
The environmental scope covers all active production, assembly and R&D sites, as well as head offices (HQ). Only sites that had started their activities since July 1 of the reporting period are included in the scope.
In view of their small environmental footprint, offices, sites with fewer than 20 employees, sites closed before September 1 of the reporting period, assembly sites located on customer premises and with fewer than 100 employees, and head office sites with a surface area of less than 10,000 m² are not included. *The coverage rate corresponds to the number of sites that have provided numerical data compared to the number of sites concerned by the subject.
List of sites of “installations classified for the protection of the environment” (ICPEs)
Name of institution |
Address 1 |
Address 2 |
Zip code |
Municipality |
Existing |
SEVESO |
Date of last inspection |
Inspection number |
---|---|---|---|---|---|---|---|---|
ADLER PELZER France West SAS formerly FAURECIA INTERIEURS MORNAC |
204 route du lac Melot |
ZE La Braconne |
16600 |
MORNAC |
Authorization |
Non Seveso |
|
7202370 |
FAURECIA |
17 rue de la Forge - BP 69 |
|
70200 |
MAGNY VERNOIS |
Authorization |
Seveso low threshold |
5/17/22 |
5901214 |
FAURECIA |
Route d'Orléans |
|
45190 |
BEAUGENCY |
Authorization |
Non Seveso |
|
10002262 |
FAURECIA AUTOMOTIVE COMPOSITES |
Le Petit Lojon - Départementale 2020 |
Route d'Orçay |
41300 |
THEILLAY |
Authorization |
Non Seveso |
7/22/22 |
10001788 |
FAURECIA AUTOMOTIVE INDUSTRIE |
BP 27 |
|
8210 |
MOUZON |
Authorization |
Non Seveso |
|
5701186 |
FAURECIA INDUSTRIE |
Parc d'Activité du Pommier |
|
62110 |
HENIN BEAUMONT |
Authorization |
Non Seveso |
1/22/21 |
7001731 |
FAURECIA Industries |
88 rue de Seloncourt |
|
25400 |
AUDINCOURT |
Authorization |
Non Seveso |
|
5900031 |
FAURECIA Industries SA - (CONT'D) |
PA de Ferchaud |
|
35320 |
CREVIN |
Authorization |
Non Seveso |
|
5501393 |
FAURECIA INTERIEUR INDUSTRIE |
Boulevard de Mailing |
Zone Industrielle |
62260 |
AUCHEL |
Authorization |
Non Seveso |
|
7001097 |
FAURECIA INTERIEUR INDUSTRIE |
11 rue du 12 mai 1967 |
|
60110 |
MERU |
Authorization |
Non Seveso |
10/18/22 |
5101321 |
FAURECIA Interior Industries - FR23 |
Les Landes de Tournebride |
|
35600 |
BAINS SUR OUST |
Authorization |
Non Seveso |
|
5501363 |
FAURECIA INTERIEURS SAINT-QUENTIN |
Parc des Autoroutes |
Rue André Missenard |
2100 |
ST QUENTIN |
Authorization |
Non Seveso |
|
5106395 |
FAURECIA JIT PLASTIQUE (formerly VISTEON) |
ZAC de la Touche Tizon |
|
35230 |
NOYAL CHATILLON SUR SEICHE |
Authorization |
Non Seveso |
9/15/21 |
5505118 |
FAURECIA SEATING FLERS |
ZI n° 3 - Rue Jean Monnet |
BP 89 |
59111 |
LIEU ST AMAND |
Authorization |
Non Seveso |
|
7002243 |
FAURECIA Siedoubs |
14 avenue d'Helvétie |
BP 91115 |
25201 |
MONTBELIARD |
Authorization |
Non Seveso |
|
5902114 |
FAURECIA SIEGES AUTOMOBILES SA |
17, Rue de la Métairie |
|
70200 |
LURE |
Authorization |
Non Seveso |
|
5901194 |
FAURECIA SIEGES D'AUTOMOBILE |
Rue de la Fonderie |
Usine de LA BUTTE AUX LOUPS |
61100 |
FLERS |
Authorization |
Non Seveso |
|
5302250 |
FAURECIA SIEGES D'AUTOMOBILE |
LE BOIS DE FLERS |
Usine du Bois de Flers |
61100 |
ST GEORGES DES GROSEILLERS |
Authorization |
Non Seveso |
|
5302595 |
FAURECIA SIEGES D'AUTOMOBILE |
1, Place de la Victoire |
|
54620 |
PIERREPONT |
Authorization |
Non Seveso |
5/30/17 |
6200519 |
FAURECIA Sièges d'Automobiles |
28, rue de Varennes |
BP 4 |
45290 |
NOGENT-SUR |
Authorization |
Non Seveso |
7/28/22 |
10000947 |
FAURECIA SIEGES D'AUTOMOBILE SA |
ZI |
|
88470 |
NOMPATELIZE |
Authorization |
Non Seveso |
10/27/16 |
6202363 |
FAURECIA - SIELEST |
ZA de la THUR |
|
68840 |
PULVERSHEIM |
Authorization |
Non Seveso |
4/26/22 |
6702334 |
FAURECIA Systèmes d’Echapmt (R&D Center) |
Bois sur Prés |
|
25550 |
BAVANS |
Authorization |
Non Seveso |
|
5900067 |
FAURECIA SYSTEMES D'ECHAPPEMENT |
Usine de Messei |
Rue de l'Industrie |
61440 |
MESSEI |
Authorization |
Non Seveso |
3/5/20 |
5302201 |
FAURECIA Systèmes d'Echappement |
25 route de Beaulieu |
BP 10070 |
25707 |
VALENTIGNEY |
Authorization |
Non Seveso |
6/20/17 |
5900645 |
FAURECIA Systèmes d'Echappement |
ZAC Technoland |
23 rue des Epasses |
25600 |
BROGNARD |
Authorization |
Non Seveso |
|
5904460 |
FAURECIA SYSTEMES D'INTERIEUR St Michel |
2 Parc d'activités |
|
88470 |
ST MICHEL SUR MEURTHE |
Authorization |
Non Seveso |
|
6202482 |
FLEX-N-GATE (AEE - FAURECIA) |
18 bis rue de Verdun |
BP 15178 |
25400 |
AUDINCOURT |
Authorization |
Non Seveso |
4/26/22 |
5902679 |
FLEX N GATE (formerly AUTOMOTIVE EXTERIORS EUROPE (FAURECIA) |
50, Rue de la Gare |
|
68520 |
BURNHAUPT LE HAUT |
Authorization |
Non Seveso |
9/13/22 |
6700609 |
NP VOSGES (formerly Faurecia Intérieur Systèmes) |
22 route de Moussey |
|
88210 |
LA PETITE RAON |
Authorization |
Non Seveso |
|
6202366 |
TRECIA (Faurecia Intérieur Systèmes) |
835 avenue Oehmichen |
BP 52 |
25461 |
ETUPES |
Authorization |
Non Seveso |
5/4/22 |
5900269 |
4.6.3.2.CO2 emissions calculation methodology
Scopes 1 and 2
Direct greenhouse gas emissions are calculated in CO2 equivalent. Emissions related to the consumption of scope 1 fuels are calculated based on emission factors taken from the French Environment and Energy Management Agency (ADEME) and the department for Environment, Food and Rural Affairs (DEFRA). In order to have a consistent approach, scope 1 emissions for 2019, 2020 and 2021 have been recalculated with these emission factors.
Fugitive emissions are calculated using emission factors from the sixth report of the Intergovernmental Panel on Climate Change (IPCC).
Indirect emissions related to electricity are calculated using the market-based approach, in line with the trajectory declaration to the SBTi. In order of data availability, the emission factor used on each site is that of market instruments (PPA, on-site or off-site renewable electricity production), electricity suppliers, and the country’s or the region’s residual mix and, finally, the national production mix with data from the latest IEA report.
For some of the sites (for Faurecia around 8% of the total number of sites considered during the period, representing around 1% of scope 1 and 2 emissions), energy and refrigerant consumption are estimated. These are generally sites with low energy consumption, or which have either recently opened or closed during the reporting period. To do this, for each energy vector, we use an average energy intensity (in MWh/m²) from similar sites (e.g. same type of site in the same country or region) that report actual consumption data. A conservative approach is used because only sites that consume said energy/refrigerant vector are taken into account in the average.
Emissions related to company cars are estimated, for Faurecia, on the basis of a report from one of Faurecia’s main long-term car rental agencies, the expenditure with this agency, and the total expenditure on company vehicles. For HELLA, fuel consumption is tracked in Germany using a fuel card. In other countries, emissions are estimated based on the number of vehicles.
Scope 3
The values are calculated according to the GHG protocol. They include all categories except downstream leasing and franchises which do not concern the Group’s activity. The uncertainties in the calculation of CO2 emissions were assessed taking into account the precision of the input data and the uncertainties in the emission factors.
Description of the methodology for the three most important scope 3 categories in terms of emissions:
Scope 3, category 1 on purchases of goods
Faurecia: Faurecia uses the Octoplus tool which directly calculates the emissions of each of its purchases based, in order of data availability, on the emissions or energy consumption declared by certain suppliers and approved (process emissions of Tier 1 suppliers) and a measurement of the weights per material multiplied by the related emission factors (for upstream emissions of Tier 1 suppliers); on an estimate of the process emissions of Tier 1 suppliers and a measurement of the weights per material multiplied by the related emission factors (for upstream emissions of Tier 1 suppliers); a multiplication of the expenditure in thousands of euros by an average monetary carbon intensity (in tCO2eq/€ k of expenditure) of similar purchases (same purchase segment or same sub-commodity) whose emissions have been estimated using the above methodologies; a multiplication of the expenditure in thousands of euros by a monetary CO2eq intensity taken from the ADEME carbon database.
HELLA: HELLA uses extracts from its purchasing data consolidation tool. For certain purchasing categories, the quantity data (in kg) are multiplied by an emission factor declared by the supplier or taken from a base of generic emission factors (ADEME Impact Base, for example) or an emission factor calculated from similar purchases at Faurecia, also expressed in kg. For the rest of the purchases, the expenditure data are multiplied by a monetary emission factor (in tCO2eq/€ k of expenditure) taken from Faurecia (weighted average of similar purchases) or from ADEME’s carbon database.
Scope 3, categories 4 and 9 on the transport of FORVIA goods
Faurecia: for some of the goods purchased and goods sold for which Faurecia pays for transport, we use a Transport Management System that allows us to track the distance (in km) and metric tons transported. Then, thanks to the TK’Blue tool, we use the carrier’s emission factor where it is available, or those of the Global Logistics Emissions Council (GLEC). For the rest of the goods purchased and goods sold for which Faurecia pays for transport, and which are not covered by the TMS, we estimate the t.km on the basis of the expenses by category of transport and a corresponding ratio in t.km/€ spent. We then use the relevant GLEC emission factors. For inbound/outbound transport for which transport is paid for by the supplier/customer, we estimate the associated emissions by extrapolating the GHG emissions from inbound/outbound transport paid by Faurecia, through the share (as a %) of expenses for goods purchased for which transportation is paid by the supplier.
HELLA: for the calculation of freight emissions of goods purchased and/or transported by HELLA, the reports of the main suppliers are used (top 4 suppliers representing approximately 50% of transport-related expenses). From these files, the calculations are carried out either from the emissions calculated directly by the suppliers, or by the distance and metric tons transported using an emission factor from the GLEC of the corresponding transport category. If these data are not available, emissions are estimated from the expenses associated with each shipment. Finally, an extrapolation is carried out for all expenses that are not covered by these reports (remaining 50%). The allocation of emissions between categories 3.4 and 3.9 (upstream and downstream transport) follows the same methodology as for Faurecia.
Scope 3, category 11 on the use of FORVIA products
Firstly, the majority of emissions from this item (in terms of final value) are due to the weight of Faurecia products in the final consumption of vehicles. Part of the vehicle’s GHG emissions during its usage phase is due to weight. Vehicle emissions (as reported by the equipment manufacturer) are broken down according to the weight of Faurecia products. The useful life of the vehicle considered for the calculation is 150,000 km. Upstream emissions are included in this assessment (combustion engine only), as well as a ratio that increases WLTP emissions to adapt them to driving in real conditions, based on a Deloitte study. Scope 2 emissions are also taken into account for electric vehicles, along with the IEA emission factors, assuming that the vehicle is used in the country where it was sold. The second type of emissions included in this category are emissions related to the electricity consumption of electronic components when in use. For these emissions, an estimate of the power and duration of use of the products is used for the calculations.
Changes in the reporting scope
As explained above, the reference year 2019, as well as 2020 and 2021, have been recalculated to remove FIS AST from the scope, in order to be consistent with the scope of 2022, according to the GHG protocol. To harmonize financial reporting and environmental reporting, only activities/products whose sales are recognized under IFRS 15 led to greenhouse gas emissions estimates.
Thus, the emissions linked to the chemical reactions that take place inside the catalytic converter, and which represent nearly 22 MtCO2eq in 2020 in relation to sales made by Faurecia according to estimates made internally, are not included in the CO2eq footprint of the Group. In fact, under IFRS 15, Faurecia acts as an agent in the supply of catalytic converter components, responsible for chemical reactions, to OEMs. OEMs choose the technical specifications of the part and the supplier.
Furthermore, Faurecia does not have the right to set the prices and conditions of sale of the part, nor is it responsible for the technical performance of the part. Finally, the Group has no inventory risk (by contract or de facto). In particular, in accordance with the GHG protocol, scope 3.11 – use of sold products – has been divided into two parts which cover the following:
- ■emissions linked to direct use of the products, corresponding to emissions linked to the electricity consumption of Faurecia products;
- ■emissions linked to indirect use of products, corresponding to a mass allocation of emissions from vehicles in the use phase, in proportion to the weight of the Faurecia products included in each vehicle.
Methodological improvements
As part of a continuous improvement process, Faurecia seeks to improve the quality of its estimates. With the support of Deloitte, several methodological improvements were made this year to refine the estimates, including the significant items of the CO2eq footprint:
- ■for scopes 1 and 2 by using a more detailed method to estimate the energy consumption of sites for which the consumption data are not reported; The IEA emission factor (national production mix) has been used for the electricity consumed by the Chinese sites to replace the regional emission factors, communicated by the Ministry of Ecology and the Environment (MEE) Chinese, used in previous years, they actually correspond to the marginal electricity mix. The years 2019 and 2021 have been recalculated for the Chinese sites using the IEA emission factor from last year. Also, following the decision to no longer take advantage of the environmental benefit, and in particular carbon, of the green contracts that certain sites have entered into with electricity suppliers, the residual mix or production mix emission factor was used for these sites (in 2019, 2021 and 2022) instead of 0 gCO2e/kWh;
- ■for category 3.1 (purchases), the Octoplus tool now includes FIS and covers a much higher share of purchases than last year (50% vs. 25%) with quantity emission factors, partly integrating supplier data. Furthermore, the remaining part not hedged by Octoplus was previously hedged with a commodity monetary emission factor (BG commodity unhedged expenses x BG commodity monetary emission factor, weighted average, in tCO2e/k€). This year, a monetary emission factor from the same product segment and country, or from the same segment, or from the sub-commodity, was used. Methodological improvements have also been implemented on FCE thanks to a more granular extract of the purchasing tool. For these reasons, the Group has recalculated the emissions in 2019 and 2021 from 2022. They were obtained by breaking down the expenses by Business Group and commodity over 2021, at sub-commodity and country level using the 2022 breakdown, then by multiplying this new more granular expenditure by the monetary emission factor of this same granularity in 2022. Thus the evolution of emissions between 2021 and 2022 is almost identical to the evolution of expenditure between these two years (the same for the evolution 2019 – 2022);
- ■for category 3.3 by the use of a more detailed methodology for upstream electricity, and in particular the use of emission factors specific to each renewable energy;
- ■for categories 3.4 and 3.9 (goods transport) by increasing the coverage of the Transport Management System TEO tool, making it possible to trace transport flows more precisely (more precise t.km). We have also changed the calculation methodology following the observation of inaccurate expenditure data in the TEO reporting for certain flows. Emissions for 2019, 2020 and 2021 were recalculated using this new methodology (described above);
- ■for scope 3.12, by using raw material volume data purchased (in kg) when the information was available and in this unit. These emissions were estimated by multiplying these volumes by the end-of-life waste treatment emission factors for each of the categories of materials purchased (in tCO2e/tonne of waste). When the weight information was not available, like last year, the methodology used is to estimate the weight of the raw materials from the related scope 3.1 emissions, then to multiply this volume by the emission factor treatment of this waste. The part corresponding to the emissions of 3.5 (internal waste) has been subtracted from the calculated emissions in order to avoid double counting. The years 2021 and 2019 have also been recalculated;
- ■all the calculations of the CO2 footprint and the identification of the associated uncertainties were prepared with the assistance of the firm Deloitte and audited by the firm Mazars.
4.6.3.3.Methodology for calculating Volatile Organic Compound (VOC) emissions
The annual reference emissions for Volatile Organic Compounds (VOCs) is calculated using the Solvent Management Plan (SMP) required by the European Council Directive 1999/13/EC of March 11, 1999 on the reduction of volatile organic compound emissions caused by the use of organic solvents in certain activities and facilities. The SMP is a mass balance for quantifying the inputs and outputs of solvents in an installation.
4.7.Cross-reference tables
4.7.1.Non-Financial Performance Declaration
The table below provides a summary of Faurecia’s main non-financial risks and opportunities, as well as the associated policies and indicators to meet the requirements of the NFPD. The Sections (4.2, 4.3 and 4.4) set out in detail the policies and results using indicators over the last three years. Chapter 2 on risk factors and risk management also sets out the non-financial risks integrated into the main risks used for the Group’s risk mapping.
|
Main risks and opportunities |
|
Approach and actions |
Indicators |
Information |
*Non-financial risks integrated into the Group’s main risks |
|
|
**Indicators integrated into the CSR roadmap Inspired to care |
SOCIAL |
Workplace safety |
*R |
|
|
SOCIAL |
Talent acquisition and retention |
*R |
|
|
SOCIAL |
Social dialog |
R |
|
|
SOCIAL |
Employee commitments |
O |
|
|
SOCIAL |
Diversity |
O |
|
|
SOCIAL |
Employability |
O |
|
|
SOCIAL |
Commitment to communities |
O |
|
|
SOCIETAL |
Business ethics |
*R |
|
|
SOCIETAL |
Sustainable supply chain |
*R |
|
|
SOCIETAL |
Product Quality and Safety |
*R |
|
|
ENVIRONMENTAL |
Environmental impact of production plants and climate transition |
*R |
|
|
ENVIRONMENTAL |
Climate transition |
*R |
|
|
ENVIRONMENTAL |
Innovation of products to improve air quality and reduce the CO2 footprint |
O |
|
|
It should be noted that some of these risks are related to the duty of care, for which Faurecia meets the regulatory requirements set out in law No. 2017-399 of March 27, 2017 relating to the duty of care of parent companies and instructing companies on the identification of risks and the prevention of serious violations of human rights and fundamental freedoms, human health and safety, and the environment.
4.7.2.GRI Content Index and Global Compact Principles
GRI standard |
Information element |
Chapter number |
Global Compact |
---|---|---|---|
General information |
|||
GRI 101: Foundation 2016 |
Reporting principles defining the content of the report |
4.1.1. Inspired to care: Faurecia’s sustainable transformation strategy 4.1.2. Social and environmental responsibility integrated into the Group strategy 4.1.3. Meet and respond to stakeholder expectations 4.6.1. Procedures for dialog and discussion with stakeholders |
|
Reporting principles defining the quality of the report |
4.4.8. People performance indicators 4.6.3. Specificities related to the environmental reporting and methodologies for calculating CO2 and volatile organic compound emissions |
|
|
Disclosures associated with the use of GRI standards |
4.7. Cross-reference tables |
|
|
Organization’s profile |
|
|
|
102-1 – Name of the organization |
6. Legal information |
|
|
102-2 – Activities, brands, products and services |
Introductory chapter |
|
|
102-3 – Location of the registered office |
6. Legal information |
|
|
102-4 – Location of the business sites |
Introductory chapter |
|
|
102-5 – Ownership and legal form |
6. Legal information |
|
|
102-6 – Markets served |
Introductory chapter |
|
|
GRI 102: General Disclosures 2016 |
102-7 – Scale of the organization |
Introductory chapter |
|
102-8 – Information on employees and other workers |
4.4.1. Workforce and employee commitment |
|
|
102-9 – Supply chain |
4.3.4. Responsible value chain, including vigilance plan |
|
|
102-10 – Significant changes to the organization and its supply chain |
1. Notes to the consolidated financial statements |
|
|
102-11 – Precautionary principle or preventive approach |
2. Contributors and systems |
Principle 7 |
|
102-12 – External initiatives |
4.1.3.1. International executives and external expertise |
|
|
102-13 – Membership of associations |
4.1.3.1. International executives and external expertise |
|
|
Strategy |
|
|
|
102-14 – Statement by the most senior decision-maker |
Introductory chapter |
|
|
Ethics and integrity |
|
|
|
102-16 – Values, principles, standards and rules of conduct |
Introductory chapter |
|
|
Governance |
|
|
|
102-18 – Governance structure |
Introductory chapter 4.1.2.2. Governance and management of the sustainable transformation |
|
|
102-19 – Delegation of authority |
4.1.2.2. Governance and management of the sustainable transformation |
|
|
102-20 – Executive-level responsibility for economic, environmental, and social topics. |
4.1.2.2. Governance and management of the sustainable transformation |
|
|
|
|
|
|
GRI 102: General Disclosures 2016 |
Stakeholder involvement |
|
|
102-40 – List of stakeholder groups |
4.6.1. Procedures for dialog and discussion with stakeholders |
Principle 3 |
|
102-41 – Collective bargaining agreements |
4.4.4. Social dialog |
||
102-42 – Identification and selection of stakeholders |
4.6.1. Procedures for dialog and discussion with stakeholders |
||
102-43 – Stakeholder engagement approach |
4.6.1. Procedures for dialog and discussion with stakeholders |
||
102-44 – Key topics and concerns raised |
4.6.1. Procedures for dialog and discussion with stakeholders |
||
Reporting practice |
|
|
|
102-45 – Entities included in the consolidated financial statements |
1. Subsidiaries and equity investments |
|
|
102-46 – Definition of report content and topic boundaries |
4.1.3. Meet and respond to stakeholder expectations |
|
|
102-47 – List of material topics |
4.7.1. Non-Financial Performance Declaration |
|
|
102-48 – Restatements of information |
4.7. Cross-reference tables |
|
|
102-49 – Changes in reporting |
4.7. Cross-reference tables |
|
|
102-50 – Reporting period |
4.7. Cross-reference tables |
|
|
102-51 – Date of the most recent report |
4.7. Cross-reference tables |
|
|
102-52 – Reporting cycle |
4.4.8. People performance indicators 4.6.3. Specificities related to the environmental reporting and methodologies for calculating CO2 and volatile organic compound emissions |
|
|
102-53 – Contact point for questions regarding the report |
6. Declaration by the person responsible for the Universal Registration Document and the information officer |
|
|
102-54 – Claims of reporting in accordance with the GRI Standards |
4.7.2. GRI Content Index and Global Compact Principles |
|
|
102-55 – GRI content index |
4.7.2. GRI Content Index and Global Compact Principles |
|
|
Material topics |
|||
Business ethics |
|
|
|
GRI 103: The management approach 2016 |
103-1 – Explanation of the material topic and its scope |
4.3.1. Business ethics |
Principle 10 |
103-2 – The management approach and its components |
4.3.1. Business ethics |
||
103-3 – Evaluation of the management approach |
4.3.1. Business ethics |
||
GRI 205: Anti-corruption 2016 |
205-2 – Communication and training about anti-corruption policies and procedures |
4.3.1.1. Ethics and compliance |
|
Environmental impact of production plants and climate change |
|||
GRI 103: The management approach 2016 |
103-1 – Explanation of the material topic and its scope |
4.2.4. Environmental policy |
Principles 8 |
103-2 – The management approach and its components |
4.2.4. Environmental policy |
||
103-3 – Evaluation of the management approach |
4.2.4. Environmental policy |
||
|
|
|
|
GRI 302: Energy |
302-1 – Energy consumption within the organization |
4.2.2.3. Renewable energy: long-term electricity purchase contracts |
Principles 8 |
302-3 – Energy intensity |
4.2.2.3. Renewable energy: long-term electricity purchase contracts |
||
302-4 – Reduction of energy consumption |
4.2.2.3. Renewable energy: long-term electricity purchase contracts |
||
Environmental impact of production plants and climate change |
|||
GRI 103: The management approach 2016 |
103-1 – Explanation of the material topic and its scope |
4.2.5.3. Production waste |
|
103-2 – The management approach and its components |
4.2.5.3. Production waste |
|
|
103-3 – Evaluation of the management approach |
4.2.5.3. Production waste |
|
|
GRI 303: Water and effluents 2018 |
303-1 – Interactions with water as a shared resource |
4.2.5.3. Production waste 4.2.5.4. Water resources |
Principle 8 |
303-2 – Management of impacts related to water discharge |
4.2.5.3. Production waste |
||
303-4 – Water discharge |
4.2.5.4. Water resources |
||
303-5 – Water consumption |
4.2.5.4. Water resources |
||
Environmental impact of production plants and climate change |
|||
GRI 103: The management approach 2016 |
103-1 – Explanation of the material topic and its scope |
4.2.1. Climate transition strategy 4.2.2.3. Renewable energy: long-term electricity purchase contracts |
Principles 8 |
103-2 – The management approach and its components |
4.2.1. Climate transition strategy 4.2.2.3. Renewable energy: long-term electricity purchase contracts |
||
103-3 – Evaluation of the management approach |
4.2.1. Climate transition strategy 4.2.2.3. Renewable energy: long-term electricity purchase contracts |
||
GRI 305: Emissions 2016 |
305-1 – Direct GHG emissions (scope 1) |
4.2.1.2. Greenhouse gas emissions 4.6.3. Specificities related to the environmental reporting and methodologies for calculating CO2 and volatile organic compound emissions |
|
305-2 – Indirect GHG emissions (scope 2) |
4.2.1.2. Greenhouse gas emissions 4.6.3. Specificities related to the environmental reporting and methodologies for calculating CO2 and volatile organic compound emissions |
||
305-3 – Other indirect GHG emissions (scope 3) |
4.2.1.2. Greenhouse gas emissions 4.6.3. Specificities related to the environmental reporting and methodologies for calculating CO2 and volatile organic compound emissions |
||
305-7 – Emissions of nitrogen oxides (NOX), sulfur oxides (SOX) and other significant atmospheric emissions |
4.6.3. Specificities related to the environmental reporting and methodologies for calculating CO2 and volatile organic compound emissions |
||
Environmental impact of production plants and climate change |
|||
GRI 103: The management approach 2016 |
103-1 – Explanation of the material topic and its scope |
4.2.5.3. Production waste |
|
103-2 – The management approach and its components |
4.2.5.3. Production waste |
|
|
103-3 – Evaluation of the management approach |
4.2.5.3. Production waste |
|
|
GRI 306: Effluents and waste 2016 |
306-2 – Management of significant impacts related to waste |
4.2.5.3. Production waste |
|
306-3 – Waste generated |
4.2.5.3. Production waste |
|
|
306-4 – Waste not intended for disposal |
4.2.5.3. Production waste |
|
|
|
|||
Responsible purchasing and duty of care |
|||
GRI 103: The management approach 2016 |
103-1 – Explanation of the material topic and its scope |
4.3.4. Responsible value chain, including vigilance plan |
|
103-2 – The management approach and its components |
4.3.4. Responsible value chain, including vigilance plan |
|
|
103-3 – Evaluation of the management approach |
4.3.4. Responsible value chain, including vigilance plan |
|
|
GRI 308: Supplier environmental assessment 2016 |
308-1 – New suppliers that were screened using environmental criteria |
4.3.4.1. Assessment of subsidiaries, subcontractors and suppliers |
|
308-2 – Negative environmental impacts in the supply chain and actions taken |
4.3.4.1. Assessment of subsidiaries, subcontractors and suppliers |
|
|
Talent acquisition and retention |
|||
GRI 103: The management approach 2016 |
103-1 – Explanation of the material topic and its scope |
4.4.5. Talent management |
Principle 6 |
103-2 – The management approach and its components |
4.4.5. Talent management |
||
103-3 – Evaluation of the management approach |
4.4.5. Talent management |
||
GRI 401: Employment 2016 |
401-1 – New employee hires and employee turnover |
4.4.5.1. Talent acquisition and retention 4.4.8. People performance indicators |
|
401-2 - Benefits provided to full-time employees that are not provided to temporary or part-time employees |
4.4.6. Compensation |
||
401-3 – Parental leave |
4.4.8. People performance indicators |
|
|
Workplace safety |
|||
GRI 103: The management approach 2016 |
103-1 – Explanation of the material topic and its scope |
4.3.2. Workplace safety |
|
103-2 – The management approach and its components |
4.3.2. Workplace safety |
|
|
103-3 – Evaluation of the management approach |
4.3.2. Workplace safety |
|
|
GRI 403: Occupational health and safety 2018 |
403-1 – Occupational health and safety management system |
4.3.2.1. Excellence approach: Faurecia Excellence System |
|
403-5 – Worker training on occupational health and safety |
4.3.2.3. Workplace safety deployment |
|
|
403-7 – Prevention and mitigation of occupational health and safety impacts directly linked by business relationships |
4.3.2. Workplace safety |
|
|
403-9 – Occupational accidents |
4.3.2. Workplace safety 4.3.2.4. Occupational safety results for 2022 4.4.8. People performance indicators |
|
|
403-10 – Occupational illnesses |
4.4.8. People performance indicators |
|
|
Employee engagement/Talent acquisition and retention |
|||
GRI 103: The management approach 2016 |
103-1 – Explanation of the material topic and its scope |
4.4.3.1. Training policy |
Principle 6 |
103-2 – The management approach and its components |
4.4.3.1. Training policy |
||
103-3 – Evaluation of the management approach |
4.4.3.1. Training policy |
||
|
|
|
|
GRI 404: Training and education 2016 |
404-1 – Average number of training hours per year per employee |
4.4.3.2. Training system 4.4.8. People performance indicators |
Principle 6 |
404-2 – Programs for upgrading employee skills and transition assistance programs |
4.4.3.2. Training system 4.4.5.2. Annual appraisals and skills development |
||
404-3 – Percentage of employees receiving regular performance and career development reviews |
4.4.5.2. Annual appraisals and skills development |
||
Promotion of diversity |
|||
GRI 103: The management approach 2016 |
103-1 – Explanation of the material topic and its scope |
4.4.2. Diversity & Inclusion |
Principle 6 |
103-2 – The management approach and its components |
4.4.2. Diversity & Inclusion |
||
103-3 – Evaluation of the management approach |
4.4.2. Diversity & Inclusion |
||
GRI 405: Diversity and equal opportunity 2016 |
405-1 – Diversity of governance bodies and employees |
4.4.2. Diversity & Inclusion 4.4.8. People performance indicators |
|
Social dialog |
|||
GRI 103: The management approach 2016 |
103-1 – Explanation of the material topic and its scope |
4.4.4. Social dialog 4.3.1.3. Respect for human rights 4.3.4.4. Vigilance plan |
Principle 3 |
103-2 – The management approach and its components |
4.4.4. Social dialog 4.3.1.3. Respect for human rights 4.3.4.4. Vigilance plan |
||
103-3 – Evaluation of the management approach |
4.4.4. Social dialog 4.3.1.3. Respect for human rights 4.3.4.4. Vigilance plan |
||
GRI 407: Freedom of association and collective bargaining 2016 |
407-1 – Operations and suppliers in which the right to freedom of association and collective bargaining may be at risk |
4.4.4. Social dialog 4.3.1.3. Respect for human rights 4.3.4.4. Vigilance plan |
|
Business ethics |
|||
GRI 103: The management approach 2016 |
103-1 – Explanation of the material topic and its scope |
4.3.1. Business ethics |
Principle 5 |
103-2 – The management approach and its components |
4.3.1.3. Respect for human rights |
||
103-3 – Evaluation of the management approach |
4.3.1.3. Respect for human rights |
||
GRI 408: Child labor 2016 |
408-1 – Operations and suppliers at significant risk for child labor |
4.3.1.3. Respect for human rights |
|
Business ethics |
|||
GRI 103: The management approach 2016 |
103-1 – Explanation of the material topic and its scope |
4.3.1. Business ethics |
Principle 4 |
103-2 – The management approach and its components |
4.3.1.3. Respect for human rights |
||
103-3 – Evaluation of the management approach |
4.3.1.3. Respect for human rights |
||
GRI 409: Forced or compulsory labor 2016 |
409-1 – Operations and suppliers at significant risk for forced or compulsory labor |
4.3.1.3. Respect for human rights |
|
Business ethics |
|||
GRI 103: The management approach 2016 |
103-1 – Explanation of the material topic and its scope |
4.3.1. Business ethics |
Principles 1 |
103-2 – The management approach and its components |
4.3.1.3. Respect for human rights |
||
103-3 – Evaluation of the management approach |
4.3.1.1. Ethics and compliance |
||
GRI 412: Human Rights Assessment 2016 |
412-2 – Employee training on human rights policies or procedures |
4.3.1.1. Ethics and compliance 4.3.1.3. Respect for human rights |
|
|
|||
Responsible purchasing and duty of care |
|||
GRI 103: The management approach 2016 |
103-1 – Explanation of the material topic and its scope |
4.3.4. Responsible value chain, including vigilance plan |
Principle 2 |
103-2 – The management approach and its components |
4.3.4.1. Assessment of subsidiaries, subcontractors and suppliers |
||
103-3 – Evaluation of the management approach |
4.3.4.2. Actions to mitigate risks or prevent serious breaches |
||
GRI 414: Supplier social assessment 2016 |
414-1 – New suppliers that were screened using social criteria |
4.3.4.1. Assessment of subsidiaries, subcontractors and suppliers |
|
414-2 – Negative social impacts in the supply chain and actions taken |
4.3.4.1. Assessment of subsidiaries, subcontractors and suppliers 4.3.4.2. Sustainable supplier management |
||
Product Quality and Safety |
|
|
|
GRI 103: The management approach 2016 |
103-1 – Explanation of the material topic and its scope |
4.3.3.1. Safety policy: zero-defect |
|
103-2 – The management approach and its components |
4.3.3.1. Safety policy: zero-defect |
|
|
103-3 – Evaluation of the management approach |
4.3.3.1. Safety policy: zero-defect |
|
|
GRI 416: Consumer Health and Safety 2016 |
416-1 – Assessment of the health and safety impacts of product and service categories |
4.3.3.3. Safety management At-risk sites rate |
|
4.7.3.Cross-reference table of the Women’s Empowerment Principles
Women’s Empowerment Principles |
Chapter number |
---|---|
Principle 1: Establish high-level corporate leadership for gender equality. |
4.4.2.1. Gender diversity |
Principle 2: Treat all women and men fairly at work – respect and support human rights and non-discrimination. |
4.4.2.1. Gender diversity 4.3.1.3. Respect for human rights 4.3.4.4. Vigilance plan |
Principle 3: Ensure the health, safety and well-being of all women and men employees. |
4.3.2. Safety in the workplace |
Principle 4: Promote education, training and professional development for women. |
4.4.2.1. Gender diversity |
Principle 5: Implement enterprise development, supply chain and marketing practices that empower women. |
4.4.2.1. Gender diversity |
Principle 6: Promote equality through community initiatives and advocacy. |
4.4.2.1. Gender diversity |
Principle 7: Measure and publicly report on progress to achieve gender equality. |
4.4.2.1. Gender diversity |
4.7.4.TCFD cross-reference table
Topics |
TCFD recommendation |
Chapter number |
---|---|---|
Governance |
a) Board of Directors’ approach to climate-related risks and opportunities. |
4.2.1.1. Climate trajectory 4.2.6.2. Climate transition risks and opportunities |
b) Description of management’s role in assessing and managing climate-related risks and opportunities. |
4.2.6.2. Climate transition risks and opportunities |
|
Strategy |
a) Description of climate-related risks and opportunities over the short, medium and long term (respectively one to three years, three to five years and five to ten years). |
4.2.6.2. Climate transition risks and opportunities |
b) Description of the impact of climate-related risks and opportunities on the business model, strategy and financial planning. |
4.2.6.2. Climate transition risks and opportunities |
|
c) Description of the resilience of the organization’s strategy, taking into consideration different climate-related scenarios, including a 2°C scenario. |
4.2.6.2. Climate transition risks and opportunities |
|
Risk management |
a) Description of the process for identifying climate-related risks. |
4.2.6.2. Climate transition risks and opportunities |
b) Description of the processes for managing these risks. |
4.2.6.2. Climate transition risks and opportunities |
|
c) Description of how these processes are integrated into a more global risk management strategy. |
4.2.6.2. Climate transition risks and opportunities |
|
Indicators and targets
|
a) Disclosure of the indicators used to assess climate-related risks and opportunities in line with the Company’s strategy and risk management. |
4.2.1. Climate transition strategy 4.2.7. Environmental performance indicators |
b) Disclosure of scopes 1 and 2 and, if appropriate, of scope 3 and related risks. |
4.2.1. Climate transition strategy 4.2.7. Environmental performance indicators |
|
c) Description of the objectives set by the Company to manage climate-related risks, opportunities and performance. |
4.2.1.1. Climate trajectory 4.2.6.2. Climate transition risks and opportunities |
|
|
|
|
4.7.5.SASB cross-reference table – indicators for the transportation sector, automotive spare parts
Sustainability Disclosure Topics & Accounting Metrics
Information |
Accounting metric |
Category |
Unity of measure |
SASB Code |
Chapter number |
---|---|---|---|---|---|
Energy Management |
(1) Total energy consumed (2) Percentage of electricity from the grid (3) Percentage of renewable energy |
Quantitative |
Gigajoules (GJ), Percentage (%) |
TR-AP-130a.1 |
4.2.2.3. Renewable energy: long-term electricity purchase contracts 4.2.7. Environmental performance indicators |
Waste Management |
(1) Total amount of waste from production (2) Percentage of hazardous waste (3) Percentage of waste recycled |
Quantitative |
Metric tons (t), Percentage (%) |
TR-AP-150a.1 |
4.2.5.3. Production waste 4.6.3.1. Environmental reporting scope 4.2.7. Environmental performance indicators |
Product Safety |
Number of recalls issued, total units recalled |
Quantitative |
Number |
TR-AP-250a.1 |
4.3.3.1. Safety policy: zero defect |
Design for Fuel Efficiency |
Sales from products designed to increase fuel efficiency and/or reduce emissions |
Quantitative |
Reporting currency |
TR-AP-410a.1 |
Introductory chapter |
Material Sourcing |
Description of the management of risks associated with the use of critical materials |
Discussion and Analysis |
n/a |
TR-AP-440a.1 |
4.3.4.1. Assessment of subsidiaries, subcontractors and suppliers 4.2.3.1. Sustainable Materials |
Materials efficiency |
Percentage of products sold that are recyclable |
Quantitative |
Percentage (%) |
TR-AP-440b.1 |
4.2.3.1. Sustainable Materials |
Materials efficiency |
Percentage of input materials from recycled or remanufactured content |
Quantitative |
Percentage (%) |
TR-AP-440b.2 |
|
Competitive behavior |
Total amount of monetary losses as a result of legal proceedings associated with anticompetitive behavior regulations |
Quantitative |
Reporting currency |
TR-AP-520a-1 |
2.4.2. Contingent liabilities |
Activity Metrics |
|
|
|
|
|
Number of parts produced |
Quantitative |
Number |
TR-AP-000.A |
Introductory chapter |
|
Area of manufacturing plants |
Quantitative |
Square meters (m²) |
TR-AP-000.C |
Introductory chapter |
|
|
|
|
|
|
|
4.8 Information relating to the allocation of funds raised through Green Bonds issued by Faurecia
In 2021, the Group has issued one Green Bond for €400 million (XS2312733871) in order to support its development in the hydrogen mobility solutions.
A detailed description of these investments can be found in the Faurecia Green Bond Framework of March 2021 available on the Investor pages of the Company’s website:
www.faurecia.com/sites/groupe/files/investisseurs/Faurecia_Green_Bond_framework_MAR_2021.pdf?mwg_rnd=5222387
This section provides a summary of these commitments and how Faurecia has fulfilled them as at the end of 2022.
Use of proceeds
Faurecia has committed itself to allocate the proceeds from its Green Bond to finance new investments in Hydrogen projects. Projects eligible for Green Bond financing as per the Green Bond Framework (the “Eligible Projects”) are:
- ■development and production of hydrogen fuel cell systems (stacks) for light vehicles, commercial and utility vehicles and other applications:
- ■mainly through Symbio, our JV with Michelin;
- ■development and production of hydrogen storage systems aims at developing:
- ■high pressure hydrogen storage tanks and ancillary devices,
- ■new industrial processes to accelerate production,
- ■innovative materials and smart tanks with embedded IoT sensors, increasing the safety, durability and recyclability.
The Green Bond Framework provides that the funds may finance projects which would not have benefited from financing through a Green Bond within 3 years before the issue of the Green Bond (look-back clause). Similarly, the funds can be used to acquire a direct hydrogen related mobility activity or technology.
Reporting
Effective use of proceeds
As at December 31, 2022, the funds raised in April 2021 in the amount of €400 million under the first Green Bond issued by Faurecia have been allocated for €376.8, million or a 94.2% allocation.
The remaining 23.2 million euros were held in cash and cash equivalents, pending their allocation to eligible projects.
Pending full allocation, unallocated proceeds may temporarily be invested in accordance with Faurecia’s investment guidelines in cash, deposits and money market instruments, at its own discretion
The Faurecia hydrogen tank activity legal entity is part of the Faurecia SE cash pooling and received automatically the proceed of the Green Bond via cash pooling.
Symbio received regularly funds from Faurecia as a shareholder to finance the Capex and R&D as described above.
Limited Assurance Report from one of the Statutory Auditors on a selection of information published in the Universal Registration Document for the green bonds issue
This is a free translation into English of the Limited Assurance Report from one of the Statutory Auditors issued in French and it is provided solely for the convenience of English-speaking users. This report should be read in conjunction with, and construed in accordance with, French law and professional auditing standards applicable in France.
In our capacity as Statutory Auditor of FORVIA (hereinafter the “Company”), and in accordance with your request, we have undertaken a limited assurance engagement on a selection of information as of December 31, 2022 (hereinafter the “Information”), presented in the Company's Universal Registration Document (Section 4.3) and prepared in accordance with the Green Bond Framework (hereinafter the “Framework”), attached to this report and as set forth in the Second Party Opinion issued by the non-financial rating agency ISS ESG.
Our assurance does not extend to information in respect of earlier and later periods or to any other information, notably the qualitative information included in FORVIA’s Non-Financial Statement.
Conclusion
Based on the procedures we have performed as described under the section “Summary of the work we performed” and the evidence we have obtained, nothing has come to our attention that causes us to believe that the Information is not prepared, in all material respects, in accordance with the Framework.
Understanding how the Company has prepared the Information
The absence of a commonly used generally accepted reporting framework or a significant body of established practice on which to draw to evaluate and measure information allows for different, but acceptable, measurement techniques that can affect comparability between entities and over time. Consequently, the Information needs to be read and understood together with the Framework attached to this report.
Responsibilities of Management
- ■establishing a suitable Framework for preparing the Information;
- ■preparation of the Information in compliance with the Framework;
- ■designing, implementing and maintaining internal control over information relevant to the preparation of the Information that is free from material misstatement, whether due to fraud or error.
Statutory Auditor’s Responsibilities
- ■planning and performing the engagement to obtain limited assurance about whether the Information is free from material misstatement, whether due to fraud or error;
- ■forming an independent conclusion, based on the procedures we have performed and the evidence we have obtained; and
- ■reporting our conclusion to the directors of the Company.
As we are engaged to form an independent conclusion on the Information as prepared by management, we are not permitted to be involved in the preparation of the Information as doing so may compromise our independence.
- ■challenging the eligibility criteria and the Framework reviewed by the extra-financial rating agency ISS ESG;
- ■the use of funds allocated to eligible projects after their allocation;
- ■the impact of eligible projects in the effort against greenhouse gas emissions.
Professional Standards Applied
We performed a limited assurance engagement in accordance with the professional guidance of the French Institute of Statutory Auditors (“CNCC”) applicable to such engagements and International Standard on Assurance Engagements 3000 (Revised) Assurance Engagements other than Audits or Reviews of Historical Financial Information, issued by the International Auditing and Assurance Standards Board.
Our Independance and Quality Control
We have complied with the independence and other ethical requirements of the French Code of Ethics for Statutory Auditors (Code de déontologie) as well as the provisions set forth in Article L. 822-11 of the French Commercial Code (Code de commerce) and the International Code of Ethics for Professional Accountants (including International Independence Standards) issued by the International Ethics Standards Board for Accountants, which is based on the fundamental principles of integrity, objectivity, professional competence and confidentiality diligence and professional conduct.
In addition, our firm applies International Standard on Quality Control 1 and accordingly we have implemented a system of quality control including documented policies and procedures regarding compliance with applicable legal and regulatory requirements, the ethical requirements and professional standards.
Our work was carried out by an independent and multidisciplinary team with experience in sustainability reporting and assurance. We remain solely responsible for our assurance conclusion.
Summary of the Work we Performed
We are required to plan and perform our work to address the areas where we have identified that a material misstatement of the Information is likely to arise. The procedures we performed were based on our professional judgment. In carrying out our limited assurance engagement on the Information, we:
- ■obtained an understanding of the procedures implemented by the Company for producing the Information by inquiries of management;
- ■assessed the compliance, in all significant aspects, of eligible projects with the eligibility criteria of the Framework;
- ■verified the amount of funds collected and their allocation to eligible projects as presented in the Information attached to our report;
- ■verified the consistency of the amounts allocated to eligible projects with the accounting records and the data underlying the accounting.
The procedures performed in a limited assurance engagement vary in nature and timing from, and are less in extent than for, a reasonable assurance engagement both in terms of the risk assessment procedures, including the understanding of internal control, and the procedures performed in response to the risk assessment. Consequently, the level of assurance obtained in a limited assurance engagement is substantially lower than the assurance that would have been obtained had we performed a reasonable assurance engagement.
5.1.Shareholding
5.1.1.Changes in capital stock
As of December 31, 2022, the Company’s capital stock amounted to €1,379,625,380, divided into 197,089,340 fully paid-up shares with a par value of €7 each, all in the same class.
The total number of double voting rights within the Company has remained below 2% of the total number of voting rights since the completion of the merger between PSA and FCA and the distribution of Faurecia shares held by Stellantis.
The breakdown of Faurecia’s capital stock and voting rights as of December 31, 2022 and over the last three fiscal years is as follows:
|
Number |
% capital |
Theoretical |
% theoretical voting rights |
Exercisable |
% exercisable voting rights |
---|---|---|---|---|---|---|
Major shareholders(1) |
|
|
|
|
|
|
HELLA Family Pool |
18,162,790 |
8.95 |
18,162,790 |
8.93 |
18,162,790 |
8.93 |
Exor |
9,948,904 |
5.05 |
9,948,904 |
4.98 |
9,948,904 |
4.98 |
PEUGEOT 1810 |
6,110,494 |
3.10 |
6,620,494 |
3.31 |
6,620,494 |
3.31 |
Bpifrance Participations |
4,266,020 |
2.16 |
4,266,020 |
2.13 |
4,266,020 |
2.14 |
Dongfeng |
3,880,379 |
1.97 |
3,880,379 |
1.94 |
3,880,379 |
1.94 |
Subtotal |
42,368,587 |
21.23 |
42,878,587 |
21.29 |
42,878,587 |
21.30 |
Company shareholding |
|
|
|
|
|
|
Corporate officers(2) |
368,389 |
0.19 |
466,222 |
0.23 |
466,222 |
0.23 |
Employee shareholding (including FCP Faur’ESO)(3) |
3,752,754 |
1.90 |
4,411,351 |
2.21 |
4,411.351 |
2.21 |
Treasury stock |
147,093 |
0.07 |
147,093 |
0.07 |
0 |
0 |
o/w liquidity contract |
70,000 |
0.04 |
70,000 |
0.04 |
0 |
0 |
Subtotal |
4,268,236 |
2.17 |
5,024,666 |
2.51 |
4,877,573 |
2.44 |
Floating shareholding |
|
|
|
|
|
|
Other shareholders (registered and bearer)(4) |
150,452,517 |
76.60 |
151,998,664 |
76.20 |
151,998,664 |
76.25 |
Total |
197,089,340 |
100 |
199,901,917 |
100 |
199,754,824 |
100 |
(1) The major shareholders mentioned are those (i) holding more than 5% of the capital or voting rights as of December 31 and/or (ii) resulting from the distribution of Faurecia shares held by Stellantis or from the HELLA acquisition. (2) Excluding PEUGEOT 1810, Board member, whose shareholding is indicated above. However, this figure includes the shares held personally by Robert PEUGEOT, who was an individual Board member until May 31, 2021 and then has been the permanent representative of PEUGEOT 1810 since that date. Taking into account the stake held by PEUGEOT 1810, the percentages of capital, theoretical voting rights and capital, theoretical voting rights and voting rights exercisable at the General Meeting would be 3.29% and 3.55 % respectively. (3) Calculated in accordance with Article L. 225-102 of the French Commercial Code. This figure includes the shares held by Faur’ESO International Employees as part of the Stock Appreciation Rights (SAR) plan. (4) Including Stellantis. (5) Theoretical voting rights = total number of voting rights attached to the total number of shares, including shares deprived of voting rights (including treasury shares). It is reminded that, in accordance with applicable regulations on the crossing of thresholds, the thresholds related to voting rights are calculated on the basis of theoretical voting rights (and not on the basis of exercisable voting rights). (6) Exercisable voting rights = number of voting rights attached to the shares with voting rights. |
|
Situation |
Situation |
Situation |
||||||||
---|---|---|---|---|---|---|---|---|---|---|---|
Number |
% capital stock |
Theore- |
% theore- |
% of voting rights exercis- |
Number of shares |
% capital stock |
% theore- |
Number |
% capital stock |
% theore- |
|
Major shareholders(1) |
|
|
|
|
|
|
|
|
|
|
|
Stellantis(2) |
- |
- |
- |
- |
- |
1,166,434 |
0.85 |
0.83 |
54,297,006 |
39.34 |
56.02(8) |
HELLA Family Pool |
18,162,790 |
8.95 |
18,162,790 |
8.93 |
8.93 |
- |
- |
- |
- |
- |
- |
Exor |
9,948,904 |
5.05 |
9,948,904 |
4.98 |
4.98 |
7,653,004 |
5.54 |
5.47 |
- |
- |
- |
PEUGEOT 1810(3) |
6,110,494 |
3.10 |
6,620,494 |
3.31 |
3.31 |
4,700,380 |
3.41 |
3.36 |
510,000 |
0.37 |
0.26 |
Bpifrance Participations |
4,266,020 |
2.16 |
4,266,020 |
2.13 |
2.14 |
3,281,554 |
2.38 |
2.35 |
- |
- |
- |
Dongfeng |
3,880,379 |
1.97 |
3,880,379 |
1.94 |
1.94 |
2,984,909 |
2.16 |
2.13 |
- |
- |
- |
Subtotal |
42 368 587 |
21.23 |
42,878,587 |
21.29 |
21.30 |
19,786,281 |
14.33 |
14.14 |
54,807,006 |
39.71 |
56.28 |
Company shareholding |
|
|
|
|
|
|
|
|
|
|
|
Corporate officers(4) |
368,389 |
0.19 |
466,222 |
0.23 |
0.23 |
125,767 |
0.09 |
0.12 |
98,523 |
0.07 |
0.06 |
Employee shareholding (including FCP Faur’ESO)(5) |
3,752,754 |
1.90 |
4,411,351 |
2.21 |
2.21 |
3,765,155 |
2.73 |
2.97 |
458,110 |
0.33 |
0.41 |
Treasury stock |
147,093 |
0.07 |
147,093 |
0.07 |
- |
84,171 |
0.06 |
0.06 |
499,273 |
0.36 |
0.26 |
o/w liquidity contract |
70,000 |
0.04 |
70,000 |
0.04 |
- |
- |
- |
- |
- |
- |
- |
Subtotal |
4,268,236 |
2.17 |
5,024,666 |
2.51 |
2.44 |
3,975,093 |
2.88 |
3.15 |
1,055,906 |
0.76 |
0.73 |
Floating shareholding |
|
|
|
|
|
|
|
|
|
|
|
Other shareholders (registered and bearer) |
150,452,517 |
76.60 |
151,998,664 |
76.20 |
76.25 |
114,274,427 |
82.79 |
82.70 |
82,172,889 |
59.53 |
42.99 |
Total |
197,089,340 |
100 |
199,901,917 |
100 |
100 |
138,035,801 |
100 |
100 |
138,035,801 |
100 |
100 |
(1) The main shareholders mentioned are those (i) holding more than 5% of the share capital or voting rights as of December 31, (ii) resulting from the distribution of Faurecia shares held by Stellantis completed on March 22, 2021 or (iii) resulting from the acquisition of the majority interest in HELLA. (2) The stake in Faurecia was held by Peugeot SA (PSA) until the completion of the merger between FCA and PSA on January 16, 2021 to create Stellantis. As part of this merger, the stake in Faurecia was transferred to Stellantis. On March 8, 2021, the General Meeting of Stellantis approved the distribution of the stake in Faurecia to the shareholders of Stellantis, it being specified that upon completion of this distribution, on March 22, 2021, Stellantis retained approximately 0.85% of the capital stock in order to be able to meet the commitments made by PSA to General Motors, and taken over at the time of the merger, upon the purchase of Opel (delivery of Faurecia shares in the event of the exercise by General Motors of share subscription warrants issued by PSA). As of 31 December 2022, Stellantis no longer holds any shares of Faurecia. (3) The stake of 510,000 shares was initially held by Peugeot Invest. It was contributed to PEUGEOT 1810 as part of the internal reclassification carried out by the Peugeot family prior to the merger with Stellantis. (4) Excluding PEUGEOT 1810, Board member since May 31, 2021, whose shareholding is indicated above. However, this figure includes the shares held personally by Robert PEUGEOT, who was an individual Board member until May 31, 2021 and then has been the permanent representative of PEUGEOT 1810 since that date. Taking into account the stake held by PEUGEOT 1810,the percentages of capital, theoretical voting rights and voting rights exercisable at the Annual General Meeting would be 3.29% and 3.55% respectively. (5) Calculated in accordance with Article L. 225-102 of the French Commercial Code. This figure includes the shares held by Faur’ESO International Employees as part of the Stock Appreciation Rights (SAR) plan. (6) Theoretical voting rights = total number of voting rights attached to the total number of shares, including shares deprived of voting rights (including treasury shares). It is reminded that, in accordance with applicable regulations on the crossing of thresholds, the thresholds related to voting rights are calculated on the basis of theoretical voting rights (and not on the basis of exercisable voting rights). (7) Exercisable voting rights = number of voting rights attached to the shares with voting rights. (8) The difference between the percentage of capital held by the shareholder and the percentage of voting rights results from the holding by the shareholder of double voting rights. |
Since the distribution of the stake in the Company by Stellantis to its shareholders completed on March 22, 2021, there are no longer any “related party relationships” between the Stellantis Group and the Faurecia group, the relationship between the two groups having become a simple customer/supplier relationship.
5.1.2.Crossing of legal thresholds
The following disclosures regarding crossing of legal thresholds have been made since the beginning of the 2022 fiscal year and until the date of this Universal Registration Document. It is reminded that, in accordance with applicable regulations on the crossing of thresholds, the investment thresholds related to voting rights are calculated on the basis of theoretical voting rights. Information provided below is based on thresholds crossing notices published by the Autorité des Marchés Financiers (AMF).
Shareholder’s name |
No. and date of AMF publication |
Date of the crossing |
Threshold crossed |
Upwards/ |
Number of shares/voting rights (depending on thresholds crossed) afterwards |
% capital stock afterwards |
% theoretical voting rights afterwards |
---|---|---|---|---|---|---|---|
HELLA Family Investors |
222C0301/February 4, 2022 |
January 31, 2022 |
5% of capital stock and voting rights |
Upward |
13,571,385 shares |
8.95% |
8.84% |
BlackRock, Inc. |
222C0706/March 28, 2022 |
March 25, 2022 |
5% of capital stock |
Upward |
7,617,385 shares |
5.02% |
4.96% |
BlackRock, Inc. |
222C0723/March 30, 2022 |
March 28, 2022 |
5% of capital stock |
Downward |
6,801,096 shares |
4.49% |
4.43% |
Bank of America Corporation |
222C0793/April 7, 2022 |
April 4, 2022 |
5% of capital stock and voting rights |
Upward |
8,019,393 shares |
5.29% |
5.23% |
BlackRock, Inc. |
222C0900/April 22, 2022 |
April 21, 2022 |
5% of capital stock and voting rights |
Upward |
7,792,717 shares |
5.14% |
5.08% |
BlackRock, Inc. |
222C0912/April 25, 2022 |
April 22, 2022 |
5% of capital stock and voting rights |
Downward |
7,575,788 shares |
4.99% |
4.94% |
Bank of America Corporation |
222C0955/April 28, 2022 |
April 26, 2022 |
5% of capital stock and voting rights |
Downward |
353,210 shares |
0.23% |
0.23% |
BlackRock, Inc. |
222C1120/May 13, 2022 |
May 12, 2022 |
5% of capital stock and voting rights |
Upward |
7,901,840 shares |
5.21% |
5.15% |
BlackRock, Inc. |
222C1139/May 16, 2022 |
May 13, 2022 |
5% of capital stock and voting rights |
Downward |
7,251,108 shares |
4.78% |
4.72% |
BlackRock, Inc. |
222C1251/May 25, 2022 |
May 23, 2022 |
5% of capital stock and voting rights |
Upward |
8,085,451 shares |
5.33% |
5.27% |
BlackRock, Inc. |
222C1336/June 1, 2022 |
May 31, 2022 |
5% of capital stock and voting rights |
Downward |
5,361,824 shares |
3.54% |
3.49% |
JP Morgan Chase & Co. |
222C1413/June 8, 2022 |
June 3, 2022 |
5% of capital stock and voting rights |
Upward |
7,996,600 shares |
5.27% |
5.21% |
Bank of America Corporation |
222C1438/June 10, 2022 |
June 6, 2022 |
5% of capital stock and voting rights |
Upward |
9,476,102 shares |
6.25% |
6.17% |
BlackRock, Inc. |
222C1545/June 20, 2022 |
June 17, 2022 |
5% of capital stock and voting rights |
Upward |
8,338,746 shares |
5.50% |
5.43% |
JP Morgan Chase & Co. |
222C1552/June 21, 2022 |
June 16, 2022 |
5% of capital stock and voting rights |
Downward |
6,740,682 shares |
4.45% |
4.39% |
BlackRock, Inc. |
222C1569/June 22, 2022 |
June 20, 2022 |
5% of capital stock and voting rights |
Downward |
6,989,101 shares |
4.61% |
4.55% |
BlackRock, Inc. |
222C1608/June 23, 2022 |
June 22, 2022 |
5% of capital stock and voting rights |
Upward |
8,251,857 shares |
5.44% |
5.38% |
JP Morgan Chase & Co. |
222C1613/June 24, 2022 |
June 21, 2022 |
5% of capital stock and voting rights |
Upward |
7,805,746 shares |
5.15% |
5.09% |
BlackRock, Inc. |
222C1619/June 24, 2022 |
June 23, 2022 |
5% of capital stock and voting rights |
Downward |
5,979,136 shares |
3.94% |
3.90% |
JP Morgan Chase & Co. |
222C1668/June 30, 2022 |
June 24, 2022 |
5% of capital stock and voting rights |
Downward |
7,522,306 shares |
4.96% |
4.90% |
Bank of America Corporation |
222C1694/July 1, 2022 |
June 27, 2022 |
5% of capital stock and voting rights |
Downward |
711,485 shares |
0.47% |
0.46% |
5.1.3.Shareholdings of shareholders representing more than 5% of the capital stock or voting rights
To the Company’s knowledge, no shareholder holds directly or indirectly, alone or in concert, more than 5% of the Company’s capital or voting rights:
- ■at December 31, 2022, with the exception of the HELLA Family Pool and Exor NV;
- ■at the date of this Universal Registration Document, with the exception of the HELLA Family Pool and Exor NV.
In accordance with applicable regulations, the Company is entitled to request at any time, either from the central custodian that maintains the issuance account for its securities or directly from one or more registered intermediaries, information on the holders of securities conferring immediate or future voting rights at its own General Meetings, such as the identity of the holder, nationality, year of birth or establishment, the postal and, where applicable, electronic address, the number of securities held by each of them and the type of holding of these securities, the date on which they began to be held as well as, where applicable, any restrictions that may apply to the securities.
To the Company’s knowledge, no shareholder has pledged the Faurecia shares it holds, with the exception of Peugeot 1810 for the amount of 536,825 Faurecia shares (for more information, see Chapter 3 “Corporate governance”, Section 3.5.2 “Transactions in the Company's securities by corporate officers”).
5.2.Capital stock
5.2.1.Authorized capital stock
The table below summarizes the financial authorizations and delegations for capital increases and cancellations of shares granted by the General Meeting held on June 1, 2022, as well as the use made of them during the 2022 fiscal year and since the beginning of the 2023 fiscal year up to the date of this Universal Registration Document.
Type of authorization/delegation |
Maximum amount/nominal value |
Term |
Utilization |
---|---|---|---|
Resolution No. 14 Delegation of authority to be granted to the Board of Directors to issue shares and/or securities giving access, immediately or in the future, to the share capital of the Company and/or of a Subsidiary, with preferential subscription rights (suspension during tender offer periods) |
|
26 months |
Delegation used by the Board of Directors on June 1, 2022 for the partial refinancing of the acquisition of HELLA (repayment of part of the bridging loan). The Chief Executive Officer used the sub-delegation on June 24, 2022 and noted the completion of the capital increase related to the creation of 45,482,154 new shares.
|
Resolution No. 15 Delegation of authority to be granted to the Board of Directors to issue shares and/or securities giving access, immediately or in the future, to the share capital of the Company and/or a Subsidiary, without preferential subscription rights through a public offering (excluding offers referred to in 1° of Article L. 411-2 of the French Monetary and Financial Code) and/or as compensation for securities as part of a public exchange offer (suspension during tender offer periods) |
|
26 months |
No |
Resolution No. 16 Delegation of authority to be granted to the Board of Directors to issue shares and/or securities giving access, immediately or in the future, to the share capital of the Company and/or a Subsidiary, without preferential subscription rights through an offer exclusively targeting a restricted circle of investors acting for their own account or qualified investors (suspension during tender offer periods) |
|
26 months |
No |
Resolution No. 17 Authorization to increase the amount of issues provided for in Resolutions No. 14, No. 15 and No. 16 (suspension during tender offer periods) |
|
26 months |
No |
Resolution No. 18 Delegation to be granted to the Board of Directors to issue shares and/or securities giving access, immediately or in the future, to the share capital of the Company, without preferential subscription rights, in order to remunerate contributions in kind to the Company (suspension during tender offer periods) |
|
26 months |
No |
Resolution No. 19 Delegation of authority to be granted to the Board of Directors to increase the Company's share capital by incorporation of reserves, profits, premiums or other amounts whose capitalization would be allowed (suspension during a public tender offer period) |
|
26 months |
No |
Resolution No. 20 Authorization to be granted to the Board of Directors to grant, for free, existing shares and/or shares to be issued to employees and/or certain corporate officers of the Company or of affiliated companies or economic interest groups, with waiver by the shareholders of their preferential subscription rights |
|
26 months |
Authorization used by the Board of Directors on July 28, 2022 in a maximum amount of 2,388,290 shares for the implementation of Plan No. 14. |
Resolution No. 21 Delegation of authority to be granted to the Board of Directors for the purpose of increasing the share capital through the issue of shares and/or securities giving access to the share capital, with removal of preferential subscription rights for the benefit of members of a company or group savings plan |
|
26 months |
No |
Resolution No. 22 Delegation of authority to be granted to the Board of Directors for the purpose of carrying out share capital increases, with removal of preferential subscription rights in favor of a category of beneficiaries |
|
18 months |
No |
Resolution No. 23 Authorization to be granted to the Board of Directors for the purpose of reducing the capital stock by cancellation of shares |
|
26 months |
No |
The table below shows the financial authorizations granted by the General Meeting of May 31, 2021 used during the 2022 fiscal year and deprived of effect since the General Meeting of June 1, 2022 for the unused portion:
Type of authorization/delegation |
Maximum amount/nominal value |
Term |
Utilization |
---|---|---|---|
Resolution No. 21 Delegation to be granted to the Board of Directors to issue shares and/or securities giving access, immediately or in the future, to shares in the Company, without preferential subscription rights, for the purpose of compensating contributions in kind to the Company (suspension during tender offer periods) |
|
26 months |
Delegation used by the Board of Directors on December 10, 2021 as part of the HELLA acquisition in order to compensate the portion of the acquisition of 60% of the capital, with sub-delegation to the Chief Executive Officer. The Chief Executive Officer used the sub-delegation on January 31, 2022 and noted the completion of the capital increase related to the creation of 13,571,385 new shares. |
5.2.2.Potential capital
As of December 31, 2022, the potential capital was comprised only of performance shares(1).
The Company’s policy on the allocation of performance shares, which aims to benefit the Chief Executive Officer, the members of the Executive Committee, as well as the Group Leadership Committee comprising 286 members at December 31, 2022, is described in the Chief Executive Officer’s compensation policy (Chapter 3, “Corporate Governance”, Section 3.3.4.1.3 “Compensation policy for the Chief Executive Officer” of this Universal Registration Document).
Performance share plans
Internal conditions
External condition (net earnings per share)
The charts above summarize the current performance share plans (or those expired) during the fiscal year ended December 31, 2022.
In view of the decision of the Board of Directors on July 22, 2022 to adjust the rights to free shares subject to performance conditions not yet vested, the number of shares of Plans 11, 12, 13 and ESPI were multiplied by 1.0788.
It is reminded that, for information purposes and to allow a consolidated reading of the data on the performance conditions selected and their rate of achievement, the definitive vesting of the performance shares is subject to fulfilment of the following performance conditions:
- ■an internal performance condition related to the Group net income after tax, before taking into account capital gains from disposal of assets and changes in the Group's structure. This internal condition is measured by comparing the net income for the third fiscal year ending after the grant date of the performance shares with that forecast for the same period in the strategic plan. The number of shares that will be definitively granted in respect of this criterion varies according to achievement of the set targets, with a range around the target (minimum, target, maximum)(2);
- ■an internal condition on corporate social and environmental responsibility (CSR) related to gender equality, and more precisely the percentage of women within the “Managers & Professionals” (“management”) category of the Group for the third fiscal year ending after the date on which the performance shares are granted, compared to the targets set by the Board of Directors. The number of shares that will be definitively granted in respect of this criterion varies according to achievement of the set targets, with a range around the target (minimum, target, maximum);
- ■an external condition, i.e., growth of the Company’s net earnings per share assessed between the last fiscal year before the grant date of the shares and the third fiscal year ended after the grant date of the shares. This condition is assessed against the weighted growth of a reference group made up of 12 comparable international automotive suppliers over the same period. The number of shares that will be definitively granted in respect of this criterion varies according to achievement of the set targets (minimum, target, maximum) according to the methods described below:
- ■minimum: (i) if the weighted growth in net earnings per share of the peer group is less than or equal to -20%, i.e. negative, the external condition is reached at least if the growth in Faurecia’s net earnings per share is equal to 125% of this weighted growth; (ii) if the weighted growth in net earnings per share of the peer group is between -20% and +20%, the external condition is at least met if the growth in Faurecia’s net earnings per share is 5% lower than this weighted growth; (iii) if the weighted growth in net earnings per share of the peer group is greater than or equal to +20%, i.e. positive, the external condition is reached at least if the growth in Faurecia’s net earnings per share is equal to 75% of this weighted growth,
- ■target: if the reference group’s weighted growth in net earnings per share is in line with the growth in Faurecia’s net earnings per share, the target external condition is fulfilled,
- ■maximum: (i) if the weighted growth in net earnings per share of the peer group is less than or equal to -20%, i.e. negative, the external condition is reached at the maximum if the growth in Faurecia’s net earnings per share is greater than or equal to 75% of this weighted growth; (ii) if the weighted growth of the peer group’s net earnings per share is between -20% and +20%, the external condition is reached at the maximum if the growth of Faurecia’s net income is greater than or equal by 5% of this weighted growth; (iii) if the weighted growth in net earnings per share of the peer group is greater than or equal to +20%, i.e. positive, the external condition is reached at the maximum if the growth in Faurecia’s net earnings per share is greater than or equal to 125% of this weighted growth.
Depending on the achievement of the performance conditions, the definitive allocation of shares is carried out as follows:
- ■50% of the number of shares expressed at target provided the minimum objective threshold of the performance condition is reached;
- ■100% of the number of shares expressed at target provided the target objective threshold of the performance condition is reached;
- ■130% of the number of shares expressed at target provided the maximum objective threshold of the performance condition is reached;
- ■between these thresholds, the progression is linear.
The performance conditions applicable to the Chief Executive Officer for Plan 14 are the same as for Plans No. 11, No. 12 and No. 13 (details in 2021 Universal Registration Document chap 3.3.4.1.3):
- ■an internal condition related to the Group net income after tax, before taking into account capital gains from disposal of assets and changes in scope. This internal condition is measured by comparing the net income for the third fiscal year ending after the grant date of the performance shares with that forecast for the same fiscal year in the strategic plan. The number of shares that will be definitively granted in respect of this criterion varies according to achievement of the targets set, with a range around the target (minimum, target, maximum);
- ■an internal condition on CSR related to gender equality, and more precisely the percentage of women within the “Managers & Professionals” (“management”) category of the Group for the third fiscal year ending after the date on which the performance shares are granted, compared to the targets set by the Board of Directors. The number of shares that will be definitively granted in respect of this criterion varies according to achievement of the targets set, with a range around the target (minimum, target, maximum);
- ■an external performance condition, i.e., growth of the Company’s net earnings per share assessed between the last fiscal year before the grant date of the shares and the third fiscal year ended after the grant date of the shares. The number of shares that will be definitively granted in respect of this criterion varies according to achievement of the set targets (minimum, target, maximum) according to the methods described below:
- ■minimum: (i) if the weighted growth in net earnings per share of the peer group is less than or equal to -20%, i.e. negative, the external condition is reached at least if the growth in Faurecia’s net earnings per share is equal to 125% of this weighted growth; (ii) if the weighted growth in net earnings per share of the peer group is between -20% and +20%, the external condition is at least met if the growth in Faurecia’s net earnings per share is 5% lower than this weighted growth; (iii) if the weighted growth in net earnings per share of the peer group is greater than or equal to +20%, i.e. positive, the external condition is reached at least if the growth in Faurecia’s net earnings per share is equal to 75% of this weighted growth,
- ■target: if the peer group's weighted growth in net earnings per share is in line with the growth in Faurecia’s net earnings per share, the target external condition is fulfilled,
- ■maximum: (i) if the weighted growth in net earnings per share of the peer group is less than or equal to -20%, i.e. negative, the external condition is reached at the maximum if the growth in Faurecia’s net earnings per share is greater than or equal to 75% of this weighted growth; (ii) if the weighted growth of the peer group's net earnings per share is between -20% and +20%, the external condition is reached at the maximum if the growth of Faurecia’s net income is greater than or equal by 5% of this weighted growth; (iii) if the weighted growth in net earnings per share of the peer group is greater than or equal to +20%, i.e. positive, the external condition is reached at the maximum if the growth in Faurecia’s net earnings per share is greater than or equal to 125% of this weighted growth.
For the other beneficiaries excluding the Chief Executive Officer, the nature and number of performance conditions have been adapted in order to support the Group’s strategy and in particular the objective of carbon neutrality by 2025. The performance conditions are as follows:
- ■an internal criterion relating to the Group’s Operating Income (including the Company and the companies belonging to the scope of consolidation) for the fiscal year ended December 31, 2024 (the “Internal Operating Income Criterion”). The number of shares that will be definitively granted in respect of this criterion varies according to achievement of the targets set, with a range around the target (minimum, target, maximum);
- ■an internal criterion relating to the Net Cash Flow of the Group (including the Company and the companies belonging to the scope of consolidation) for the fiscal year ended December 31, 2024 (the “Internal Net Cash Flow Criterion”). The number of shares that will be definitively granted in respect of this criterion varies according to achievement of the targets set, with a range around the target (minimum, target, maximum);
- ■an internal condition on CSR related to gender equality, and more precisely the percentage of women within the “Managers & Professionals” (“management”) category of the Group for the third fiscal year ending after the date on which the performance shares are granted, compared to the targets set by the Board of Directors. The number of shares that will be definitively granted in respect of this criterion varies according to achievement of the targets set, with a range around the target (minimum, target, maximum);
- ■an internal CSR criterion relating to the reduction of CO2 emissions and aimed at the Group’s carbon neutrality objective (the “Internal CSR Criterion Reduction of CO2 Emissions”). Reduction in CO2 emissions means the reduction compared to the baseline on December 31, 2019, for the Faurecia Group. The number of shares that will be definitively granted in respect of this criterion varies according to achievement of the targets set, with a range around the target (minimum, target, maximum);
- ■an external performance condition, i.e., growth of the Company’s net earnings per share assessed between the last fiscal year before the grant date of the shares and the third fiscal year ended after the grant date of the shares. The number of shares that will be definitively granted in respect of this criterion varies according to achievement of the set targets (minimum, target, maximum) according to the methods described below:
- ■minimum: (i) if the weighted growth in net earnings per share of the peer group is less than or equal to -20%, i.e. negative, the external condition is reached at least if the growth in Faurecia’s net earnings per share is equal to 125% of this weighted growth; (ii) if the weighted growth in net earnings per share of the peer group is between -20% and +20%, the external condition is at least met if the growth in Faurecia’s net earnings per share is 5% lower than this weighted growth; (iii) if the weighted growth in net earnings per share of the peer group is higher than or equal to +20%, i.e. positive, the external condition is reached at least if the growth in Faurecia’s net earnings per share is equal to 75% of this weighted growth,
- ■target: if the peer group’s weighted growth in net earnings per share is in line with the growth in Faurecia’s net earnings per share, the target external condition is fulfilled,
- ■maximum: (i) if the weighted growth in net earnings per share of the peer group is less than or equal to -20%, i.e. negative, the external condition is reached at the maximum if the growth in Faurecia’s net earnings per share is greater than or equal to 75% of this weighted growth; (ii) if the weighted growth of the peer group’s net earnings per share is between -20% and +20%, the external condition is reached at the maximum if the growth of Faurecia’s net income is higher than or equal by 5% of this weighted growth; (iii) if the weighted growth in net earnings per share of the peer group is higher than or equal to +20%, i.e. positive, the external condition is reached at the maximum if the growth in Faurecia’s net earnings per share is higher than or equal to 125% of this weighted growth.
In a context of high uncertainty regarding automotive production volumes, the Board of Directors, on the recommendation of the Compensation Committee, will have the option of adapting the performance conditions by means of an automatic adjustment mechanism for the internal financial criteria targets, in the event of significant variances in global automotive production volumes compared to the Company’s strategic plan for the year in question, as follows:
- ■Net Income: in the event of a significant variance in global automotive production volumes compared to the Company’s strategic plan, the target would be adjusted downward or upward by +/- €45 million for each variance of one million vehicles produced. The minimum and maximum of the achievement of the criterion would therefore be adjusted upwards or downwards by the same value in millions of euros;
- ■Operating Profit: in the event of a significant variance in global automotive production volumes compared to the Company’s strategic plan, the target would be adjusted downward or upward by +/- €50 million for each variance of one million vehicles produced. The minimum and maximum of the achievement of the criterion would therefore be adjusted upwards or downwards by the same value in millions of euros;
- ■Net Cash Flow: in the event of a significant variance in global automotive production volumes compared to the Company’s strategic plan, the target would be adjusted downward or upward by +/- €46 million for each variance of one million vehicles produced. The minimum and maximum of the achievement of the criterion would therefore be adjusted upwards or downwards by the same value in millions of euros.
Depending on the achievement of the performance conditions, the definitive allocation of shares is carried out as follows:
- ■50% of the number of shares expressed at target provided the minimum objective threshold of the performance condition is reached;
- ■100% of the number of shares expressed at target provided the target objective threshold of the performance condition is reached;
- ■130% of the number of shares expressed at target provided the maximum objective threshold of the performance condition is reached.
Single Executive Super Performance Initiative (ESPI) plan
An external relative Total Shareholder Return (TSR) condition, i.e., Faurecia’s TSR compared to the TSR for the same period of a peer group made up of 12 comparable global automotive suppliers (the “Relative TSR”). This Relative TSR condition is assessed as follows:
- ■an annual assessment of the Relative TSR (the “Annual Relative TSR”)(3), with a level of achievement recorded each year over a period of five years, giving rise to a maximum annual partial vesting of 20%. The total amount of the definitive allocation in respect of the Relative Annual TSR will be equal to the sum of the five years of partial vesting;
- ■an assessment of the average relative TSR at the end of the reference period of five years (the “Average Relative Five Year TSR”), not giving rise to any partial vesting, the achievement level being calculated at the end of the reference period of five years and taking into account all of the Relative Annual TSRs for the period - this valuation method only applies to the Chief Executive Officer.
The percentage of the vesting, whether partial under the Relative Annual TSR (therefore for year N) or under the Average Relative Five-Year TSR, is determined by measuring the position of the percentile of Faurecia’s TSR relative to that of the peer group for the same period:
- ■if the TSR performance of Faurecia is strictly below the 50th percentile: 0%;
- ■if the TSR performance of Faurecia is on the 50th percentile (trigger threshold): 50%;
- ■if the TSR performance is higher than or equal to the 75th percentile (target): 100%.
Detailed history of performance share plans(4)
Table No. 9 of the AFEP-MEDEF Code and table No. 10 of AMF position-recommendation No. 2021-02
Information on performance shares grant |
Plan No. 10 of July 19, 2018(1) (2) |
Plan No. 11 of October 9, 2019(1) (3) (4) |
---|---|---|
GM date |
May 29, 2018 |
May 28, 2019 |
Board of Directors date |
July 19, 2018 |
October 9, 2019 |
Total number of shares allocated during the relevant fiscal year by threshold, of which:
Corporate officers
|
Min.: 209,136 Target: 418,272 Max.: 543,760
0 Min.: 10,385 Target: 20,770 Max.: 27,000 |
Min. : 439,930 Target: 881,930 Max.: 1,147,260
0 Min.: 21,620 Target: 43,250 Max.: 56,220 |
Number of beneficiaries |
269 |
274 |
Acquisition date |
July 19, 2022 |
October 9, 2023 |
Availability date |
July 19, 2022 |
October 9, 2023 |
Performance conditions |
Internal condition on Group net income (after tax) (weighting of 60%), with a required achievement rate between 91% and 110%, the target being 100%
External condition on net earnings per share (weighting of 40%), according to the assessment methods described in the introductory section |
Internal condition on Group net income
Internal CSR condition related to gender equality (weighting of 10%) with an achievement rate between -1 and +2 pts, the target being 100%
External condition on net earnings per share (weighting of 30%), according to the assessment methods described in the introductory section |
Achievement rate of performance conditions |
Internal condition on Group net income (after tax): 0%
External condition on net earnings per share: 0%
Overall vesting rate: 0% No shares will be granted under this plan. |
Internal condition Group net income (after tax): 0%
Internal CSR condition related to gender equality: 115%
External condition on net earnings per share: 0%
Overall vesting rate: 11.5% |
Number of shares relating to adjustment further to the capital increase |
- |
6,268 |
Number of shares vested at December 31, 2022 |
- |
345 |
Accumulated number of shares cancelled or forfeited as of December 31, 2022 |
418,272 |
807,895 |
Performance shares outstanding at December 31, 2022 |
- |
79,958 |
(1) As the performance conditions of Plans No. 10 and No. 11 are known, the actual number of shares vested, cancelled or lapsed are indicated in this table after application of the decision of the Board of Directors of July 22, 2022 to adjust the rights to free shares subject to performance conditions not yet vested. (2) The meeting of the Board of Directors held on July 19, 2018, based on the authorization given by the General Meeting of May 29, 2018, decided to grant a complementary plan (Plan 10b) to four beneficiaries who are not corporate officers of the Company in relation to a geographical zone of the Group, for a maximum number of shares of 12,830 and subject to specific performance conditions in relation to said geographical zone. The other characteristics of this complementary plan and the acquisition date are the same as the ones of plan No. 10. (3) The Board of Directors meeting of October 9, 2019, based on the authorization given by the General Meeting of May 28, 2019, decided to grant a complementary plan (Plan 11b) to six beneficiaries who are not corporate officers of the Company in relation to a geographical zone of the Group, for a maximum number of shares of 33,240 and subject to specific performance conditions in relation to said geographical zone. The other characteristics of this complementary plan and the acquisition date are the same as the ones of plan No. 11. (4) Given the impact of the Covid-19 health crisis and the consequences on economic activity and on the Group, the internal condition numerical targets became unreachable. In this context, at a meeting held on October 22, 2020, on a recommendation of the Compensation Committee, the Board of Directors resolved, without modifying the performance conditions and their respective weighting, to make an adjustment to the internal numerical targets of Plan No. 11 to reflect the influence of the new economic and market data on the numerical targets while keeping the same achievement curve. |
Information on performance shares grant |
Plan No. 12 of October 22, 2020(6) |
ESPI Plan of July 23, 2021 |
---|---|---|
GM date |
June 26, 2020 |
June 26, 2020 |
Board of Directors date |
October 22, 2020 |
July 23, 2021 |
Number of shares allocated during the relevant period by threshold, of which:
Corporate officers
|
Min.: 531,220 Target: 1,064,670 Max.: 1,384,630
0 Min.: 23,510 Target: 47,030 Max.: 61,140 |
Min.: 336,775(7) Target: 673,549(8)
0 Min.: 35,971(9) Target: 71,941(9)
|
Number of beneficiaries |
282 |
13 |
Acquisition date |
October 22, 2024 |
July 23, 2026 |
Availability date |
October 22, 2024 |
July 23, 2026 |
Performance conditions |
Internal condition on Group net income (after tax) (weighting of 60%), with a required achievement rate between 90% and 110%, the target being 100%
Internal CSR condition related to gender equality (weighting of 10%) with an achievement rate between -1 and +2 pts, the target being 100%
External condition on net earnings per share (weighting of 30%), according to the assessment methods described in the introductory section |
Relative Annual TSR (weighting of 50% for the Chief Executive Officer and of 100% for the members of the Executive Committee), according to the assessment methods described in the introductory section
Average Five-Year TSR (weighting of 50% for the Chief Executive Officer and 0% for the members of the Executive Committee), according to the assessment methods described in the introductory section |
Achievement rate of performance conditions |
Plan being vested
Internal and external conditions not known at the time of filing of this Universal Registration Document |
Plan being vested
Annual relative TSR 2021-2022: 0% |
Number of shares relating to adjustment further to the capital increase |
67,824 |
53,088 |
Number of shares vested at December 31, 2022 |
3,388 |
0 |
Accumulated number of shares cancelled or forfeited as of December 31, 2022(5) |
254,037 |
240,944 |
Performance shares outstanding at December 31, 2022(5) |
875,069 |
485,693 (10) |
(5) Plan expressed at target after application of the decision of the Board of Directors of July 22, 2022 to adjust the rights to free shares subject to performance conditions not yet vested. (6) The impact of the integration of HELLA into Faurecia's accounts as from 2022, as well as exceptional events such as the war in Ukraine and the level of vehicle production, have been restated from the internal target criterion for net income after tax under Plan No. 12 by decision of the Board of Directors on July 22, 2022, while maintaining the same attainment curve. (7) Including 307,685 shares subject to performance conditions and 29,090 phantom shares subject to performance conditions. (8) Including 615,370 shares subject to performance conditions and 58,179 phantom shares subject to performance conditions. (9) Only shares subject to performance conditions were granted. (10) As the performance condition of the first tranche is known, the number of shares remaining is indicated accordingly.
|
Information on performance shares grant |
Plan No. 13 of October 25, 2021 |
Plan No. 14 of July 28, 2022 |
---|---|---|
GM date |
May 31, 2021 |
June 1, 2022 |
Board of Directors date |
October 25, 2021 |
July 28, 2022 |
Number of shares allocated during the relevant period by threshold, of which:
Corporate officers
|
Min.: 532,730 Target: 1,067,730 Max.: 1,389,000
0 Min.: 36,980 Target: 73,960 Max.: 96,150 |
Min.: 924,140 Target: 1,848,920(11) Max.: 2,402,810
0 Min.: 65,320 Target: 130,640 Max.: 169,830 |
Number of beneficiaries |
298 |
302 |
Acquisition date |
October 25, 2025 |
July 28, 2022 |
Availability date |
October 25, 2025 |
July 28, 2026 |
Performance conditions |
Internal condition on Group net income (after tax) (weighting of 60%), with a required achievement rate between 90% and 110%, the target being 100%
Internal CSR condition related to gender equality (weighting of 10%) with an achievement rate between -1 and +2 pts, the target being 100%
External condition on net earnings per share (weighting of 30%), according to the assessment methods described in the introductory section |
For the Chief Executive Officer:
For the other beneficiaries
|
Achievement rate of performance conditions |
Plan being vested |
Plan being vested |
Number of shares relating to adjustment further to the capital increase |
78,646 |
- |
Number of shares vested at December 31, 2022 |
3,345 |
- |
Accumulated number of shares cancelled or forfeited as of December 31, 2022(5) |
126,170 |
83,530 |
Performance shares outstanding at December 31, 2022(5) |
1,016,861 |
1,765,390 |
(5) Plan expressed at target after application of the decision of the Board of Directors of July 22, 2022 to adjust the rights to free shares subject to performance conditions not yet vested. (11) Including performance-related shares granted by the Chief Executive Officer, in accordance with the decision of the Board of Directors and on the latter’s sub-delegation, to employees hired after the aforementioned date. A minimum of 5,580 shares, a target of 11,170 shares and a maximum of 14,520 shares. Apart from the grant date, the other conditions are identical to those of Plan No. 14 of July 28, 2022, including for the acquisition date.
|
The maximum number of shares allocated free of charge pending vesting as at December 31, 2022 (5,281,714 shares) represent 2.68% of the Company’s capital stock at this date(5).
5.2.3.Change in capital stock over five years
Year and type of transaction |
Shares created/ canceled during |
Nominal amount |
Amounts of capital stock after the transaction |
Shares comprising capital stock after the transaction |
---|---|---|---|---|
07/2021 Capital increases reserved for employees and a category of beneficiaries under the Faur’ESO employee share ownership plan |
2,756,942 |
19,298,594 |
985,549,201 |
140,792,743 |
07/2021 Capital reduction (cancelation of shares) intended to neutralize the dilutive effect resulting from the capital increases implemented as part of the Faur’ESO employee shareholding plan. |
2,756,942 |
19,298,594 |
966,250,607 |
138,035,801 |
01/2022 Issue of new shares in consideration for a contribution in kind of shares by the members of the family pool as part of the combination between Faurecia and HELLA |
13,571,385 |
94,999,695 |
1,061,250,302 |
151,607,186 |
06/2022 Capital increase with preferential subscription rights as part of the refinancing of the acquisition of HELLA |
45,482,154 |
318,375,078 |
1,379,625,380 |
197,089,340 |
Capital stock at December 31, 2022 |
|
|
1,379,625,380 |
197,089,340 |
5.2.4.Employee share ownership
On March 16, 2021, Faurecia announced the launch of the non-dilutive plan known as “Faur’ESO” (Faurecia Employee Share Ownership) for up to 2% of the Company’s capital stock, deployed in 15 countries and targeting up to 90% of the Group's employees. The objective of this plan was to strengthen the existing bond with employees by closely involving them in the development and performance of the Group. At the end of the subscription period, which ended on June 25, 2021, more than 22% of employees across the 15 eligible countries had expressed their desire to invest in Faur’ESO 2021, which was significantly higher than the benchmark, thus marking a large success for a first operation.
In accordance with the terms of the plan, 2,756,942 shares (approximately 2% of the capital stock) were subscribed for at a unit price of €36.15 (corresponding to the benchmark price of €45.18 after a discount of 20%). The capital increases and the settlement-delivery of the shares took place on July 28, 2021. As Faur’ESO is a non-dilutive plan, 2,756,942 shares acquired as part of the share buy-back program carried out from March 17 (inclusive) to April 29 (inclusive) in the context of Faur’ESO, were cancelled on July 28, 2021 to neutralize the dilution.
5.3.Transactions carried out by the Company in its own shares
The General Meeting of June 1, 2022 authorized the implementation of a share buy-back program which replaced, from that date, the program authorized by Resolution 16 of the General Meeting of May 31, 2021.
Liquidity contract
Description of the contract
Since April 27, 2009, Faurecia has been implementing a liquidity contract that complies with the AMAFI Charter.
The current liquidity contract was signed on November 18, 2019 between Faurecia and Rothschild Martin Maurel. This contract, which complies with the AMF decision No. 2021-01 of June 22, 2021 covering the implementation of liquidity contracts on equity securities in respect of accepted market practices, replaced the previous contract of November 20, 2015, as amended on May 24, 2018.
The liquidity contract was signed for 12 months, from November 18, 2019 and is thereafter renewable by tacit renewal for successive 12-month periods. The amount of €10,837,505.31 was recorded as credit in the liquidity account on November 15, 2019.
The liquidity contract covers Company shares, and the trading platform on which the transactions are carried out is the Euronext regulated market in Paris.
The contract stipulates that its execution shall be suspended under the conditions set out in Article 5 of the above-mentioned AMF decision, namely (i) while stabilization measures are being carried out under the meaning of (EU) Regulation No. 596/2014 of the European Parliament and Council of April 16, 2014 on market abuse, with the suspension of the liquidity contract taking place from the admission to trading of the securities concerned by the stabilization measures up to the publication of the information indicated in Article 6, Paragraph 3 of the Delegated (EU) Regulation No. 2016/1052 and (ii) during a public offering period or pre-offering period and until the offer is closed, when the issuer initiates the public offering or when the issuer’s securities are targeted by the offering.
The contract may also be suspended on the Company’s request for technical reasons, such as the counting of shares with voting rights before General Meetings or the counting of shares giving rights to dividends before the ex-dividend date and for a period that it shall specify.
The contract may be terminated at any time by the Company, without notice and with notice of one month for the investment services provider.
Implementation in 2022
In 2022, under the liquidity contract, cumulative purchases related to 1,677,438 shares, i.e. 0.85% of the capital stock, for a value of €40,118,192 and cumulative sales related to 1,607,438 shares for a value of €38,493,049. The capital gain generated in 2022 under the liquidity contract amounted to €1,625,143. Management fees for the liquidity contract came to €150,000 in 2022. Under this liquidity contract, as at December 31, 2022, the following assets were included in the liquidity account: 70,000 securities and €9,215,330 in cash.
Use of treasury shares during the fiscal year
During the 2022 fiscal year, the Company used 7,078 treasury shares to serve the beneficiaries of performance share plans.
Number of treasury shares held at December 31, 2022
As at December 31, 2022, the Company held 147,093 shares in treasury (including 70,000 under the liquidity contract), representing 0.07% of the Company's capital stock on the same date. These treasury shares are all allocated to the objective of allocating shares to employees, and more specifically to cover performance share plans.
Description of the SHARE buyback program
The program description presented below will not be subject to a specific publication, in accordance with the provisions of Article 241-3 of the Autorité des Marchés Financiers (AMF) General Regulation.
The General Meeting of May 30, 2023 will be asked to authorize the Board of Directors to once again trade in the shares of the Company under the conditions described below. It is stipulated that, throughout the period of a public offer filed by a third party on the Company's shares, repurchases may only be carried out provided that they:
- ■enable the Company to comply with commitments it entered into prior to the opening of the offer period;
- ■are carried out as a part of the continuation of a share buy-back program already underway;
- ■are not likely to cause the offer to fail;
- ■are in line with one of the first two objectives below.
This new authorization cancels the authorization granted to the Board of Directors by the General Meeting of June 1, 2022 to trade in Company shares (Resolution No. 13.).
Program objectives
- ■hedge stock option plans and/or free share allocation plans (or similar plans) to the benefit of Group employees and/or corporate officers (including related Economic Interest Groups and companies), as well as all allocations of shares as part of a group or company savings plan (or similar plan), under a profit-sharing plan and/or any other form of allocation of shares to the benefit of the Group employees and/or corporate officers (including related Economic Interest Groups and companies);
- ■cover the Company’s commitments under financial contracts or cash-settled options granted to Group employees and/or corporate officers (including related Economic Interest Groups and companies);
- ■hedge securities giving access to the allocation of Company shares;
- ■retain the shares purchased and use these shares for exchange or payment at a later stage, as part of any possible merger, spin-off, contribution or external growth transactions;
- ■cancel shares;
- ■support the secondary market or the liquidity of Faurecia shares, through an investment service provider under a liquidity contract in accordance with the practices permitted by the Autorité des Marchés Financiers (AMF).
This program is also designed to allow the implementation of all market practices that may be permitted by the market authorities, and more generally, the completion of all other transactions in accordance with legislation or regulations that are or may become applicable. In such an event, the Company shall inform its shareholders through a press release.
Maximum number of shares to be acquired
The maximum number of shares that may be purchased may not at any time exceed 10% of the total number of shares comprising the capital stock (for information purposes 19,708,934 shares as of December 31, 2022), it being specified that (i) this cap applies to an amount of the Company’s capital stock that may, if applicable, be adjusted to take into account the transactions affecting the capital stock after this General Meeting and (ii) in accordance with the applicable provisions, when the shares are purchased for liquidity purposes, the number of shares taken into account to calculate the aforementioned cap of 10% corresponds to the number of shares purchased less the number of shares resold during the duration of the authorization. The acquisitions made by the Company may not, under any circumstances, lead it to hold, directly or indirectly through subsidiaries, over 10% of its capital stock. Moreover, the number of shares acquired by the Company for the purpose of retaining and using them for exchange or payment at a later stage, as part of any possible merger, spin-off, contribution or external growth transactions, may not exceed 5% of its capital stock.
The shares may, in all or part, depending on the case, be acquired, sold, exchanged or transferred, in one or several installments, by all means, on all markets, including on multilateral trading facilities or through a systematic internalizer, or over the counter, including through the acquisition or disposal of blocks of shares (without limiting the part of the buy-back program that may be completed through this means), in all cases, either directly or indirectly, notably through an investment service provider. These means include the use of optional mechanisms or derivatives subject to the applicable regulations.
Maximum price per share and maximum amount allocated to the program
The maximum purchase price is set at €80 per share (excluding acquisition costs). In the event of a capital increase through the capitalization of premiums, reserves or profits by allocations of free shares as well as in the event of a division of shares, reverse stock split or any other transaction affecting the capital stock, the aforementioned price will be adjusted by a multiplication coefficient equal to the ratio of the number of Company shares prior to the transaction and the number of shares after the transaction. On this basis, and for information only, based on the capital stock at December 31, 2022 comprising 197,089,340 shares, and without taking into account the shares already held by the Company, the theoretical maximum purchase amount for the program (excluding acquisition costs) would amount to €1,576,714,720.
Program term
5.4.Share price
Faurecia shares (EO:FP) are listed on Compartment A of the regulated Euronext Paris market. It is listed on the CAC Next 20, CAC 40 ESG and MSCI France indices.
At the end of 2022 (Friday, December 30, 2022), the closing price was €14.13 compared with the 2021 closing price of €41.83 (Friday, December 31, 2021).
This decrease of 66.22% year-on-year is mainly due to the strong impact of the war in Ukraine on the financial markets and its consequences on the global macroeconomic environment, particularly in terms of inflation and energy; over the same period, the CAC 40 and SBF 120 indices fell by 9.50% and 10.32% respectively.
In addition to these major macroeconomic difficulties, the automotive industry as a whole, and more particularly the OEMs, continued to be penalized by the shortage of semiconductors; still in 2022, the share prices of equipment manufacturers comparable to Faurecia recorded declines much more marked than those of the aforementioned indices, of around 40% (Continental -39.88%, Plastic Omnium -40.59% and Valeo -37.17%).
Finally, the last reason specific to the Faurecia share is the risk aversion of investors in this negative environment created by the war in Ukraine and in a context of a sharp rise in interests rates. Indeed, the significant increase in the Group’s financial debt due to the acquisition of the majority interest in HELLA (finalized at the end of January 2022), was a third factor that weighed on Faurecia’s share in 2022 and explains the performance differential in relation to comparable equipment manufacturers.
In addition, during 2022, the number of shares increased from 138,035,801 at December 31, 2021 to 197,089,340 shares at December 31, 2022, due to two major liquidity events:
- ■the issue, at the beginning of February, of 13,571,385 new shares to the pool of family shareholders of HELLA in partial payment of the acquisition price of their stake;
- ■the issue, at the end of June, of 45,482,154 new shares issued as part of the capital increase to finance part of the acquisition of the majority interest in HELLA.
Thus, if we consider Faurecia’s market capitalization in 2022, it recorded an annual decrease of 51.77%, (197,089,340 shares x €14.13 = nearly €2.785 billion at the end of 2022 compared to 138,035,801 shares x €41.83 = nearly €5.775 billion at the end of 2021), close to the change in the share price of comparable equipment manufacturers.
Faurecia's enterprise value, which totals market capitalization and net debt, increased by nearly 16% in 2022: from nearly €9.241 billion at the end of 2021 to nearly €10.723 billion at the end of 2022, reflecting the increase in net debt related to the acquisition of the majority interests in HELLA.
The average price of Faurecia’s share over 2022 was €20.51. The price peaked at €40.74 on January 17, 2022, and hit its lowest closing price of the year, €10.87, on September 29, 2022.
The average number of monthly trades on Euronext was 30.719 million shares, representing €612.78 million.
5.4.1.Share price and trading volumes (source Euronext)
2022 share price and trading volumes |
Price (in €) |
Trading volume |
||||
High |
Average |
Low |
Close |
Shares |
Capital |
|
January |
45.16 |
42.51 |
38.14 |
38.63 |
11,995,795 |
507,156 |
February |
43.75 |
39.56 |
32.85 |
34.05 |
17,236,742 |
670,861 |
March |
34.19 |
25.01 |
21.86 |
23.65 |
37,819,015 |
954,356 |
April |
24.82 |
22.41 |
19.71 |
21.07 |
29,170,079 |
649,961 |
May |
26.40 |
22.23 |
18.60 |
25.82 |
37,718,205 |
865,663 |
June |
23.95 |
21.09 |
18.14 |
18.92 |
37,397,666 |
803,585 |
July |
19.51 |
17.09 |
15.39 |
17.55 |
32,008,274 |
547,418 |
August |
18.32 |
16.22 |
13.69 |
14.39 |
28,279,405 |
454,354 |
September |
15.36 |
13.64 |
10.75 |
11.23 |
40,727,033 |
545,829 |
October |
15.16 |
12.90 |
10.73 |
15.12 |
39,919,449 |
508,362 |
November |
17.90 |
15.70 |
13.36 |
15.76 |
32,939,260 |
511,858 |
December |
16.20 |
14.25 |
13.26 |
14.13 |
23,412,900 |
333,941 |
2021 share price and trading volume |
Price (in €) |
Trading volume |
||||
High |
Average |
Low |
Close |
Shares |
Capital (in € thousands) |
|
January |
45.74 |
41.56 |
37.69 |
43.35 |
10,646,237 |
442,476 |
February |
47.00 |
44.34 |
42.24 |
42.81 |
8,439,662 |
374,216 |
March |
50.70 |
46.00 |
41.43 |
45.43 |
23,948,682 |
1,101,660 |
April |
50.76 |
47.58 |
44.60 |
44.90 |
15,096,374 |
718,219 |
May |
45.68 |
44.33 |
42.28 |
44.23 |
10,370,038 |
459,706 |
June |
47.43 |
44.46 |
40.99 |
41.37 |
13,295,633 |
591,131 |
July |
41.96 |
39.00 |
36.12 |
37.63 |
12,991,456 |
506,606 |
August |
44.16 |
40.20 |
35.68 |
40.84 |
15,900,625 |
639,151 |
September |
42.02 |
39.30 |
36.04 |
40.90 |
14,506,758 |
570,060 |
October |
45.14 |
42.45 |
38.71 |
45.05 |
12,472,301 |
529,429 |
November |
49.06 |
44.07 |
35.94 |
37.90 |
15,237,589 |
671,569 |
December |
41.83 |
39.40 |
37.20 |
41.83 |
10,566,803 |
416,331 |
5.4.2.Stock market data
|
31/12/2022 |
31/12/2021 |
---|---|---|
Stock market capitalization at end of the fiscal year (in € millions) |
2,784.9 |
5,774.0 |
Share price (in €): |
|
|
|
45.16 |
50.76 |
|
10.73 |
35.68 |
Share price at the end of the fiscal year (in €) |
14.13 |
41.83 |
Shareholders’ equity per share (in €) |
23.08 |
24.84 |
Number of shares in circulation |
197,089,340 |
138,035,801 |
5.4.3.Dividends
Fiscal year |
Gross dividend per share (in €)(1) |
Total (in €) |
2019(3) |
- |
- |
2020 |
1.00 |
138,035,801(2) |
2021(4) |
- |
- |
(1) Dividend fully eligible for the 40% tax allowance for private individuals resident for tax purposes in France as provided for by Article 158, 3 2° of the French General Tax Code. (2) Figure including the amount of the dividend corresponding to treasury shares held by the Company not paid and allocated to the retained earnings account. (3) Exceptionally, due to the global crisis caused by the Covid-19 pandemic, no dividend was paid in respect of the 2019 results. (4) It was decided to exceptionally suspend the payment of dividends in 2022 in order to further contribute to the increase in financial flexibility, particularly following the acquisition of HELLA. |
As indicated on November 3, 2022, Faurecia’s Board of Directors decided to propose to the next General Meeting, which should be held on May 30, 2023, not to pay a dividend in 2023 in respect of 2022.
5.4.4.Dividend payment policy
Shareholder compensation is set in accordance with the Group’s net cash allocation strategy. This, presented for the first time at the Capital Markets Day in November 2019, consists of allocating:
- ■approximately 60% of the net cash generated each year (net cash flow) to the Group’s debt reduction as well as to potential non-transformative/medium-sized acquisitions (bolt-ons);
- ■approximately 40% to the distribution of dividends and share buy-backs, exercised in particular within the framework of performance share allocation programs, in order to avoid any dilution caused by said programs.
On the occasion of the last Capital Markets Day, held on November 3, 2022, the Group’s net cash allocation strategy was confirmed, while stressing the short-term priority of accelerating debt reduction for the Group, following the acquisition of the majority interest in HELLA, which took place in early 2022. To this end, it was communicated that Faurecia’s Board of Directors, at its meeting of November 2, 2022, had decided to propose to the next General Meeting, which should be held on May 30, 2023, not to pay a dividend in 2023 in respect of 2022.
5.4.5.Per share figures
The method used to calculate the weighted average number of shares before dilution to determine per share data is detailed in Note 9, Section 1.3.5 “Notes to the consolidated financial statements”, Chapter 1 “Financial and accounting information”.
5.4.6.2023 financial calendar
February 20, 2023 |
Before market opening |
2022 annual results announcement |
April 17, 2023 |
Before market opening |
First-quarter 2023 sales announcement |
May 30, 2023 |
2:00 p.m. |
General Meeting of shareholders |
July 27, 2023 |
Before market opening |
First-half 2023 interim results announcement |
October 20, 2023 |
Before market opening |
Third-quarter 2023 sales announcement |
5.5.Relations with the financial community
For many years, Faurecia’s management has made it a priority to establish a relationship of trust with financial market players as well as promoting exchanges of information and meetings.
The Group therefore encourages constructive dialog, both on its financial results and on its strategy and latest news, through accurate, comprehensive, regular and transparent financial reporting, in accordance with current regulations and as close as possible to financial communication best practices.
HELLA, in which Faurecia acquired a majority interests finalized at the end of January 2022 and which has been consolidated in Faurecia’s financial statements since February 1, 2022, is listed on the Frankfurt Stock Exchange (ticker: HLE). As a result, HELLA manages its financial communications independently, while adhering to a financial communications calendar compatible with that of Faurecia for its consolidated financial statements. HELLA, whose fiscal year prior to the acquisition of Faurecia’s capital stock, began on June 1 and ended on May 31 of each year, has taken the decision to exceptionally end a financial year of seven months running from June 1, 2022 to December 31, 2022 and then align its fiscal year with the calendar year from 2023. As such, Faurecia and HELLA will have identical tax years from 2023. HELLA’s financial communications are available on the website www.hella.com, in German and English.
Approach
The Faurecia group provides investors with a large number of documents covering its business, strategy and all the financial information that it is required to disclose under stock market regulations. They include the Company’s registration documents and Universal Registration Documents, interim financial reports, documents distributed as regulated information, as well as the Company’s by-laws and the Board of Directors’ internal rules, and are available online at www.faurecia.com or www.forvia.com, in French and English.
Financial information is regularly supplemented by the publication of press releases announcing important events relating to the Group’s operations and activities. All of these press releases are available in the “Newsroom” space on the website.
At the end of each quarter, the Group organizes a communication on its performance for the previous quarter or half year:
- ■in April and October of each year, the Group publishes changes to its quarterly sales by business and by region. In addition to a press release, a telephone meeting is also held for this communication, to which analysts and investors are invited;
- ■in February and July, the Group publishes all of its annual and half-yearly results. In addition to a press release, a meeting is then held (physical meeting or videoconference) to which analysts and investors are invited.
Throughout the year, Faurecia promotes meetings between its Executive Management and financial market players at conferences and meetings (financial roadshows) in France and worldwide, in the form of individual or group meetings.
Finally, the Group very regularly organizes investor days (“Capital Markets Days”) to present the medium-term strategic vision, with some of these days dedicated to specific topics.
- ■a toll-free number has been set up, which is available in France only (0805 651 206). This number allows individual shareholders to obtain information or answers to any questions they may have about the life of the Group, or about how to become a shareholder (all their requests can also be sent to the following address: actionnaires@faurecia.com);
- ■a digital “Letter to shareholders” is published twice a year on the Group’s website;
- ■meetings with individual shareholders are organized in the various French regions.
The quantified elements
In 2022, in addition to meetings to present annual and interim results and conference calls for Q1 and Q3 sales reporting, Faurecia met with more than 200 investors and financial analysts during financial roadshows, conferences, and individual appointments.
Given the Covid-related health crisis and the measures put in place to limit the spread of the virus, a large part of the meetings organized in 2022 were still held by conference call, but a return to physical meetings became gradually possible, while naturally respecting preventive measures.
On November 3, 2022, Faurecia and HELLA, operating jointly under the name FORVIA, held their first joint “Capital Markets Day” in Paris, during which the Group presented “Power25”, its new medium-term plan (2025) aiming to generate profitable growth, strengthen cash generation and accelerate the Group’s debt reduction.
This new medium-term plan was also presented at a physical meeting for individual shareholders in Lyon on December 14, 2022.
6.1.Legal information
Company name and headquarters
Company name: Faurecia
Registered office: 23-27, avenue des Champs-Pierreux, 92000 Nanterre - France
Telephone: + 33 (0) 1 72 36 70 00
Fax: + 33 (0) 1 72 36 70 07
Website: www.faurecia.com
The information provided on the website is not part of the Universal Registration Document, unless it is incorporated by reference into it.
Legal form
Faurecia is a European company whose shares are admitted to trading on the regulated market of Euronext Paris. The Company is governed by the provisions of Regulation (EC) No. 2157/2001 of the Council of October 8, 2001 on European company status, by the French Commercial Code and by the texts adopted for its application; Faurecia refers to the corporate governance regime provided for by the AFEP-MEDEF Code.
Faurecia abides by the legal and regulatory provisions that apply to the governing bodies of listed companies and reports in this Universal Registration Document on the application of the recommendations made in relation to the AFEP-MEDEF Code.
Statutory Auditors
The Company’s financial statements are audited by two Statutory Auditors appointed in accordance with Articles L. 225-228 and L. 22-10-66 of the French Commercial Code.
Date of incorporation and term
Incorporation details
Consultation of corporate documents
During the period of validity of this Universal Registration Document, the following documents (or copies thereof) may be consulted, if required:
- the issuer’s articles of incorporation and bylaws;
- all reports, letters and other documents, assessments and statements prepared by any expert at the Company’s request, any part of which is included or referred to in the Universal Registration Document.
- the Universal Registration Documents and Registration Documents (including the annual financial reports) and interim financial reports filed with the Autorité des Marchés Financiers (AMF) for each of the past ten periods;
- the Group’s annual and biannual presentations of the results and outlook, as well as the quarterly financial information.
The aforementioned documents, as well as the regulated information published during the last 12 months, can be consulted at the addresses indicated under the heading “Consultation address” below.
Contact details
Faurecia’s Legal department, 23-27, avenue des Champs-Pierreux, 92000 Nanterre and on the Company’s website at www.faurecia.com.
Corporate purpose
- ■to create, acquire, run, directly or indirectly manage, by acquisition of holdings, by rental or by any other means, in Europe and internationally, all forms of industrial companies, trading companies and tertiary sector companies;
- ■to research, obtain, acquire and use patents, licenses, processes and trademarks;
- ■to rent all types of real estate, bare or constructed;
- ■to provide administrative, financial and technical assistance to affiliated enterprises;
- ■to run plants and establishments which it owns or may acquire in the future;
- ■to manufacture, use and/or sell, regardless of form, its own products or those of affiliated enterprises;
- ■to manufacture and commercialize, by direct or indirect means, all products, accessories or equipment, regardless of their nature, intended for industrial use, and in particular by the automobile industry;
- ■to directly or indirectly participate in all financial, industrial or commercial operations that may relate to any one of the above-mentioned purposes, including but not limited to setting up new companies, making asset contributions, subscribing to or purchasing shares or voting rights, acquiring an interest or holding, mergers, or in any other way;
and, more generally, to conduct any industrial, commercial and financial operations, and operations relating to fixed or unfixed assets, that may relate, directly or indirectly, to any one of the above-mentioned purposes, totally or partially, or to any similar or related purposes, and even to other purposes of a nature to promote the Company’s business.
Role of the Company in relation to its subsidiaries
Faurecia is a holding company, whose assets are primarily made up of equity interests. The Company’s industrial assets are held by the operating subsidiaries.
Faurecia provides, directly and indirectly, financial, accounting, management, administrative and other services to Group companies (including the Combined Group).
The list of consolidated companies as at December 31, 2022 is available in Chapter 1 “Financial and accounting information”, Section 1.3 “Consolidated financial statements ”.
A simplified organizational chart of the Group’s companies is available in Section 6.2 “Simplified organizational chart” and illustrates the Company’s positioning within the Group.
FISCAL YEAR
Distribution of profits
Income available for distribution corresponds to net income for the year, less any losses carried forward from prior years and any amounts appropriated to reserves in compliance with the law or the bylaws, plus any retained earnings.
Out of this income, the General Meeting determines the portion attributed to shareholders in the form of dividends and deducts the amounts it considers appropriate to allocate to any reserve funds or to carry forward.
Except in the case of a capital reduction, no distributions may be made to shareholders if the Company’s shareholders’ equity represents – or would represent after the planned distribution – less than its capital stock plus any reserves which, according to the law or the bylaws, are not available for distribution.
The General Meeting may also decide to distribute amounts deducted from optional reserves in order to pay or increase a dividend or pay a special dividend.
The Company’s bylaws provide that the Ordinary General Meeting approving the financial statements for the year may also decide to offer each shareholder, for all or part of the dividend to be paid or interim dividends, the option between the payment of the dividend or the interim dividend in cash or in shares.
Dividends – statute of limitations
Dividends are lapsed after five years from the date of payment if uncollected. After this period, they are paid to the Treasury.
Registrar and paying agent
The transfer service and coupon payments are provided by Uptevia, 12 place des Etats-Unis, CS 40083 Montrouge Cedex, France.
Faurecia stock market data
Faurecia shares (EO.PA) are listed on Compartment A of the regulated market of Euronext Paris (ISIN code FR0000121147). It is listed on the CAC Next 20, MSCI France and CAC 40 ESG® indices.
General Meetings of shareholders
The rules governing the participation of shareholders in General Meetings are described in Articles 24 and 25 of the Company’s bylaws which are available on the governance page of the Company’s website (www.faurecia.com).
General Meetings are held at the Company’s registered office or at any other venue specified in the notice of meeting.
Holders of registered shares are convened by post or email if the e-notice process is accepted. The other shareholders are notified via the relevant banks and brokers through the financial notices provided for by the applicable regulations.
A continually updated schedule of all the Group’s financial events, including the date of the General Meeting, is available on Faurecia’s website at www.faurecia.com.
The right to participate in General Meetings shall be substantiated in accordance with the current legal provisions.
The rights of shareholders, which may only be amended in accordance with the conditions laid down by applicable laws and regulations, are not affected by any other provision of the bylaws.
Voting rights
Voting rights at Ordinary, Extraordinary and Special General Meetings are exercisable by the beneficial owner of the shares.
The bylaws (Article 24) assign double voting rights to all fully paid-up shares that have been registered in the name of the same holder for at least two (2) years. In the case of a bonus share issue paid up by capitalizing retained earnings, income or additional paid-in capital, the bonus shares allotted in respect of registered shares carrying double voting rights will also carry double voting rights as from the date of issue. Shares that are transferred or converted to bearer form are stripped of double voting rights in the cases provided for by law.
Existence of agreements whose implementation could result in a change of control of the Company or could have the effect of delaying, deferring or preventing a change of control
To the best of the Company’s knowledge, there are no agreements to date whose implementation could, at a later date, result in a change of control. There are currently no provisions in any Company deeds, bylaws, charters, regulations or provisions in place that could delay, postpone or prevent such a change in control.
Control
As of the date of publication of this Universal Registration Document, the Company is not controlled within the meaning of applicable regulations.
Elements likely to have an impact in the event of a public tender offer or exchange offer
Company’s capital structure
The capital structure is presented in Chapter 5 “Capital stock and shareholding structure”, Section 5.1.1 “Changes in capital stock”.
Direct or indirect investments in the Company’s capital stock referred to in Articles L. 233-7 and L. 233-12 of the French Commercial Code of which the Company is aware
The direct or indirect investments in the Company’s capital stock covered by Articles L. 233-7 and L. 233-12 of the French Commercial Code that the Company has knowledge of are presented in Chapter 5 “Capital stock and shareholding structure”, Section 5.1.2 “Crossing of legal thresholds”.
Owners of any stock with special rights of control
Article 24 of the bylaws stipulates that double voting rights are allocated to all shares that have been registered in the name of the same holder for at least two years. Subject to this reserve, there are no securities which carry special control rights referred to in Article L. 22-10-11, 4 of the French Commercial Code.
Statutory restrictions on the exercise of voting rights
Under the terms of Article 30 of the bylaws, in addition to the obligations for notifying thresholds provided for by law, any person or legal entity acting alone or in concert within the meaning of Article L. 233-10 of the French Commercial Code who comes to own or to cease to own a number of shares taking into account the cases of assimilation provided by the law applicable to the crossing of mandatory thresholds representing 1% or more of the capital stock or voting rights or any further multiple of this percentage, including over and above the legal thresholds, is required to notify the Company in writing of the total number of shares and voting rights held no later than four (4) business days after occurrence.
Any shareholder failing to declare ownership as required above shall be deprived of voting rights for the non-declared fraction if one or several shareholders present or represented at a general meeting, and collectively holding a share capital fraction (or voting rights) of at least 1%, make a request to this effect, logged in the minutes of the General Meeting.
Agreements between shareholders that, if the Company becomes aware of them, may give rise to restrictions on share transfer and the exercise of voting rights
On January 31, 2022, Faurecia acquired all of the shares held by the HELLA Family Pool in HELLA, at €60 per share, paid through a combination of €3.4 billion in cash and up to 13,571,385 newly-issued Faurecia shares. These new shares were issued on January 31, 2022.
In the context of this transaction and in accordance with the agreement entitled 'Investment Agreement' dated August 14, 2021 (as amended thereafter), the HELLA Family Pool has undertaken not to transfer:
- ■during a period of 18 months starting from the date of completion of the acquisition, i.e. until July 31, 2023, the above-mentioned 13,571,385 Faurecia shares, as well as any additional Faurecia shares that the HELLA Family Pool may subscribe in accordance with the subscription undertakings set out in the Investment Agreement;
- ■during a period of 12 months as from the expiration of the preceding period described above, i.e., until July 31, 2024, more than 5% of the Faurecia share capital (as outstanding on July 31, 2023).
These lock-up undertakings are subject to standard exceptions for such type of agreements (e.g., in case of transfers among members of the HELLA Family Pool or estate transfer) and were set out in an agreement governed by German law entered into between Faurecia and the members of the HELLA Family Pool on January 27, 2022, entitled the 'Blocking Agreement'.
Moreover, the Company has been informed by letter received on February 3, 2022 of the execution by the HELLA Family Pool of a shareholders' agreement constituting a concert action (action de concert) towards Faurecia. The main terms of this shareholders' agreement were published in accordance with the provisions of Article L. 233-11 of the French Commercial Code (see notice D&I AMF 222C0301 of February 4, 2022). Among others, this shareholders’ agreement provides for preemptive rights to the benefit of the other members of the HELLA Family Pool on shares held by a member excluded from the shareholders' agreement.
Rules applicable to the appointment and replacement of members of the Board of Directors
As part of the HELLA acquisition, Faurecia made a commitment concerning representation of the HELLA Family Pool on the Company’s Board of Directors, which will continue as long as the HELLA Family Pool holds at least 5% of the capital stock of the Company. Therefore, in accordance with this commitment, the HELLA Family Pool is represented on Faurecia’s Board of Directors by Dr. Jürgen BEHREND, who was appointed as a Board member by the General Meeting of June 1, 2022.
Powers of the Board of Directors
In accordance with the resolutions approved by the shareholders during the General Meeting of June 1, 2022, the Board of Directors can, with prior authorization of the General Meeting, implement the Company share buy-back program, issue shares and/or securities giving access to capital stock with, with removal or without preferential subscription rights, and proceed to free performance share grants and issue of shares and/or securities giving access to capital stock reserved for employees and a category of beneficiaries.
Agreements stipulating payments for members of the Board of Directors or employees if they resign or are dismissed without real and serious cause or if their employment is terminated due to a public takeover bid or exchange offer
There are no agreements of the type referred to in Article L. 22-10-11, 10 of the French Commercial Code in favor of members of the Board of Directors or employees. For the commitments applicable in the event of the departure of the Chief Executive Officer, please refer to Chapter 3 "Corporate governance", Sections 3.3.1.2.2.5 “Termination payment” to 3.3.1.2.2.7 “Notice and non-solicitation” and 3.3.4.1.3 “Compensation policy for the Chief Executive Officer”.
Agreements entered into by the Company which are amended or terminated in the event of a change in control of the Company
The significant bank facility agreements (including the syndicated loan, the Schuldscheindarlehen and the syndicated bridge loan), along with the bond issues of the Group, amounting to €9,460 million as of December 31, 2022, include early repayment clauses in the event of a change of control of the Company.
Major contracts
To date, Faurecia has not entered into any major contracts, other than (i) those entered into in the normal course of business and (ii) HELLA's refinancing documents, conferring a major obligation or commitment on the entire Group.
For more information on the description of the obligations and major commitments made in HELLA's acquisition-related documents, please refer to Chapter 1 “Financial and accounting information”, Section 1.1 "Review of the Group's business and consolidated results".
Dependence
See Chapter 2 “Risk factors & Risk management”, and especially risks associated with the automotive supplier business, supplier default and intellectual property.
Incorporation by reference
In accordance with Article 19 of European Commission Regulation No. 2017/1129, the following information is incorporated by reference in this Universal Registration Document:
- ■the consolidated financial statements, the financial statements, the corresponding audit reports and the comments on the consolidated financial statements, significant events by business segment and at Company level, as well as the Statutory Auditors' special report on related-party agreements appearing respectively on pages 71 to 136, 148 to 171, 137 to 143, 144 to 147, 172 to 175, 56 to 68 and 301 of the Universal Registration Document for the 2021 fiscal year filed with the AMF on April 6, 2022 under number D.22-0246 (https: //www.faurecia.com/sites/groupe/files/documents/FAU_URD_FR_PDF.pdf);
- ■the consolidated financial statements, the financial statements, the corresponding audit reports and the comments on the consolidated financial statements, significant events by business segment and at Company level, as well as the Statutory Auditors' special report on related-party agreements appearing respectively on pages 69 to 132, 143 to 164, 133 to 140, 165 to 169, 56 to 67, 140 to 142 and 284 of the Universal Registration Document for the 2020 fiscal year filed with the AMF on March 11, 2021 under number D.21-0112 (https://www.faurecia.com/sites/groupe/files/FaurecaiURD2020_FR.pdf).
6.2.Simplified organizational chart
The simplified organizational chart below shows the general legal organization of the Group as at December 31, 2022.
The full list of companies in the Group’s scope of consolidation as of December 31, 2022 is provided in Chapter 1 “Financial and accounting information”, Section 1.3.6 “List of consolidated companies at December 31, 2022”.
Group simplified organizational chart as at December 31, 2022
6.3.Historical background
1891. The first automobiles, in the modern sense, are made, powered by gasoline engines. The first steel tubes follow, patented by Peugeot and manufactured primarily in Audincourt (Doubs, France).
1929. Bertrand Faure acquires the patent for the Epeda process. The patent allows the Company to perfect its seats for the automotive industry. After the Second World War, Bertrand Faure’s customers include Renault, Peugeot, Citroën, Talbot, Panhard-Levassor, Berliet and Simca.
1950. Bernard Deconinck, the son-in-law of Joseph Allibert who founded the Allibert company, invests in an injection molding machine from the United States to mold large plastic parts from a single clamping unit. He moves into the automotive industry.
1955. A Peugeot subsidiary starts manufacturing automotive equipment (seats, exhausts, steering columns) and expands internationally.
1972. François Sommer merges his automotive floor coverings company with Bernard Deconinck’s company, Allibert. They combine their know-how in textiles and plastics to found the Sommer Allibert group.
1982. Epeda Bertrand Faure is listed on the Paris stock exchange on May 4, 1982. The Group goes on to specialize in the automotive industry (interior design). It also experiences strong international growth.
1987. Cycles Peugeot merges with Aciers & Outillages Peugeot to form Ecia (Équipements et Composants pour l’Industrie Automobile), the PSA Peugeot Citroën group’s specialist automotive equipment subsidiary. Over the next ten years, Ecia undergoes intensive industrial and geographical development.
1990. Epeda Bertrand Faure is the European leader in automotive seating trades and components following the acquisition of the Rentrop Group in Germany. It opts to focus on its expertise as an automotive supplier.
1992. Ecia sells its cycle business, then its tool business the following year and makes significant acquisitions in European companies specializing in exhaust, with Tubauto and Eli Échappement in France, Leistritz Abgastechnik in Germany and Silenciadores PCG in Spain. Ecia then becomes the European leader in exhaust systems. At the same time, its Automotive Seating division joins forces with Spanish automotive supplier Irausa and create Ardasa. Its customers include Volkswagen, Renault, Daimler Chrysler, Opel, Honda and Mitsubishi.
1997. In December, Ecia makes a friendly takeover bid for Bertrand Faure, bringing its direct and indirect stake in the Group to 99%.
1998. While Bertrand Faure sells his luggage and aeronautics businesses, Ecia sells its motorcycle business to the PSA Peugeot Citroën group.
1999. Ecia and Bertrand Faure merge to form Faurecia on June 1. Bertrand Faure brings to Ecia a broader geographical and commercial presence, particularly in Germany, where the Company forges strong partnerships with automakers such as Volkswagen and BMW. The merged entity generates sales of more than €4 billion with a workforce of 32,000. By the end of 1999, the PSA Peugeot Citroën Group is its main shareholder with a stake of 52.6%. At the end of 1999, the Faurecia group develops its exhaust systems business in North America by acquiring the US company AP Automotive Systems.
2000-2001. Faurecia purchases Sommer Allibert. The PSA Peugeot Citroën Group finances the transaction, thus increasing its shareholding in Faurecia to 71.5%. Now fully established in Germany and Spain, the Group has significant market shares in Europe in the vehicle interior sector. It then achieves sales of €9.6 billion.
2002-2007. Faurecia strengthens its operations in Asia. In 2002, it creates a joint venture with GSK, a Taiwanese automotive supplier, to produce seats in Wuhan, China, and in 2003 it acquires the South Korean company Chang Heung Precision, which specializes in exhaust systems. In 2005, Faurecia increases its stake in Daeki, a company specializing in exhaust systems acquired in 2002, from 49% to 100%. It signs a joint-venture agreement with the South Korean company Kwang Jin Sang Gong, dedicated to the production of door modules for Hyundai Motors and Kia Motors.
In Europe, the Group signs an agreement with Siemens-VDO, which strengthens and expands their joint venture (a joint stock company): this company assembles cockpits for BMW, Daimler Chrysler, the Ford group, Renault-Nissan and the Volkswagen group.
2009. Faurecia acquires Emcon Technologies (formerly Arvin Industries), and becomes the world leader in exhaust systems. Faurecia boosts both (i) its position with German and American automakers (notably Ford), and (ii) its operations in South America, India and Thailand. Faurecia also ventures into the specialized commercial vehicles market (trucks and off-road). Following this all-equity acquisition, One Equity Partners (JP Morgan Chase & Co.’s private equity arm), holds a 17.3% stake in Faurecia and PSA Peugeot Citroën’s interest is reduced to 57.4%.
Faurecia buys out its joint-venture partner Tata to become the sole owner of Taco Faurecia Design Center. The company is renamed Faurecia Automotive Engineering India and becomes Faurecia’s development center in India.
2010. Faurecia becomes European leader in external automotive parts by acquiring Plastal’s German and Spanish businesses. It was able to expand internationally, setting up a joint venture in China with Huaxiang, supplier of exterior parts to FAW-Volkswagen.
A strategic alliance with the Geely and Limin groups marks a significant new development stage for Faurecia Interior Systems and Faurecia Automotive Exteriors in China.
In Europe, Faurecia Automotive Seating acquires the “seat comfort technology” business of Hoerbiger Automotive Komfortsysteme GmbH, while Faurecia Interior Systems acquires Angell-Demmel Europe GmbH, world leader in metal interior trim parts for the automotive sector.
2011. Faurecia boosts its business in China by (i) signing a new joint-venture agreement with Ningbo Huazhong Plastic Products Co., Ltd to manufacture external automotive parts and (ii) extending its cooperation agreement with Changchun Xuyang group signed in 2010 whereby Faurecia takes an 18.75% stake in the company. This allows the Group to expand the range of products and services it provides in the following strategic areas: complete seats, interior systems, acoustic modules and interior linings.
2012. Faurecia acquires the interior components plant belonging to Ford ACH located in Saline, Michigan (United States) and signs a joint venture agreement with Rush Group Ltd. This joint venture, Detroit Manufacturing Systems (DMS), supports activities such as the assembly and sequencing of interior parts in a new plant in Detroit.
2013. As part of its development in Asia, Faurecia Interior Systems signs a joint venture agreement with Thai supplier Summit Auto Seats to support Ford. Faurecia also signs a joint-venture agreement with Chang’an Automobile Group, one of China’s largest automakers.
Faurecia and Magneti Marelli sign a cooperation agreement for the design, development and manufacture of human-machine interface (HMI) products for vehicle interiors.
2014. Faurecia sets up a joint venture, Faurecia Howa Interiors, with Japanese automotive supplier Howa, for the Mexican production of interior systems for Renault-Nissan. The agreement signed opens up new commercial prospects for Faurecia: with Nissan in Mexico, Thailand, Spain, Brazil and in South Africa.
Faurecia sets up a joint venture, Automotive Performance Materials (APM), with Interval, a major French farming cooperative, to develop and produce bio-sourced raw materials in order to continue Faurecia’s drive to make vehicles lighter while protecting the environment.
2015. Faurecia continues to expand in China and signs a global partnership agreement with Dongfeng Hongtai (a majority-owned subsidiary of Dongfeng Motor Corporation, one of China’s largest automotive groups) covering all of the Faurecia group’s businesses. The first step of this partnership is the formation, in May 2015, of two joint ventures, one with a view to the development, manufacture and delivery of automotive interior components (Dongfeng Faurecia Automotive Interior Co., Ltd) and the other with a view to the development, manufacture and delivery of automotive exterior components (Dongfeng Faurecia Automotive Exterior Co., Ltd).
Faurecia and Beijing WKW Automotive Parts Co., Ltd, one of China’s leading manufacturers of automotive interior and exterior trim parts, sign a joint-venture agreement. Together, the two partners aim to unlock synergies in the area of aluminum interior trim parts for light vehicles.
2016. Faurecia and the Italian company Tabu S.p.A., which is specialized in the production of flexible wood trims, sign a partnership agreement that results in the creation of the Ligneos S.r.l. joint venture. The two partners have developed a patented technology aimed at extending automotive wood trim applications to a wider range of surfaces.
In line with the agreement signed in December 2015, in July 2016, Faurecia sells its Automotive Exteriors bumpers and front-end modules business to Plastic Omnium (excluding the Faurecia Smart plant in Hambach and two joint ventures in Brazil and China).
Faurecia and German premium automaker Borgward sign a partnership agreement to create a joint venture (Borgward Faurecia Auto Systems Co., Ltd) in Tianjin, China, to jointly develop and produce complete automotive seats for the new Borgward vehicles.
2017. Faurecia expands its innovation ecosystem and forges technological and industrial partnerships with:
- ■Parrot Automotive, a leading provider of connectivity and infotainment solutions for the automotive industry. Faurecia gradually acquires shareholdings in the company, thereby enabling it to accelerate the development of electronic solutions for the connected car;
- ■ZF, for the development of advanced seat-integrated safety solutions for various cockpit applications;
- ■Mahle, to develop innovative technologies for thermal management of the passenger compartment.
Faurecia acquires a majority interest in Chinese company Jiangxi Coagent Electronics Co. Ltd, renamed Faurecia Coagent Electronics S&T Co. Ltd, which develops integrated and innovative in-car infotainment solutions.
In November 2017, Faurecia terminates its Tier-1 US-listed ADR program launched in November 2012 on the over-the-counter (OTC) market. Each Faurecia ordinary share (listed on the NYSE Euronext Paris market) comprises two ADR shares.
- ■Accenture, one of the world’s leading consulting and technology companies, to develop connected on-board services for vehicles, as well as new tools based on artificial intelligence to improve Faurecia’s operational efficiency;
- ■FAW Group, one of China’s leading automakers, focusing on the development of Sustainable Mobility solutions and technologies for the Cockpit of the Future;
- ■HELLA, the lighting and electronics specialist, focusing on the development of innovative interior lighting solutions;
- ■finalizing its 100% acquisition of Parrot Faurecia Automotive;
- ■creating a new joint venture with Liuzhou Wuling Automotive Industry Co., Ltd (China’s leading automotive parts supplier);
- ■investing in the French HumanFab center (formerly ESP Consulting), an innovative laboratory which uses cognitive sciences to optimize human well-being and performance in different situations;
- ■acquiring 100% of Swiss company Hug Engineering, one of the market leaders in complete exhaust gas purification systems for very high power engines (over 750 hp);
- ■investing in French start-up Enogia to enhance its technological expertise in the field of energy efficiency;
- ■investing in Powersphyr, a Silicon Valley-based start-up, to accelerate its solutions for a user-friendly, connected Cockpit of the Future.
2019. Faurecia consolidates its expansion in the field of new technologies with the acquisition of 100% of the Japanese company Clarion Ltd. and the creation of a fourth activity “Faurecia Clarion Electronics” dedicated to electronics and software within the cockpit.
- ■acquires all of the Chinese company Faurecia Coagent Electronics S&T Co.;
- ■acquires a majority interest in the Swedish company Creo Dynamics;
- ■invests in the Israeli company Guardknox;
- ■creates a 50/50 joint venture with the Portuguese company Aptoide;
- ■enters into partnerships with Japan Display Inc. to improve the digital experience of users inside the cockpit.
Faurecia and Michelin create a joint venture around Symbio, which brings together all Michelin and Faurecia hydrogen fuel cell activities. Symbio is held equally by Faurecia and Michelin.
Faurecia is creating a global center of expertise dedicated to the development of hydrogen storage systems at its R&D center in Bavans, France.
- ■the remaining 50% of its joint venture SAS with Continental. This joint venture has become a major player in the assembly and logistics of complex modules for vehicle interiors. This project enables Faurecia to extend its offering of system integration to all interior modules, as well as to its new product lines such as screens, electronics, sensors and thermal comfort;
- ■100% of IRYStec Inc., a Canadian start-up that developed the world’s first software platform using perception and physiology to optimize the display system within the cockpit, and consequently the user experience.
As part of the implementation of the Group’s carbon neutrality project, Faurecia has chosen Schneider Electric as its preferred partner to support the Group in achieving its carbon neutrality strategy by 2025 (scopes 1 and 2). Faurecia’s trajectory for scopes 1 and 2 has been validated by the Science Based Targets initiative according to the most demanding scenario of warming to 1.5°C, as well as the roadmap for scope 3 by 2030, which is considered ambitious and in line with current best practices.
2021. As part of the merger between PSA and FCA, in March 2021 Stellantis distributed the shares it held in Faurecia up to 39.3% of its capital. Following this distribution, Faurecia’s free float increased significantly to represent approximately 95% of its share capital as of December 31, 2021. Faurecia also successfully completed a first employee shareholding plan for 2% of the capital stock, raising employee shareholding to more than 2.6% of the capital stock.
Faurecia is committed to a major and transformative external growth transaction. Faurecia took control of the German equipment manufacturer HELLA, by acquiring 60% of the share capital of HELLA from the shareholder family pool and 19.5% of the share capital following the voluntary takeover bid launched with all HELLA shareholders. The acquisition transaction, including the settlement-delivery of the public offer, took place on January 31, 2022. This transaction enables the Combined Group to become the world’s 7th largest automotive supplier.
In 2021, Faurecia carried out the following transactions to support its strategy focused on the Cockpit of the Future and Sustainable Mobility:
- ■development of partnerships with Renault, SAIC and Air Liquide in the field of hydrogen;
- ■the acquisition of (i) a majority interest in CLD, one of the main Chinese manufacturers of hydrogen tanks, (ii) the intellectual property assets of uMist Ltd, a Swedish start-up specializing in biomimetic spraying technology, (iii) designLed, a Scottish company specializing in advanced backlighting technologies, thus strengthening its display technology offering and enriching its immersive experiences, and (iv) a 50% stake in Beijing BAIC DAS Automotive System Co., main supplier of seats for BAIC Hyundai;
- ■the sale of the Acoustics and Soft Trim (AST) division to the Adler Pelzer group;
- ■the construction of a new 4.0 industrial platform in Allenjoie (Bourgogne-Franche Comté region), which will eventually accommodate more than 750 people and will produce seats, sophisticated emission reduction solutions and hydrogen storage systems.
From a sustainable development standpoint, Faurecia has continued and accelerated its approach to carbon neutrality by setting up partnerships with Palantir Technologies Inc., Engie (to support the deployment of an energy efficiency program in Europe, China, Brazil and Mexico to reduce site consumption by 15%), Schneider Electric (for off-site energy production) and KPMG (for on-site energy production). The Group has also secured from the Swedish steel company SSAB the supply of a steel developed without fossil fuels and with a very low CO2 footprint. This partnership makes Faurecia the first automotive supplier to explore fossil-free steel and marks a major step forward in its ambition to become CO2 neutral.
2022. The major event of the year was the finalization of the acquisition of a majority interest in HELLA GmbH & Co. KGaA. As of the date of this Universal Registration Document, Faurecia holds 81.6% of HELLA shares for a total investment (cash and shares) of €5.4 billion.
To seal the merger of Faurecia and HELLA, which together form the seventh-largest automotive supplier in the world, the two companies created the FORVIA brand. The Combined Group presented at its Capital Market Day its new medium-term strategic plan, Power25, aimed at generating profitable growth, strengthening cash generation and accelerating the Group’s debt reduction.
- ■a capital increase with preferential subscription rights in the amount of €705 million, including the issue premium, carried out in June 2022;
- ■the issue of senior bonds linked to sustainable development in the amount of €700 million.
As part of the FORVIA Group’s €1 billion asset disposal program to be completed by the end of 2023, HELLA sold its 33.33% stake in HBPO to its co-shareholder Plastic Omnium for €290 million.
The Group also continued and strengthened its sustainable development strategy, aiming to become CO2 neutral in industrial operations by 2025:
- ■Two major electricity purchase contracts were signed, setting up an 85.8 MW Swedish Rodene wind project in Alingsas, in partnerships with Octopus Energy Generation and Mirova Eurofideme 4, with the support of Schneider Electric, and a 15-year solar energy project was launched with ENGIE and EDP to equip more than 150 sites across 22 countries with solar panels.
- ■Faurecia also announced the creation of MATERI'ACT, a new entity focused on sustainable materials, with expected revenue of more than €2 billion in 2030 and a team of 400 people by the end of 2025.
In June, the Group had its roadmap for “net zero emissions” validated by the Science Based Target initiative (SBTi). Faurecia and HELLA will reach zero net emissions by 2045 - a target corresponding to SBTi’s most ambitious standard. Only 20 companies worldwide have had their net zero emission commitment approved to date.
In September, Faurecia joined the Euronext CAC 40 ESG® index, which includes the 40 CAC® Large 60 companies that have demonstrated best environmental, social and governance (ESG) practices.
The Group is accelerating and supporting its hydrogen strategy with the following development projects:
- ■Faurecia will equip the truck fleet supplied by MAN for the Bavarian region with complete hydrogen storage systems;
- ■Faurecia, Symbio and Michelin have been selected by the California Energy Commission for the development of a hydrogen truck through the “Symbio H2 Central Valley Express” project;
- ■Faurecia won a contract to supply high-capacity hydrogen storage systems to supply charging stations located in the "Zero Emission Valley (ZEV)", the first French project for sustainable hydrogen mobility for professional fleets;
- ■signature of a partnership with HYVIA (joint venture between the Renault group and Plug) to supply new generation hydrogen storage systems for the mass production of the Renault Master H2-TECH, manufactured in France;
- ■the hydrogen activities of Faurecia, as well as those of Symbio (50/50 joint venture with Michelin), have been selected as being of common European interest by the European Commission as part of the “IPCEI Hy2Use” project aimed at supporting research and innovation, the first industrial deployment and the construction of relevant infrastructure in the hydrogen value chain.
6.4.Additional information on audits of financial statements
Audit of financial statements
In accordance with French company law, Faurecia’s Statutory Auditors certify the parent company and Group financial statements and review the situation of its significant consolidated subsidiaries through members of their networks.
For the 2022 fiscal year, Ernst & Young Audit received €7.8 million for its audit assignments; while Mazars also received €6.6 million for its audit assignments.
The table showing the breakdown of fees that Faurecia and its fully consolidated subsidiaries recognized in their 2022 financial statements for work assigned to the Statutory Auditors appears in Chapter 1 “Financial and accounting information”, Note 34 to Section 1.3.5 “Fees paid to the consolidated financial statements”.
Persons responsible for auditing the financial statements
|
Start date of the first corporate office |
Date of expiry of the term |
---|---|---|
Statutory Auditors |
|
|
Ernst & Young Audit represented by Mr. Jean-Roch VARON and Mr. Guillaume BRUNET-MORET member of the Versailles Regional Association of Statutory Auditors Tour First TSA 14444 92037 Paris La Défense Cedex France |
June 17, 1983 |
OGM in 2025 |
Mazars represented by Ms. Anne-Laure ROUSSELOU and Mr. Grégory DEROUET member of the Versailles Regional Association of Statutory Auditors Tour Exaltis 61, rue Henri Regnault 92400 Courbevoie France |
May 28, 2019 |
OGM in 2025 |
6.5.Declaration by the person responsible for the Universal Registration Document and the information officer
Person responsible for the Universal Registration Document
Patrick Koller
I hereby declare that the information contained in the Universal Registration Document is, to the best of my knowledge, in accordance with the facts and contains no omission likely to affect its import.
I further declare that, to the best of my knowledge, the financial statements have been prepared in accordance with the applicable accounting standards and give a true and fair view of the assets and liabilities, the financial position and the results of the Company and the consolidated companies making up the Group, and that the management report, for which the cross-reference table is shown on page 474, provides a true and fair picture of the changes in the business, the results and financial position of the Company and its consolidated companies, as well as a description of the main risks and uncertainties they face.
Information officer
Olivier Durand
6.6.Cross-reference tables
Cross-reference table with Annexes 1 and 2 of Delegated Regulation (EU) No. 2019/980 of the European Commission of March 14, 2019
In order to make this Universal Registration Document easier to understand, the cross-reference table below makes it possible to identify the key items of information required by Annexes 1 and 2 of Delegated Regulation No. 2019/980 of March 14, 2019.
Information |
Headings |
Sections |
---|---|---|
1 |
PERSONS RESPONSIBLE, INFORMATION FROM THIRD PARTIES, EXPERT REPORTS AND APPROVAL OF THE COMPETENT AUTHORITY |
|
1.1 |
Persons responsible for the information |
6.5 |
1.2 |
Statement by the persons responsible for the document |
6.5 |
1.3 |
Expert statement |
N/A |
1.4 |
Other statements if information comes from third parties |
N/A |
1.5 |
Statement on the document’s approval |
N/A |
2 |
STATUTORY AUDITORS |
6.4 |
3 |
RISK FACTORS |
2.1 |
4 |
INFORMATION ABOUT THE ISSUER |
|
4.1 |
Legal and commercial name |
6.1 |
4.2 |
Registration with the trade and companies register (RCS) and legal entity identifier (LEI) |
6.1 |
4.3 |
Date of incorporation and term |
6.1 |
4.4 |
Registered office – legal form – applicable legislation – website – other |
6.1 |
5 |
BUSINESS OVERVIEW |
|
5.1 |
Principal activities |
Introductory chapter; 1.1.1; 1.5 |
5.2 |
Principal markets |
Introductory chapter; 1.1 |
5.3 |
Important events |
Introductory chapter; 1.1; 1.5 |
5.4 |
Financial and non-financial strategy and objectives |
Introductory chapter; 1.1.2; 1.1.3; 1.2; 1.6.3, |
5.5 |
Level of dependence |
6.1; 2.1.1.3; 2.1.1.9 |
5.6 |
Competitive position |
Introductory chapter |
5.7 |
Investments |
|
5.7.1 |
Material investments made |
Introductory chapter; 1.1.6.2; 1.3.5, Notes 4, 11, 12A and 26.3; 1.5; 1.6.3, Note 17; 6.3 |
5.7.2 |
Ongoing material investments or firm commitments |
1.1.6.2; 1.3.3; 1.3.5, Notes 4, 11 and 12A |
5.7.3 |
Joint ventures and significant interests |
1.1.1.2; 1.3.6; 1.5; 1.6.5; 6.2; 6.3 |
5.7.4 |
Environmental impact of the use of property, plant and equipment |
4.2.5 |
6 |
ORGANIZATIONAL STRUCTURE |
|
6.1 |
Brief description of the Group/Organizational chart |
1.3.6; 1.6.5; 6.2 |
6.2 |
List of significant subsidiaries |
1.3.6; 1.6.5 |
|
|
|
7 |
OPERATING AND FINANCIAL REVIEW |
|
7.1 |
Financial position |
Introductory chapter, Chapter 1 |
7.1.1 |
Presentation of the development and performance of the business |
Introductory chapter; 1.1.3 to 1.1.5; 1.3.5, Note 4 |
7.1.2 |
Future changes and activities in research and development |
Introductory chapter; 1.1.1.2; 1.2; 1.3.5, Note 5.4 |
7.2 |
Net operating income |
Introductory chapter; 1.1.4 |
7.2.1 |
Significant factors |
1.1.1; 1.3.5, Note 2; 1.5 |
7.2.2 |
Significant changes in sales or net income |
1.1.3; 1.1.5; 1.3.5, Note 2; 1.5 |
8 |
CAPITAL RESOURCES |
|
8.1 |
Issuer’s capital |
1.3.4; 1.3.5, Note 22; 1.6.3, Note 15 |
8.2 |
Cash flows |
Introductory chapter; 1.1.6.2; 1.3.3; 1.3.5, Note 21 |
8.3 |
Borrowing requirements and funding structure |
1.1.6; 1.3.5, Note 26; 1.5 (financial structure and net debt); 1.6.3, Note 17 |
8.4 |
Restriction on the use of capital |
1.5; 1.3.5, Note 26; 1.6.3, Note 17 |
8.5 |
Anticipated sources of funds |
1.1.1.2; 1.3.5, Note 26; 1.6.3, Note 17 |
9 |
REGULATORY ENVIRONMENT |
|
9.1 |
Description of the regulatory environment and influencing exterior factors |
2.1.1.2; 2.1.1.11; 2.1.3.1; 6.1 |
10 |
TREND INFORMATION |
|
10.1 |
a) Main recent trends |
Introductory chapter; 1.1.1.2; 1.2 |
|
b) Significant change in the Group’s financial performance since the closing or a negative statement |
N/A |
10.2 |
Factor likely to have a material effect on the outlook |
Introductory chapter; 1.1.1.2; 1.2; 2.1 |
11 |
PROFIT FORECASTS OR ESTIMATES |
1.2 |
12 |
ADMINISTRATIVE, MANAGEMENT AND SUPERVISORY BODIES AND SENIOR MANAGEMENT |
|
12.1 |
Information on members of the Company’s administrative and management bodies |
3.1.2.2 |
12.2 |
Conflicts of interest or negative statement |
3.6 |
13 |
COMPENSATION AND BENEFITS |
|
13.1 |
Compensation and benefits paid or granted |
3.3 |
13.2 |
Provisions for pensions and other benefits |
1.3.5, Note 25 |
14 |
ADMINISTRATIVE AND MANAGEMENT BODIES WORKING METHODS |
|
14.1 |
Terms of office |
3.1.2.1; 3.1.2.2 |
14.2 |
Service contracts or appropriate statement |
3.8.3 |
14.3 |
Committees |
3.1.3.1; 3.1.4 |
14.4 |
Compliance with corporate governance rules |
3.4 |
14.5 |
Potential material impacts on and future changes in corporate governance |
3.1.2.5 |
15 |
EMPLOYEES |
|
15.1 |
Breakdown of employees |
Introductory chapter; 4.4.1; 4.4.8 |
15.2 |
Equity investments and stock options |
3.1.2.1; 3.1.2.2; 3.3.1.2.2.3; 3.3.1.2.3; 3.3.1.4.2; 4.4.6; 5.1.1; 5.2.4 |
15.3 |
Employee profit-sharing agreements |
3.3.3; 4.4.6; 5.2.4 |
|
|
|
16 |
MAJOR SHAREHOLDERS |
|
16.1 |
Breakdown of capital or appropriate statement |
5.1 |
16.2 |
Different voting rights or appropriate statement |
5.1; 6.1 |
16.3 |
Control of the issuer |
5.1; 6.1 |
16.4 |
Shareholders’ agreement |
6.1 |
17 |
RELATED-PARTY TRANSACTIONS |
|
17.1 |
Details of transactions |
1.3.5, Note 32 |
18 |
FINANCIAL INFORMATION CONCERNING THE ISSUER'S ASSETS AND LIABILITIES, FINANCIAL POSITION AND RESULTS |
|
18.1 |
Historical financial information |
|
18.1.1 |
Audited historical financial information |
1.3; 1.4; 1.6; 1.7; 6.1 |
18.1.2 |
Change of accounting reference date |
N/A |
18.1.3 |
Accounting standards |
1.3.5, Note 1; 1.6.3, Note 1 |
18.1.4 |
Change of accounting framework |
1.3.5, Note 1 |
18.1.5 |
Minimum content of audited financial information |
1.3; 1.6; 6.1 |
18.1.6 |
Consolidated financial statements |
1.3 |
18.1.7 |
Date of latest financial information |
1.3; 1.6 |
18.2 |
Interim and other financial information |
|
18.2.1 |
Quarterly or half-yearly financial information |
N/A |
18.3 |
Audit of historical annual financial information |
|
18.3.1 |
Audit report |
1.4; 1.7; 6.1 |
18.3.2 |
Other audited information |
N/A |
18.3.3 |
Unaudited financial information |
N/A |
18.4 |
Pro forma financial information |
|
18.4.1 |
Significant change in gross values |
N/A |
18.5 |
Dividend policy |
|
18.5.1 |
Description or negative statement |
1.3.5, note 35; 5.4.4; 6.1 |
18.5.2 |
Amount of dividend per share |
1.3.5, note 35; 5.4.3 |
18.6 |
Legal and arbitration proceedings |
1.3.5, Note 24; 2.1.3.2 |
18.7 |
Significant change in the issuer’s financial position |
1.1.1.2; 1.2; 1.3.5, note 2; 1.3.6, Note 2 |
19 |
ADDITIONAL INFORMATION |
|
19.1 |
Capital stock |
|
19.1.1 |
Amount of capital issued |
5.1.1 |
19.1.2 |
Shares not representing the capital |
N/A |
19.1.3 |
Treasury shares |
5.1.1; 5.3 |
19.1.4 |
Securities |
N/A |
19.1.5 |
Vesting conditions and/or any obligations |
N/A |
19.1.6 |
Option or agreement |
6.1 |
19.1.7 |
History of the capital stock |
5.1.1; 5.2.3 |
19.2 |
Memorandum and bylaws |
|
19.2.1 |
Registration and corporate purpose |
6.1 |
19.2.2 |
Existing share categories |
5.1.1 |
19.2.3 |
Provisions affecting a change in control |
6.1 |
|
|
|
20 |
MAJOR CONTRACTS |
|
20.1 |
Summary of each contract |
6.1 |
21 |
DOCUMENTS AVAILABLE |
|
21.1 |
Statement on documents available for consultation |
6.1 |
Cross-reference table on information required in the annual financial report
For ease of reading, the cross-reference table below identifies information in this Universal Registration Document that also appears in the annual financial report that listed companies are required to publish under Article L. 451-1-2 of the French Monetary and Financial Code and Article 222-3 of the AMF’s General Regulation.
No. |
Information |
Sections |
---|---|---|
1. |
Financial statements |
1.6 |
2. |
Consolidated financial statements |
1.3 |
3. |
Management report (minimum information within the meaning of Article 222-3 of the AMF General Regulation) |
See cross-reference table of the management report below |
4. |
Declaration by the persons responsible for the annual financial report |
6.5 |
5. |
Statutory Auditors’ reports on the parent company and consolidated financial statements |
1.4; 1.7 |
Cross-reference table on information required in the management report
For ease of reading, the cross-reference table below identifies information in this Universal Registration Document that makes up the management report (including the corporate governance report), pursuant to Article L. 225-100 of the French Commercial Code.
No. |
Information |
Reference texts |
Sections |
---|---|---|---|
1. |
GROUP SITUATION AND BUSINESS |
|
|
1.1 |
Situation of the Company during the past period and objective and exhaustive analysis of changes to the business, the results and the financial position of the Company and the Group, in particular its debt position, with regard to the volume and complexity of business |
Articles L. 225-100-1, I., 1°, |
Introductory chapter; 1.1.1 to 1.1.6; 1.2; 1.5; 1.6.3, Note 2 |
1.2 |
Key financial performance indicators |
Article L. 225-100-1, I., 2 |
Introductory chapter; 1.1.1 to 1.1.6; 1.2; 1.5 |
1.3. |
Key non-financial performance indicators relating to the specific business of the Company and the Group, in particular information relating to environmental and personnel issues |
Article L. 225-100-1, I., 2 |
4.1.1.2; 4.2.1.1; 4.2.2.1; 4.2.2.2; 4.2.4; 4.2.7; 4.3; 4.4.8 |
1.4. |
Significant events occurring between the closing date and the date on which the management report was prepared |
Articles L. 232-1, II. and |
1.1.1; 1.3.5, Notes 2 and 3; 1.6.3, Note 2 |
1.5. |
Identity of the main shareholders and holders of voting rights at General Meetings, and changes made during the financial year |
Article L. 233-13 Comm. Code |
5.1 |
1.6. |
Existing branches |
Article L. 232-1, II |
1.3.6 |
1.7. |
Significant equity investments in companies with their registered office in France |
Article L. 233-6 par. 1 |
1.3.5, Note 2; 1.6.5 |
1.8. |
Cross-shareholdings |
Articles L. 233-29, L. 233-30 and R. 233-19 Comm. Code |
N/A |
1.9. |
Foreseeable changes in the situation of the Company and the Group and future outlook |
Articles L. 232-1, II and |
1.2 |
1.10 |
Research and development activities |
Articles L. 232-1, II and |
Introductory chapter; 1.3.5, Notes 5.4 and 11 |
1.11 |
Table showing the Company’s results for each of the last five periods |
Article R. 225-102 |
1.6.4 |
1.12 |
Information on supplier and customer payment terms |
Article D. 441-4 Comm. Code |
1.5 |
1.13. |
Amount of inter-company loans granted and statement by the Statutory Auditor |
Articles L. 511-6 and |
N/A |
2. |
INTERNAL CONTROL AND RISK MANAGEMENT |
|
|
2.1 |
Description of the main risks and uncertainties facing the Company |
Article L. 225-100-1, I., 3 |
2.1 |
2.2 |
Information on the financial risks related to the effects of climate change and presentation of the measures taken by the Company to reduce them by implementing a low-carbon strategy in all aspects of its activity |
Article L. 22-10-35, 1 |
2.1.1.2; 4.2.1.2; 4.2.2; 4.2.4 |
2.3 |
Main characteristics of the internal control and risk management procedures implemented by the Company and the Group relating to the preparation and processing of accounting and financial information |
Article L. 22-10-35, 2 |
2.2 |
2.4 |
Information on the objectives and policy regarding the hedging of each main category of transactions and on exposure to price, credit, liquidity and cash risks, including the use of financial instruments |
Article L. 225-100-1., 4 |
1.3.5, Note 30; 1.6.3, Note 21; 2.1.2; |
2.5 |
Anti-corruption system |
Law No. 2016-1691 of December 9, 2016 known as “Sapin II” |
2.2.2.4 et 2.2.2.5 |
2.6 |
Vigilance plan and report on its effective implementation |
Article L. 225-102-4 |
2.1.3.3; 4.1.3; 4.3.4 |
|
|
|
|
3. |
CORPORATE GOVERNANCE REPORT |
|
|
Compensation information |
|
|
|
3.1 |
Compensation policy for corporate officers |
Articles L. 22-10-8, I., paragraph 2 and R. 22-10-14 Comm. Code |
3.3 |
3.2 |
Compensation and all benefits paid during the financial year or allocated for the financial year to each corporate officer |
Articles L. 22-10-9, I., 1 and R. 22-10-15 Comm. Code |
3.3.1; 3.3.2 |
3.3 |
Relative proportion of fixed and variable compensation |
Article L. 22-10-9, I., 2 |
3.3.1 |
3.4 |
Use of the option to request the return of variable compensation |
Article L. 22-10-9, I., 3 |
N/A |
3.5 |
Commitments of any kind made by the Company for the benefit of its corporate officers, corresponding to elements of compensation, indemnities or benefits due or likely to be due as a result of the assumption, termination or change of their duties or after the exercise of these |
Article L. 22-10-9, I., 4 |
3.3.1; 3.3.4 |
3.6 |
Compensation paid or allocated by a company included in the scope of consolidation within the meaning of Article L. 233-16 Comm. Code |
Article L. 22-10-9, I., 5 |
N/A |
3.7 |
Ratios between the level of compensation of each executive corporate officer and the average and median compensation of employees of the Company |
Article L. 22-10-9, I., 6 |
3.3.1.3 |
3.8 |
Annual change in compensation, Company performance and average Company employee compensation and the above-mentioned ratios over the five most recent periods |
Article L. 22-10-9, I., 7 |
3.3.1.3 |
3.9 |
Explanation of how the total compensation complies with the adopted compensation policy, including how it contributes to the long-term performance of the Company and how the performance criteria were applied |
Article L. 22-10-9, I., 8 |
3.3.1 |
3.10 |
Method of taking into account the vote of the last Ordinary General Meeting provided for in I of Article L. 22-10-34 Comm. Code |
Article L. 22-10-9, I., 9 |
3.3.4 |
3.11 |
Deviation from the procedure for implementing the compensation policy and any exceptions |
Article L. 22-10-9, I., 10 |
3.3.1 |
3.12 |
Application of the provisions of the second paragraph of Article L. 225-45 (suspension of payment of compensation to directors in case of non-compliance with gender equality on the Board of Directors) |
Article L. 22-10-9, I., 11 |
N/A |
3.13 |
Allocation and retention of options by corporate officers |
Articles L. 225-185 and |
3.3.1.4.1; 3.3.1.4.2 |
3.14 |
Allocation and retention of free shares to executive corporate officers |
Articles L. 225-197-1 and |
3.3.1.2.2.3; 3.3.1.2.3; 3.3.1.4.2; 3.3.4.1.3 |
Governance information |
|
|
|
3.15 |
List of all mandates and functions exercised in any company by each of the corporate officers during the period |
Article L. 225-37-4, 1 |
3.1.2.2 |
3.16 |
Agreements entered into between an officer or a significant shareholder and a subsidiary |
Article L. 225-37-4, 2 |
N/A |
3.17 |
Table summarizing the current delegations of authority granted by the General Meeting to increase the capital |
Article L. 225-37-4, 3 |
5.2.1 |
3.18 |
Modalities of the Executive management |
Article L. 225-37-4, 4 |
3.1.2.4 |
3.19 |
Members, conditions for the preparation and organization of the work of the Board of Directors |
Article L. 22-10-10, 1 |
3.1.3 |
3.20 |
Application of the principle of balanced representation of women and men on the Board |
Article L. 22-10-10, 2 |
3.1.2.5 |
3.21 |
Any limitations that the Board places on the powers of the Chief Executive Officer |
Article L. 22-10-10, 3 |
3.1.2.4; 3.1.3.3 |
3.22 |
Reference to a Corporate Governance Code and application of the comply or explain principle |
Article L. 22-10-10, 4 |
Chapter 3 (introductory paragraph); 3.4 |
3.23 |
Procedures for shareholder participation in the General Meeting |
Article L. 22-10-10, 5 |
6.1 |
3.24 |
Assessment procedure for current agreements - Implementation |
Article L. 22-10-10, 6 |
3.8.2 |
3.25 |
Information likely to have an impact in the event of a public tender offer or exchange offer:
|
Article L. 22-10-11 |
6.1 |
4. |
CAPITAL STOCK AND SHAREHOLDING STRUCTURE |
|
|
4.1 |
Structure, change in the Company’s share capital and crossing of thresholds |
Article L. 233-13 |
5.1.1; 5.1.2; 5.2.3 |
4.2 |
Acquisition and disposal by the Company of its own shares |
Articles L. 225-211 and |
5.3 |
4.3 |
Statement of employee shareholding on the last day of the period (proportion of capital stock represented) |
Article L. 225-102, paragraph 1 Comm. Code |
5.1.1; 5.2.4 |
4.4 |
Statement of any adjustments for securities giving access to the capital stock in the event of share buy-backs or financial transactions |
Articles R. 228-90 and |
N/A |
4.5 |
Information on transactions by executives and related persons on the Company’s shares |
Article L. 621-18-2 Mon. |
3.5.2 |
4.6 |
Amounts of dividends distributed in respect of the three previous periods |
Article 243 bis of the French General Tax Code |
5.4.3 |
5. |
Non-Financial Performance Declaration (NFPD) |
|
|
5.1 |
Business model |
Articles L. 225-102-1 and |
Introductory chapter |
5.2 |
Description of the main risks ensuing from the Company’s or the Group’s business, including, when relevant and proportionate, risks generated by business relationships, products, or services |
Articles L. 225-102-1 and |
Chapter 2, 4.2.1.2; 4.3.1; 4.3.3.3; 4.3.4 |
|
|
|
|
5.3 |
Information about how the Company or the Group takes into account the social and environmental consequences of its business, the impacts of its business on human rights and the fight against corruption and tax evasion (description of the policies implemented and reasonable diligence procedures carried out in order to prevent, identify and mitigate the main risks linked to the Group’s or the Company’s business) |
Articles L. 225-102-1, III, |
4.1; 4.2; 4.3; 4.3.1.1; 4.3.1.3; 4.3.4 |
5.4 |
Results of the policies implemented by the Company or the Group, including key performance indicators |
Articles L. 225-102-1 and |
4.1; 4.2; 4.3; 4.4 |
5.5 |
Social information (employment, work organization, health and safety, social relationships, trainings, equality of treatment) |
Articles L. 225-102-1 and |
4.1; 4.4 |
5.6 |
Environmental information (general environment policy, pollution, circular economy, climate change) |
Articles L. 225-102-1 and |
4.1; 4.2 |
5.7 |
Societal information (societal commitments in favor of a sustainable development, subcontracting and suppliers, practices loyalty) |
Articles L. 225-102-1 and |
4.1; 4.3 |
5.8 |
Information on the fight against corruption and tax evasion |
Articles L. 225-102-1, |
4.3.1; 4.3.4 |
5.9 |
Information related to actions in favor of fundamental human rights |
Articles L. 225-102-1, |
4.3.1.3; 4.3.4 |
5.10 |
Specific information:
|
Article L. 225-102-2 |
N/A |
5.11 |
Collective Agreements executed within the Company and their impacts on the Company’s economic performance and employee labor conditions |
Articles L. 225-102-1, III and R. 225-105 Comm. Code |
4.3.1.3; 4.4; 4.4.4 |
5.12 |
Statement of the independent third party on the information contained in the NFPD |
Articles L. 225-102-1, III and R. 225-105-2 Comm. Code |
4.5 |
6. |
OTHER INFORMATION |
|
|
6.1 |
Additional tax information |
Articles 223 quarter and quinquies of the French General Tax Code |
N/A |
6.2 |
Injunctions or financial penalties for anti-competitive practices |
Article L. 464-2 Comm. Code |
N/A |
Cross-reference table on information constituting the Group’s Non-Financial Performance Declaration required by Article L. 225-102-1 of the French Commercial Code
Information |
|
Sections |
---|---|---|
Business model |
|
Introductory chapter |
Description of the main risks ensuing from the Company’s or the Group’s business, including, when relevant and proportionate, risks generated by business relationships, products, or services |
|
Chapter 2, Chapter 4, sections
|
Information about how the Company or the Group takes into account the social and environmental consequences of its business, the impacts of its business on human rights and fight against corruption (description of the policies implemented and reasonable diligence procedures carried out in order to prevent, identify and mitigate the main risks linked to the Group’s or the Company’s business) |
|
Chapter 4, sections
|
Results of the policies implemented by the Company or the Group, including key performance indicators |
|
Chapter 4, sections
|
Social information (employment, work organization, health and safety, social relationships, trainings, equality of treatment) |
|
Chapter 4, sections
|
Environmental information (general environment policy, pollution, circular economy, climate change) |
|
Chapter 4, sections
|
Societal information (societal commitments in favor of a sustainable development, subcontracting and suppliers, practices loyalty) |
|
Chapter 4, sections
|
Information related to the fight against corruption |
|
Chapter 4, sections
|
Information related to actions in favor of fundamental human rights |
|
Chapter 4, sections
|
Specific information:
|
|
N/A |
|
|
|
Collective agreements concluded within the Company and their impact on the Company’s economic performance as well as on employees ’working conditions |
|
Chapter 4, sections
|
Report by the independent third-party |
|
Chapter 4, section
|