URD 2023
-
1Financial
and accounting information1.1.Review of the Group's business and consolidated results
1.1.1.Events of the financial year
1.1.1.1.Notable facts
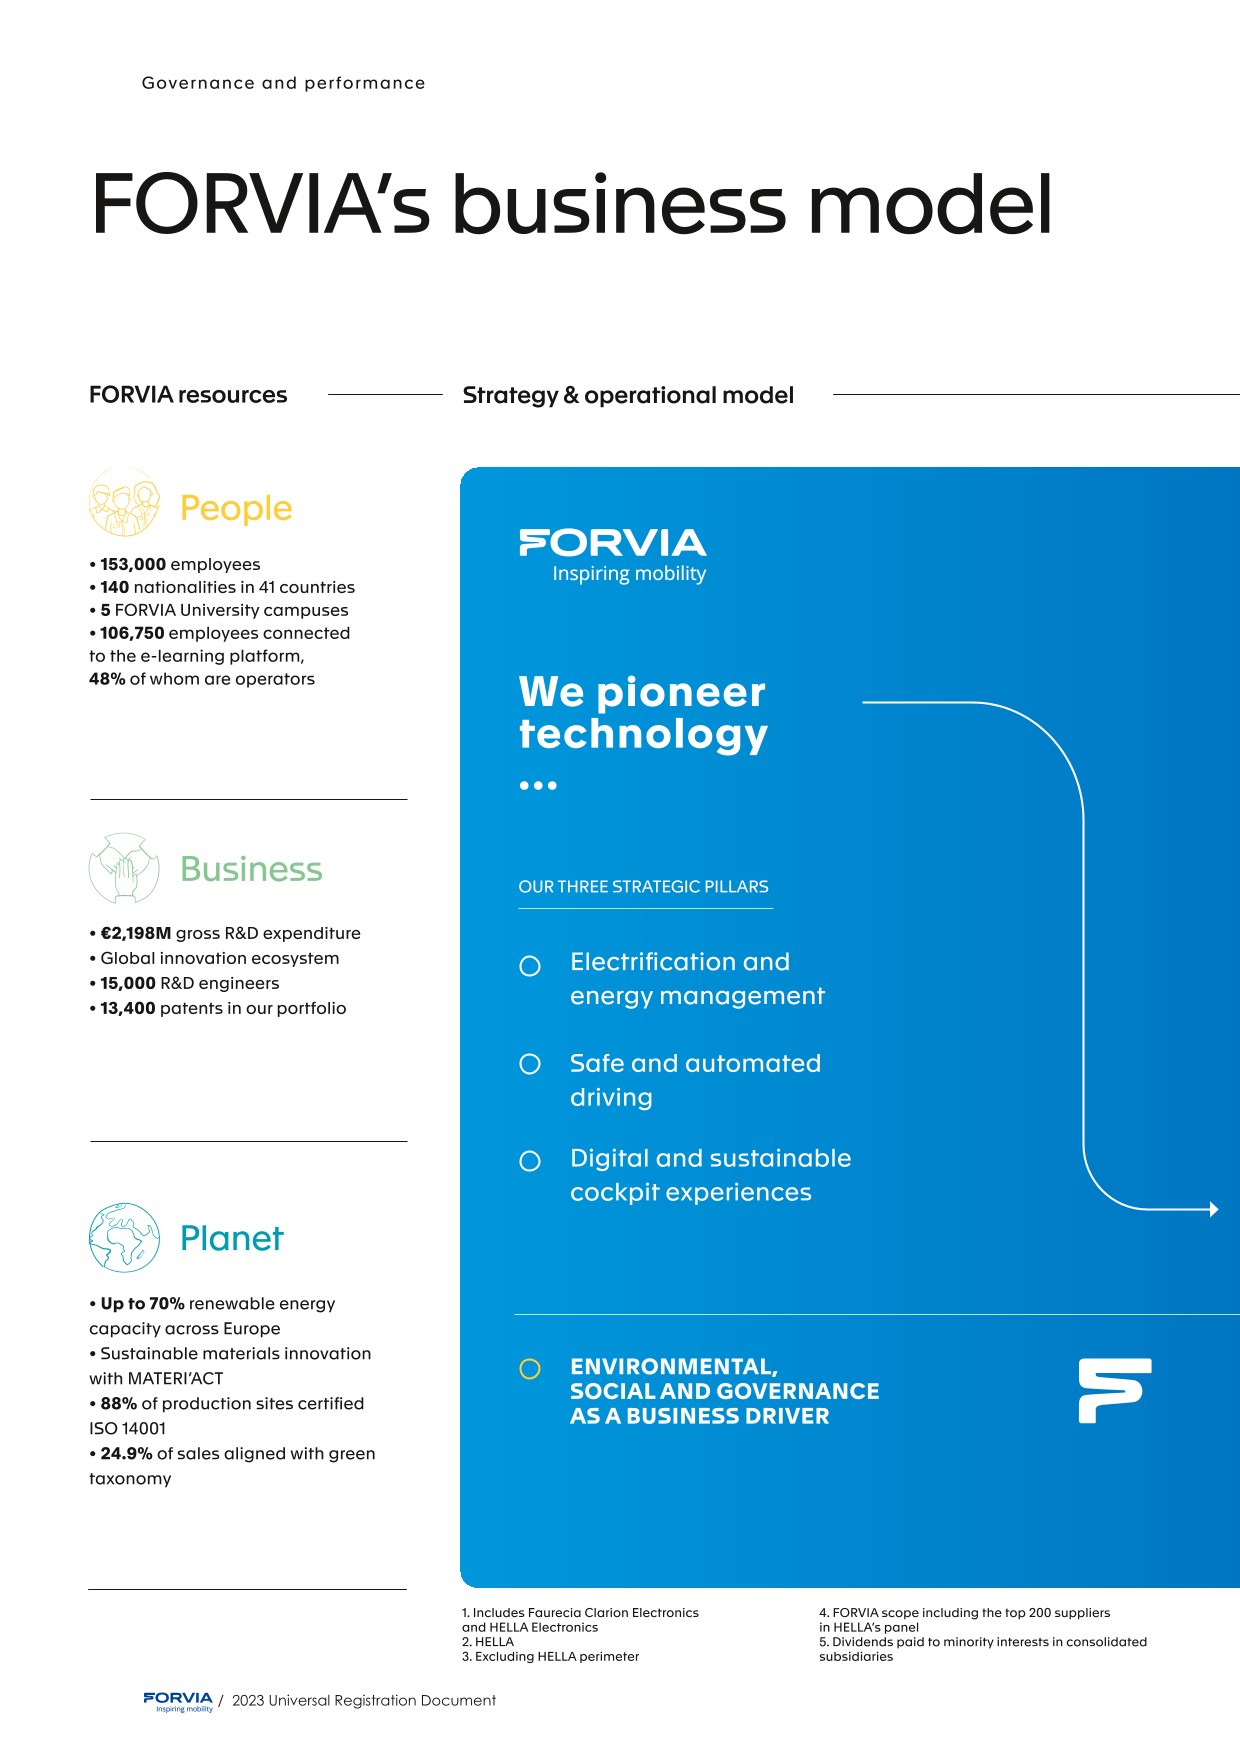
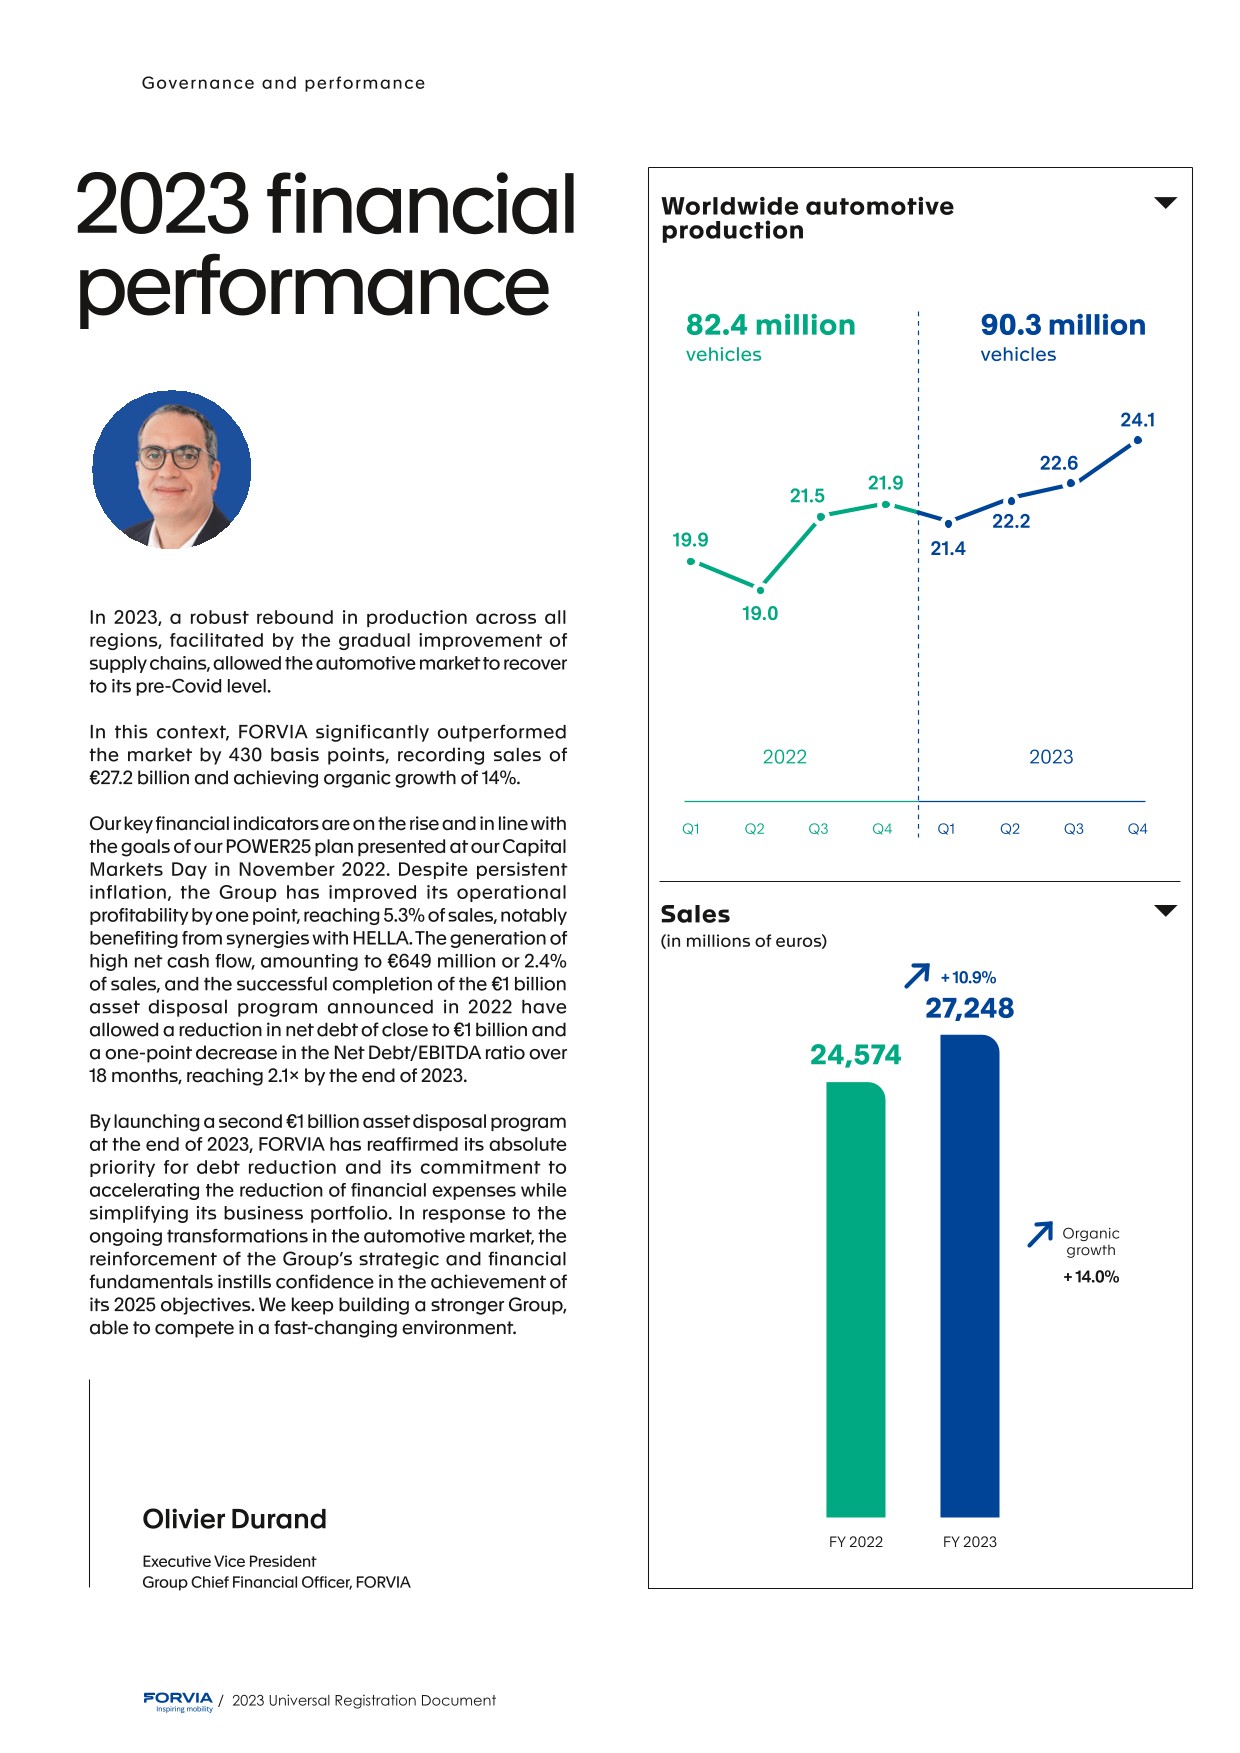
The worldwide automotive production showed strong dynamics in 2023 with a global production of 90.3 million light vehicles, corresponding to a 9.7% growth year on year. The market was supported by a very robust global demand and the progressive normalization of semi-conductor’s supply. The 2023 level exceeded the c. 89 million light vehicle production reached in 2019 (pre-Covid level), but with a different regional mix: in 2023, China represented 32% of worldwide light vehicle production (vs. 27% in 2019) and Europe represented 20% (vs. 24% in 2019).
Consistently with its early 2023 announcements, FORVIA has concluded its disengagement from Russia, with the sale of its three operating entities (Faurecia Environmental solutions‑Russia, Faurecia Automotive Solutions, Faurecia Interior Togliatti) in December 2023, after having obtained the necessary regulatory authorizations from the Russian administration. FORVIA have no operational activities in Russia since end of December 2023.
The impact of cost inflation has however persisted during the year 2023; compared to 2022, which predominantly caused by increase in raw material prices, cost inflation in 2023 mainly related to energy, labor and, to a lesser extent, raw material prices (some of them starting to go down).
During 2023, FORVIA signed and closed agreements finalizing the €1 billion first disposals program initiated in 2022 :
- ■the sale of the SAS Cockpit Modules division to the Motherson group for a value of €540 million (see Note 2.1);
- ■the sale of part of its exhaust after‑treatment business for commercial vehicles to the Cummins group for a value of €199.2 million (see Note 2.2);
- ■the sale of part of its stake in Symbio to Stellantis for a value of €150 million. Upon closing of this transaction FORVIA, Michelin and Stellantis will be equal partners in Symbio.
- ■the sale of HELLA BHTC shares for a total enterprise value of €600 million (€300 million for each of the two co-owners).
In August and November 2023, FORVIA’s corporate ratings assigned by S&P (BB), Moody’s (Ba2) and Fitch (BB+) were reaffirmed and the outlook was raised from “negative” to “stable” by the three rating agencies.
The Group’s financial debt stood at €6,987 million at December 31, 2023 compared to €7,939 million at December 31, 2022. The €952 million decrease in the net debt mainly stems from the positive net cash flow evolution, the disposals that took place in 2023 and other elements.
In accordance with IFRS 5, “net income of discontinued operations” presented in the consolidated statement of comprehensive income amounted to €-5.4 million including the operations of the SAS business from January 1, 2023 to July 31, 203 for total sales of €593.6 million as well as the net loss on disposal related to this activity of €-6.3 million and the directly incrementable expenses related to the sale.
The accounting principles and methods applied to discontinued operations are identical to those used for the annual financial statements.
MSCI leading ESG rating agency upgraded FORVIA’s rating from “BBB” to “A”. The agency welcomes positive evolution in the governance, specifically the alignment of the Board structure with investor’s interests. MSCI also highlights the entry in the Lighting business which has intrinsically lower exposure to product liability risks than other products in the auto supplier sector. After the previous upgrade from “BB” to “BBB” obtained in July 2022, this new step underlines the Group’s constant progress on ESG topics and now ranks FORVIA within the first quartile of the MSCI 32 auto components manufacturers universe.
1.1.1.2.Main events
January 2023
- ■FORVIA has successfully priced the New Notes, sustainability-linked 7.25% senior notes due 2026 (the “New Notes”) following a private placement arranged by BNP Paribas. FORVIA priced the New Notes at 101.75% of par, or a yield of 6.65%.
February 2023
- ■As announced in January FORVIA has issued on February 1, 2023 €250 million of New Notes, sustainability-linked 7.25% senior notes due 2026. The proceeds of the issuance of the New Notes will be used to fully reimburse the Bridge-to-Bond and the Bridge-to-Equity in connection with the HELLA acquisition and for general corporate purposes.
- ■FORVIA has entered in February 2023 into exclusive negotiations with Cummins for the potential sale of a part of its Commercial Vehicle exhaust aftertreatment business. The potential transaction would be subject to customary conditions precedents, including regulatory approvals and completion of applicable employee representative consultations.
- ■FORVIA has announced mid-February 2023 to have signed with the Motherson group an agreement by which Motherson commits to acquire FORVIA SAS Cockpit Modules division (assembly and logistics services), reported as part of its Interiors Segment, for an enterprise value of €540 million. The transaction will be subject to customary conditions precedents, including regulatory approvals.
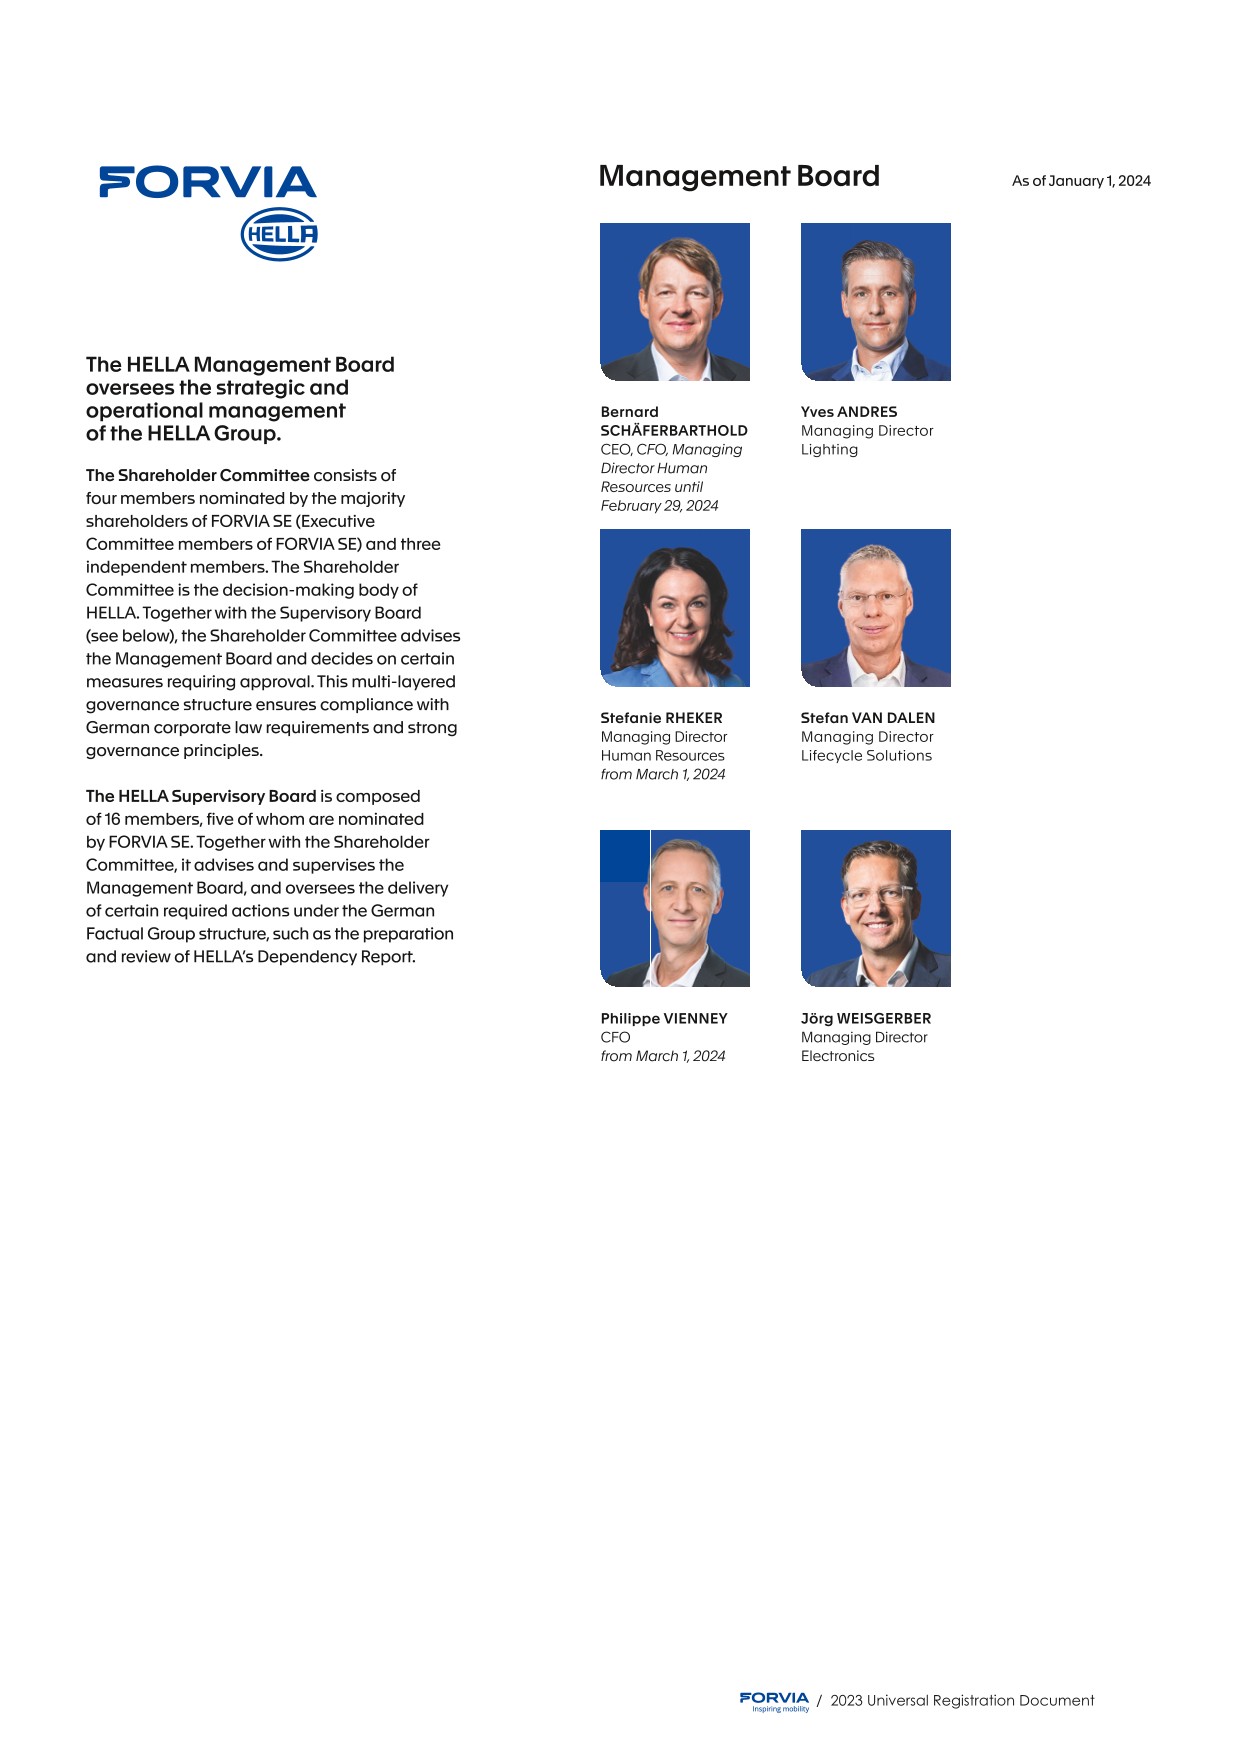
- ■HELLA has appointed Jörg Weisgerber and Stefan van Dalen, two executives from its own ranks, to the Management Board. Jörg Weisgerber is taking over from Björn Twiehaus as head of HELLA’s electronics business on April 1. Stefan van Dalen is succeeding Dr. Lea Corzilius as new Managing Director Lifecycle Solutions also as of April 1. Jörg Weisgerber and Stefan van Dalen both joined HELLA back in 2016.
March 2023
- ■FORVIA has added to its operational capacity in the Americas with the opening of a new, state-of-the-art manufacturing facility in Monterrey, Nuevo León, Mexico. Featuring bioclimatic design principles to optimize energy efficiency and support the Group’s commitment to achieving carbon neutrality by 2045, the more than 33,500 square-meter facility will employ approximately 1,500 people and manufacture automotive seat structures, instrument panels, and center consoles aligned with industry megatrends in sustainability and light weighting.
April 2023
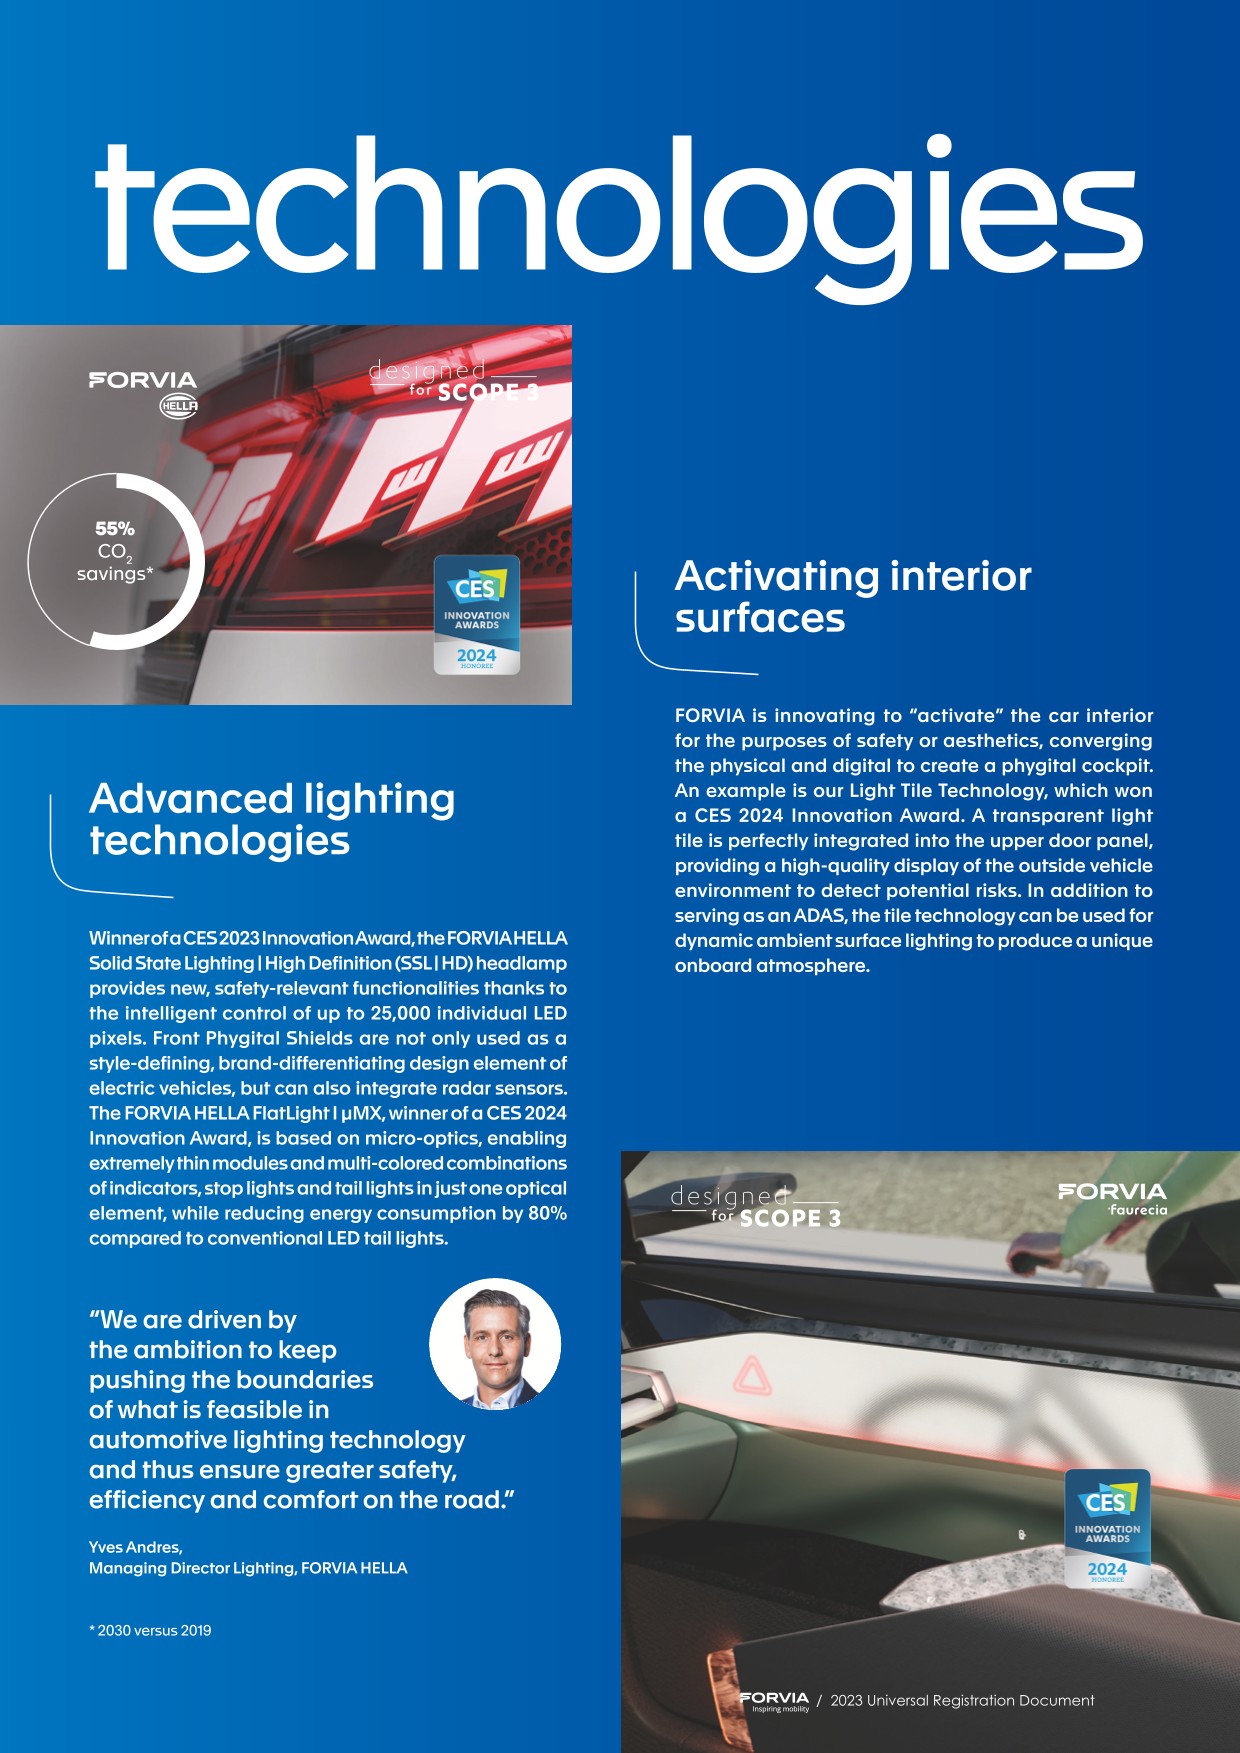
- ■Auto Shanghai 2023 – From electrification to captain chair: FORVIA displayed deep understanding of Chinese market. FORVIA showcased breakthrough technologies at Auto Shanghai, participating for the first time as the world’s 7th largest automotive technology supplier. FORVIA presented its new solutions developed for the Chinese market alongside its global state-of-the-art portfolio, including its award-winning Solid-State Lighting High-Definition headlamp (SSL | HD).
- ■FORVIA, attended Hannover Messe 2023, in Hannover, Germany alongside Symbio, its joint-venture created with Michelin. Two breakthrough hydrogen solutions for Automotive and Infrastructure in the European Market were showcased:
- ■containerized Hydrogen Storage: a lightweight storage solution aiming at drastically lowering the cost and CO2 footprint of transporting hydrogen, by storing c. 1 ton of H2 in the equivalent of a 40 feet container,
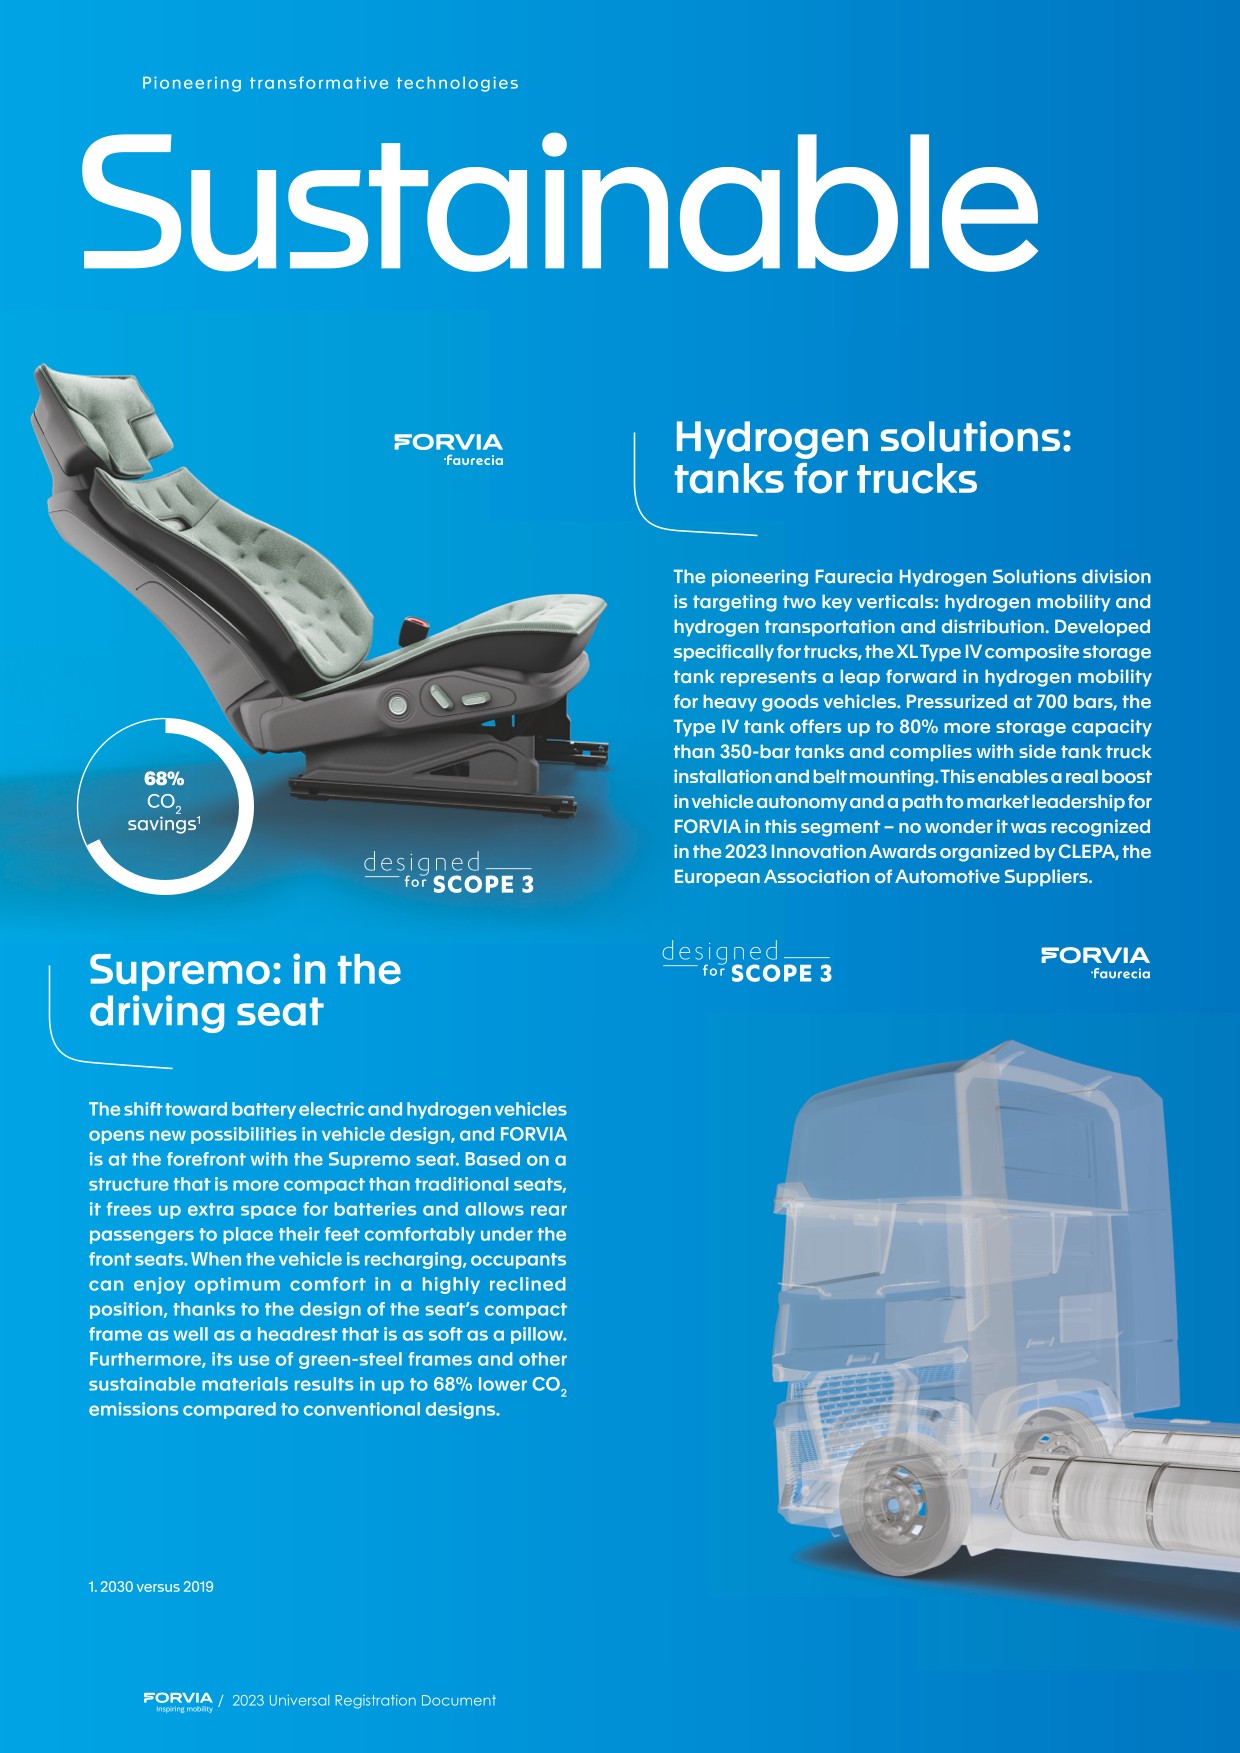
- ■XL Gaseous Storage: a new 700 bar tank for truck applications which increases hydrogen capacity by 80% vs current 350 bar solution and provides new vehicle integration opportunities.
May 2023
- ■FORVIA, Michelin and Stellantis have announced the signing of a binding agreement for Stellantis to acquire 33.3% stake in Symbio, a leader in zero-emission hydrogen mobility. FORVIA and Michelin will remain shareholders with 33.3% holding each.
- ■With the acquisition by Stellantis of a stake in Symbio (a joint venture between FORVIA and Michelin), confirmed in a joint press release by the three partners, FORVIA will receive a total amount of €150 million which will contribute to its €1 billion asset disposal program by the end of 2023. This asset disposal program includes two other operations already announced, representing together a cumulated enterprise value of almost €700 million:
- ■the sale of FORVIA’s SAS Cockpit Modules division (assembly and logistics services) to the Motherson group, announced on February 19, is currently subject to regulatory approvals and the closing is expected early Q3 2023,
- ■the sale of part of FORVIA’s commercial vehicle exhaust gas aftertreatment business in Europe and the United States, announced on February 16, is currently under exclusive and final negotiations with Cummins.
- These three operations are in addition to the two transactions already closed, the sale by FORVIA of its Interiors business in India to TAFE and the sale by HELLA of its stake in HBPO.
- FORVIA confirms it will deliver its €1 billion asset disposal program by the end of 2023. Those divestments contribute to FORVIA’s net debt reduction, its top priority following the acquisition of a majority stake in HELLA at the end of January 2022.
- ■FORVIA signed an agreement to transfer to Cummins a part of its commercial vehicle business in Europe and in the United States. Following an exclusive negotiations phase, FORVIA and Cummins have signed a Share and Asset Purchase Agreement under which FORVIA will sell a part of its commercial vehicle exhaust aftertreatment business in Europe and the US to Cummins for an enterprise value of €142 million after final technical adjustments.
- ■FORVIA boosts its renewable energy capacity to up to 70% across Europe with Renewable Power Capital deal. FORVIA continues to implement its decarbonization roadmap by signing a ten-year Power Purchase Agreement (PPA) with Renewable Power Capital. This deal is securing almost all the output from the 417 GWh, 24 wind turbines, Klevberget onshore farm in Sweden and will generate the equivalent of more than 40% of all FORVIA’s European yearly electric consumption. Building on existing deals, up to 70% of FORVIA’s consumption – 650 GWh – will be powered by renewable electricity thanks to a portfolio of 37 wind turbines. In addition to this capacity, 130 hectares of solar panels are being installed at more than 150 FORVIA sites, which provides up to 5% of its renewable energy mix.
- ■At the Shareholders’ Meeting of May 30, 2023, shareholders have renewed Denis Mercier as Board member for a period four years, and have appointed Esther Gaide and Dr Michael Bolle as Board members for a period four years. All three are considered as independent within the meaning of AFEP-MEDEF Code. Yan Mei and Dr Peter Mertens, whose terms of office expired at the close of this Shareholders’ Meeting, did not wish to be renewed.
June 2023
- ■The FORVIA Foundation joins forces with the Maud Fontenoy Foundation and Plastic Odyssey to protect the oceans. Through its Corporate Foundation, FORVIA, is extending its action to protect the environment by joining forces with the Maud Fontenoy Foundation and Plastic Odyssey, two renowned organizations dedicated to protecting marine biodiversity.
- ■FORVIA starts deliveries of hydrogen tanks from first mass production plant in France. Type IV Hydrogen tanks have started rolling out from FORVIA’s groundbreaking mass production plant in Allenjoie, France. This first-of-its-kind facility in Europe and North America aims to produce 100,000 tanks annually. With hydrogen as a driving force behind the decarbonization of mobility and industry, FORVIA is committed to delivering safe and affordable hydrogen storage technology.
July 2023
- ■FORVIA and BYD have launched the construction of a new state-of-the-art seat-assembly plant in the Rayong province of Thailand.
- This strategic leap strengthens the global technical partnership developed with Chinese electric vehicles manufacturer BYD, propelling both companies further into the Asia-Pacific market. The collaboration has already yielded impressive results, with seven cutting-edge factories established in China, including four within the past 18 months.
- ■HELLA, the automotive supplier operating under the umbrella brand FORVIA, and the luxury car manufacturer Porsche, have launched the world's first high-resolution headlamp based on matrix LED technology. With over 32,000 individually controllable pixels per headlamp, this agreement raises automotive lighting technology to a new level. The digital headlamp system SSL | HD is now available for the first time in the new Porsche Cayenne.
- ■FORVIA manufacturing sites received more than 80 supplier quality awards from customers around the world in the first six months of 2023. FORVIA sites received awards from a globally diverse range of customers located in Europe, Asia, and the Americas. The awards reflect a variety of Quality and Total Customer Satisfaction achievements including innovation, project support and development, problem solving, and response timing.
August 2023
- ■Motherson group has acquired 100% of “SAS” Cockpit Modules division (“SAS”), a global provider of assembly and logistics services for the automotive industry, based on an enterprise value of €540 million. Motherson is a diversified manufacturing specialist and one of the world’s leading automotive Group. The transaction complements its Modules and Polymer Products portfolio.
- ■In August 2023, FORVIA’s corporate ratings assigned by S&P (BB), Moody’s (Ba2) were reaffirmed and the outlook was raised from “negative” to “stable” by the two rating agencies
- ■FORVIA has confirmed the sale of part of its shareholding in Symbio to Stellantis, completed on July 27. It enabled Stellantis to acquire a stake alongside Michelin and FORVIA in the leading company for fuel cell mobility, with each shareholder holding 33.33%.
September 2023
- ■Five FORVIA Innovations were named Automotive News PACE and PACEpilot Finalists. FORVIA was honored to have five technologies selected as finalists for the 2023 Automotive News PACE and PACEpilot Awards. The PACE awards, now in their 29th year, are given to automotive suppliers in recognition of a technological innovation in product or process that have reached the commercial market. Automotive News had selected 34 finalists for the PACE award, including two FORVIA technologies:
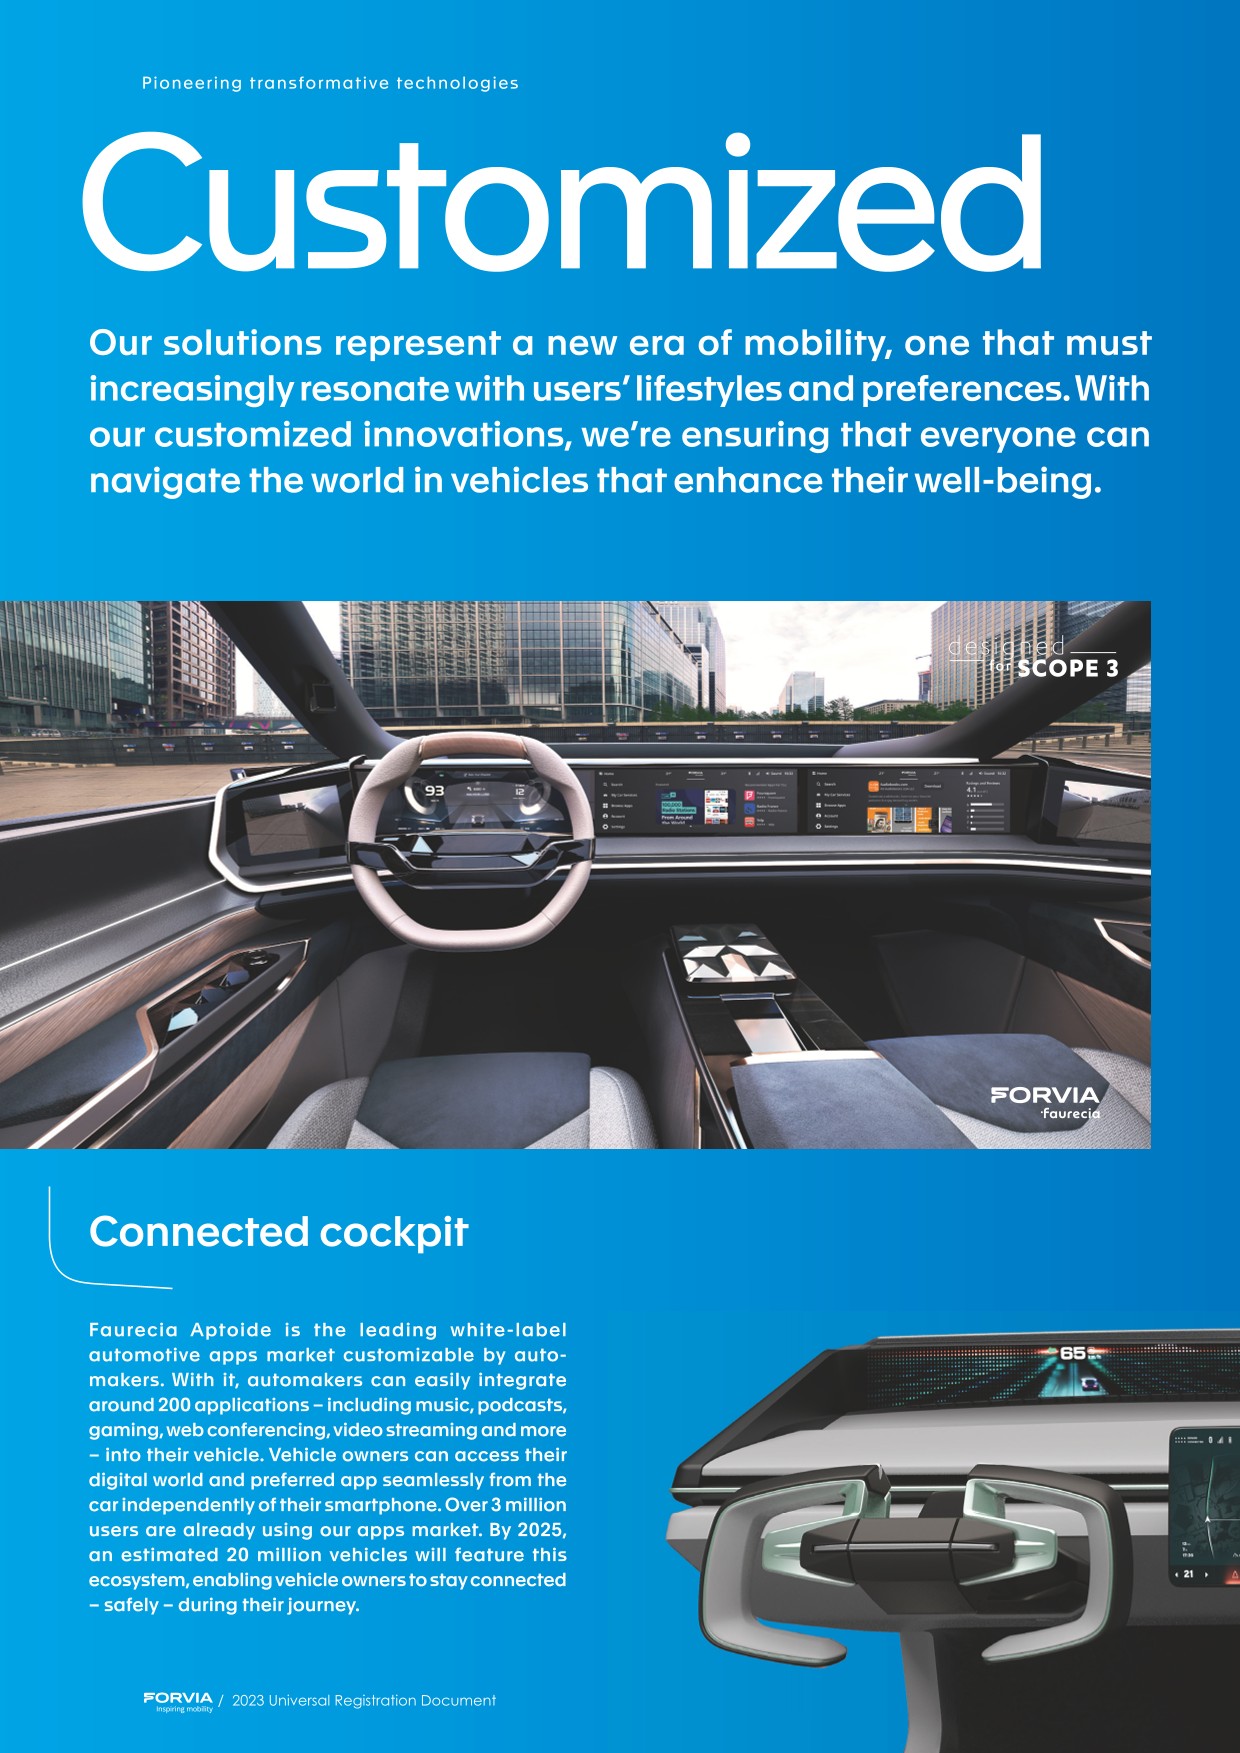
- ■FORVIA’s Immersive Display, a next-generation system that combines high and low-definition screen areas to create a seamless user experience, customizable to screen shapes and sizes,
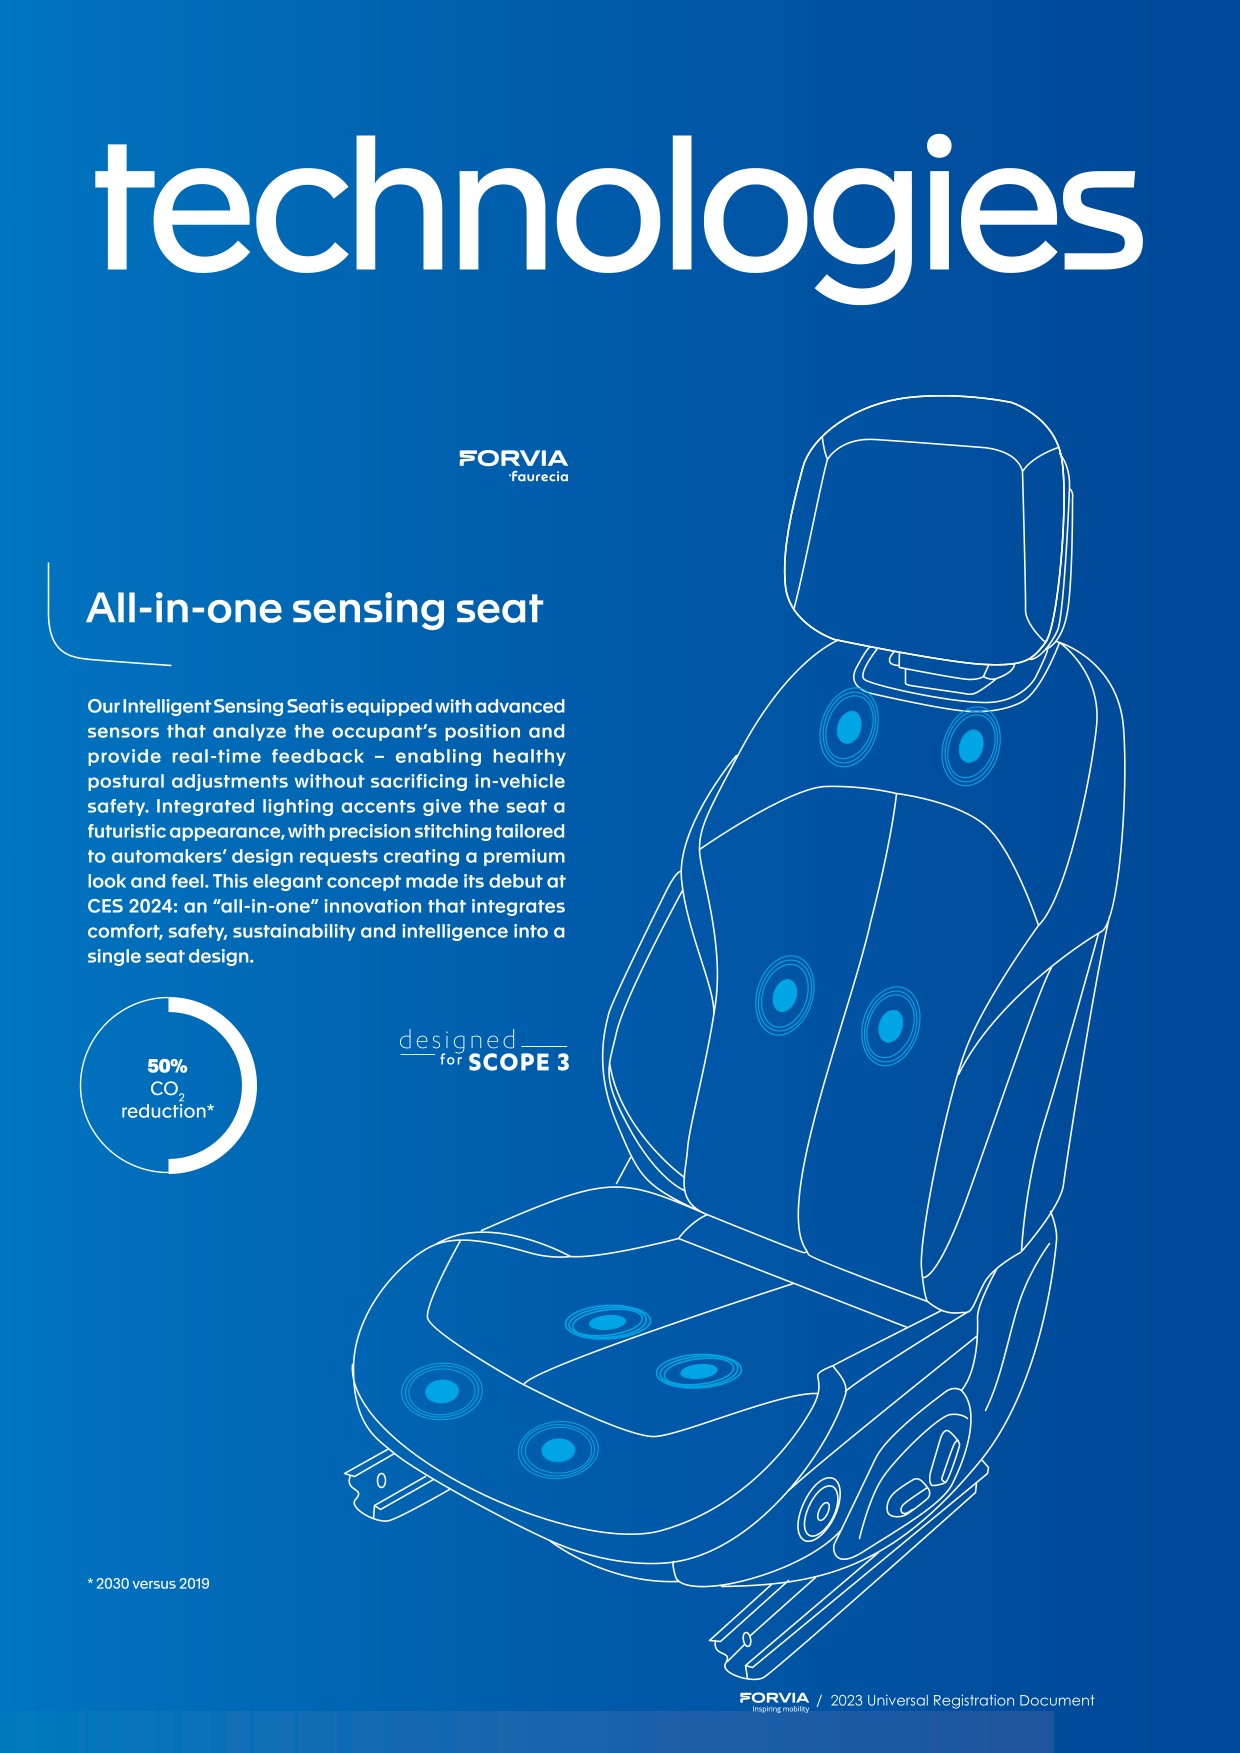
- ■FORVIA’s All-in-one seating innovation, where seat sensors can help identify potential physical pain.
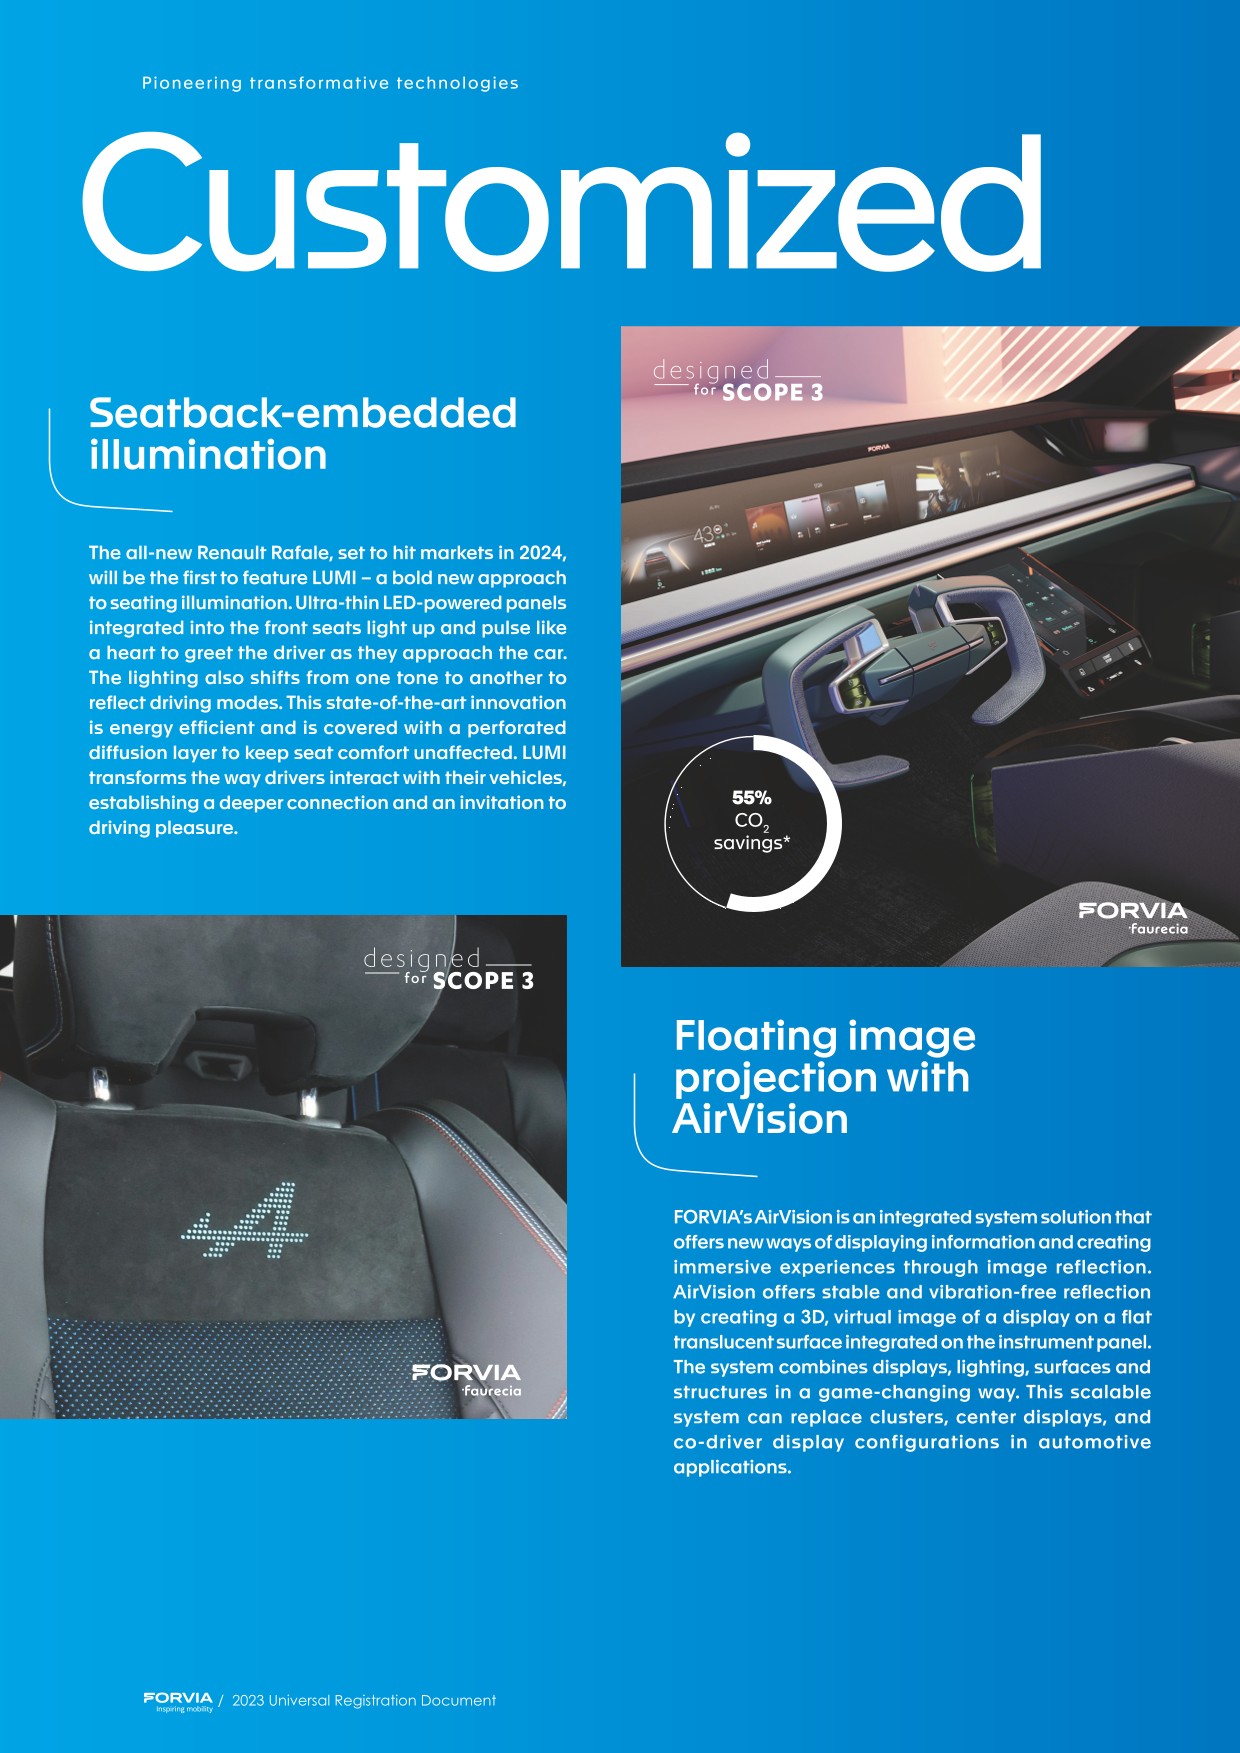
- ■FORVIA has announced two innovations showcased in the Esprit Alpine trim of the highly anticipated, All-new Renault Rafale. These groundbreaking technologies, LUMI and Ecorium, are set to transform the way drivers interact with their vehicles, adding enhanced style, emotional connection and sustainability to the driving experience.
- ■FORVIA has showcased its technology at AAI Mobility, Europe’s largest automotive trade show. It presented its technology portfolio in three strategic growth areas at the IAA Mobility 2023 in Munich: Electrification and energy management, safe and automated driving, and digital and sustainable cockpit experiences.
- ■FORVIA has unveiled the world premiere of a seat structure made from fossil-free steel, produced with a very low CO2 footprint, reduced by almost 90% compared to a traditional steel seat structure. This groundbreaking achievement, realized through a collaboration with leading Nordic-based steel manufacturer SSAB, marked a momentous stride towards sustainable innovation.
- ■On September 11, FORVIA and CHERY, the world-renowned large-scale automobile manufacturing enterprise, signed a strategic cooperation agreement in presence of Patrick Koller, CEO of FORVIA; Ma Chuan, China Deputy Executive Vice President, Yin Tongyue, Chairman of CHERY and Qi Shilong, Deputy General Manager at CHERY among other guests. Based on the strong business synergy and solid cooperation foundation, FORVIA and CHERY established a long-term strategic partnership and further deepened all-round cooperation, especially in the field of smart cockpits.
- ■Bernard Schäferbarthold, currently Chief Financial Officer of HELLA, will become the new Chairman of the Management Board. This was decided by the Shareholders' Committee of HELLA GmbH & Co. KGaA at its meeting on September 29. Bernard Schäferbarthold will take over the position on January 1, 2024 from Michel Favre, who has mutually agreed with the Shareholders' Committee on an early termination of his mandate.
October 2023
- ■FORVIA confirmed the successful completion of the transaction first announced on May 23, 2023 transferring designated parts of FORVIA’s commercial vehicle exhaust aftertreatment business in Europe and in the United States, for a total transaction value of €199.2 million, to its longstanding partner Cummins. The decision to transfer this business to Cummins was part of FORVIA’s strategy to focus on ultra-low emission solutions for light vehicles, where it is a leader in the market, and its hydrogen roadmap to bring a comprehensive portfolio of hydrogen storage solutions to market.
- ■HELLA, jointly with MAHLE, has announced the sale of their BHTC shares for a total enterprise value of €600 million (€300 million for each of the two co-owners). With the divestment of its stake in BHTC (accounted for by the equity method within HELLA’s accounts), HELLA will strengthen its focus on its core business areas: Electronics, Lighting and Lifecycle Solutions. The transaction is subject to approval by the relevant foreign trade and antitrust authorities and closing is expected to take place by mid-2024.
- ■At its meeting on 19 October 2023, the Board of Directors of FORVIA SE decided to coopt with immediate effect Nicolas Peter as an independent Board member. This cooptation follows Jürgen Behrend's resignation for personal reasons. Nicolas Peter is co-opted for the remainder of Jürgen Behrend's term of office, i.e., until the 2026 Annual General Meeting. Nicolas Peter worked for the BMW Group in various positions for more than three decades and was the chief financial officer and a member of the Board of Management from 2017 to May 2023. He has been chairman of the Board of Trustees of the BMW Foundation Herbert Quandt since 2020. Nicolas Peter serves also as a member of the German Government Commission for the German Corporate Governance Code (GCGC).
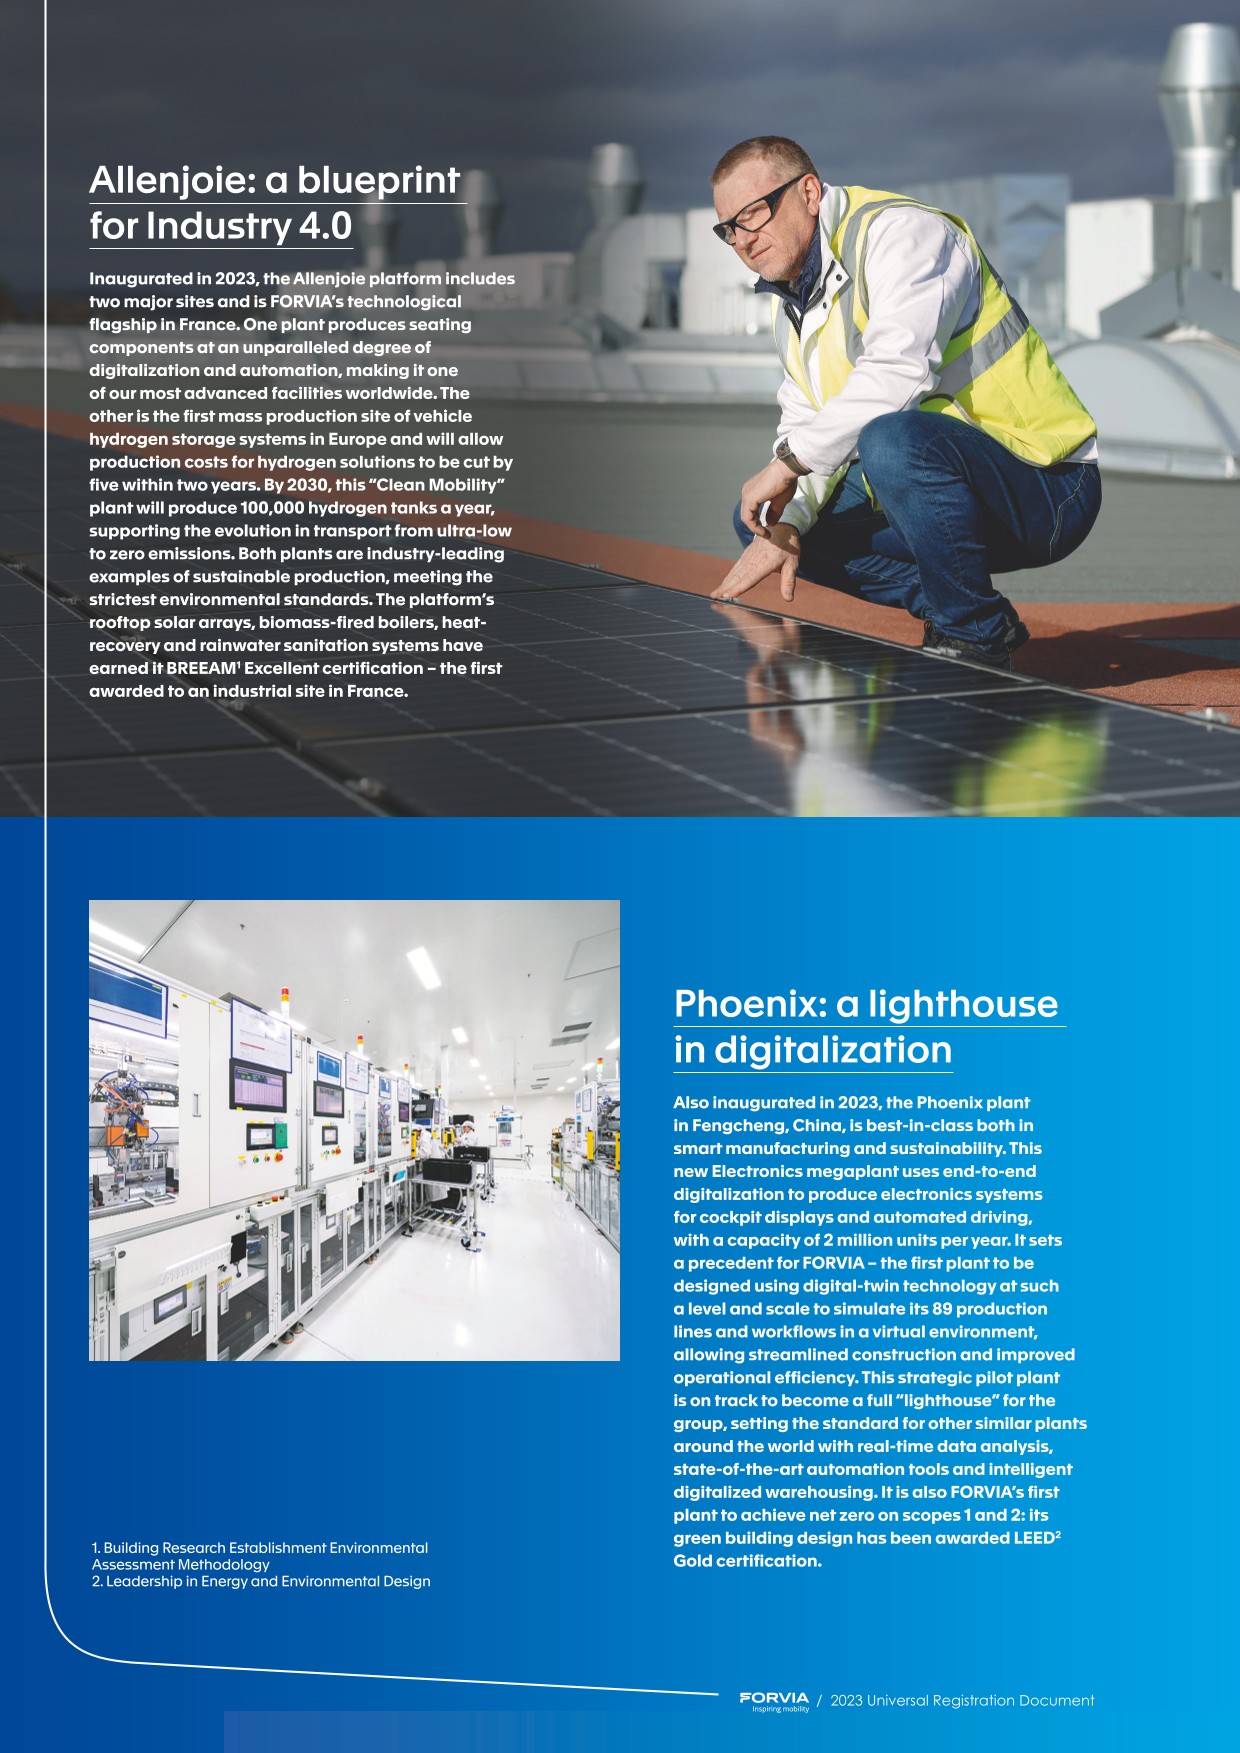
- ■FORVIA has officially inaugurated its industrial platform in Allenjoie (France) in the presence of Ms. Marie-Guite Dufay, President of the Bourgogne-Franche-Comté region, Mr. Franck Robine, Prefet of the region and Mr. Bruno Bonnell, Secretary General for Investments. Inaugurated in 2023, the Allenjoie platform includes two major sites and is FORVIA’s technological flagship in France. One plant produces seating components at an unparalleled degree of digitalization and automation, making it one of our most advanced facilities worldwide. The other is the first mass production site of vehicle hydrogen storage systems in Europe and will allow production costs for hydrogen solutions to be cut by five within two years. By 2030, this “Clean Mobility” plant will produce 100,000 hydrogen tanks a year, supporting the evolution in transport from ultra-low to zero emissions. Both plants are industry-leading examples of sustainable production, meeting the strictest environmental standards. The platform’s rooftop solar arrays, biomass-fired boilers, heat recovery and rainwater sanitation systems have earned it BREEAM Excellent certification – the first awarded to an industrial site in France.
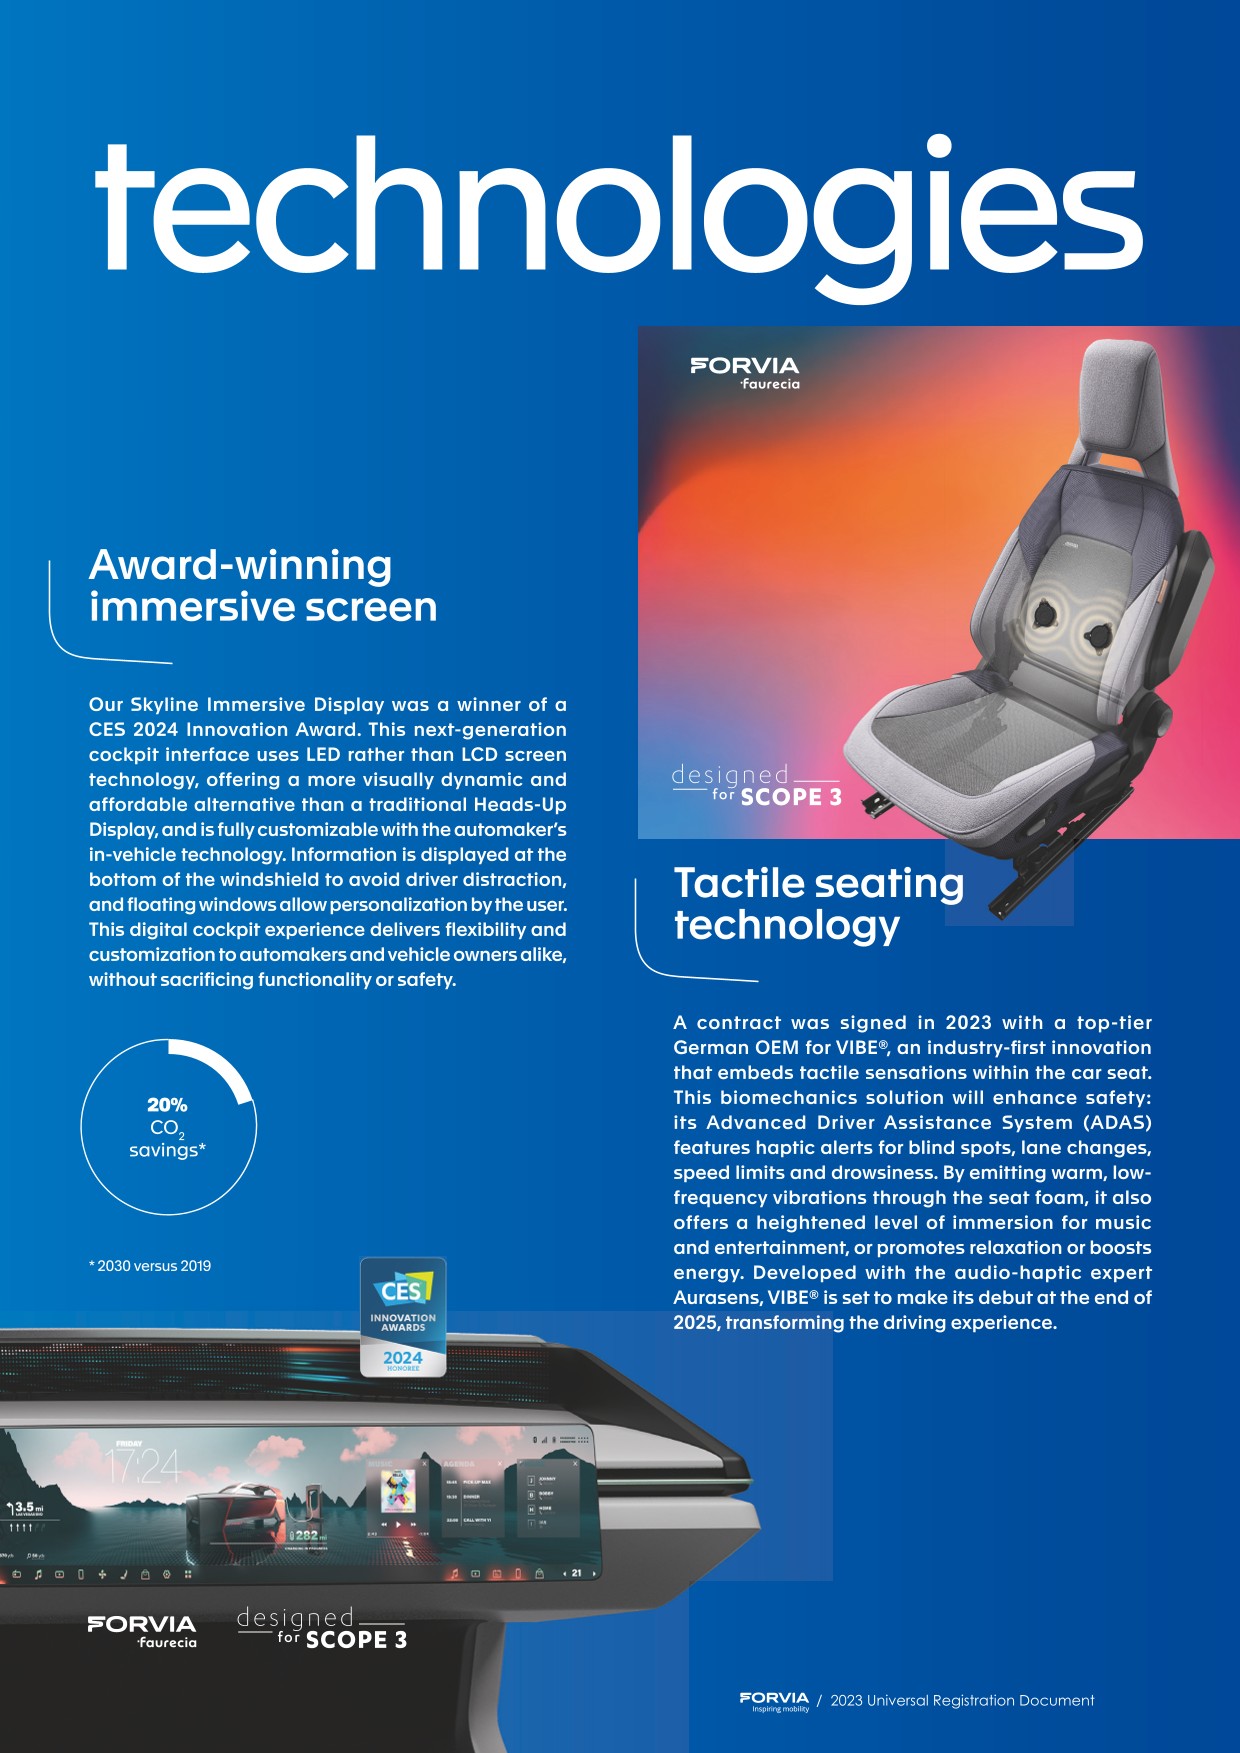
- ■FORVIA has concluded a groundbreaking contract with a premium German OEM to introduce VIBE®, its cutting-edge immersive technology that redefines consumers’ time behind the wheel. FORVIA’s VIBE® technology delivers an unparalleled and safe experience by embedding tactile sensations within the car seat, creating a fully-immersive journey. After five years of intensive research and development in collaboration with Aurasens, pioneers in vibro-haptic composition, VIBE® has been set to make its debut in a next-generation premium SUV end 2025.
- ■FORVIA received three accolades at the CLEPA Innovation Awards 2023. The European Association of Automotive Suppliers, CLEPA, has recognized FORVIA for its outstanding contributions to shaping the future of mobility. In the eighth edition of the international competition, with a focus on Digital and Green innovations, three technologies from different FORVIA Business Groups received an award from CLEPA:
- ■Automatic Diagnostics: a world’s-first strongly increasing vehicle repair efficiency,
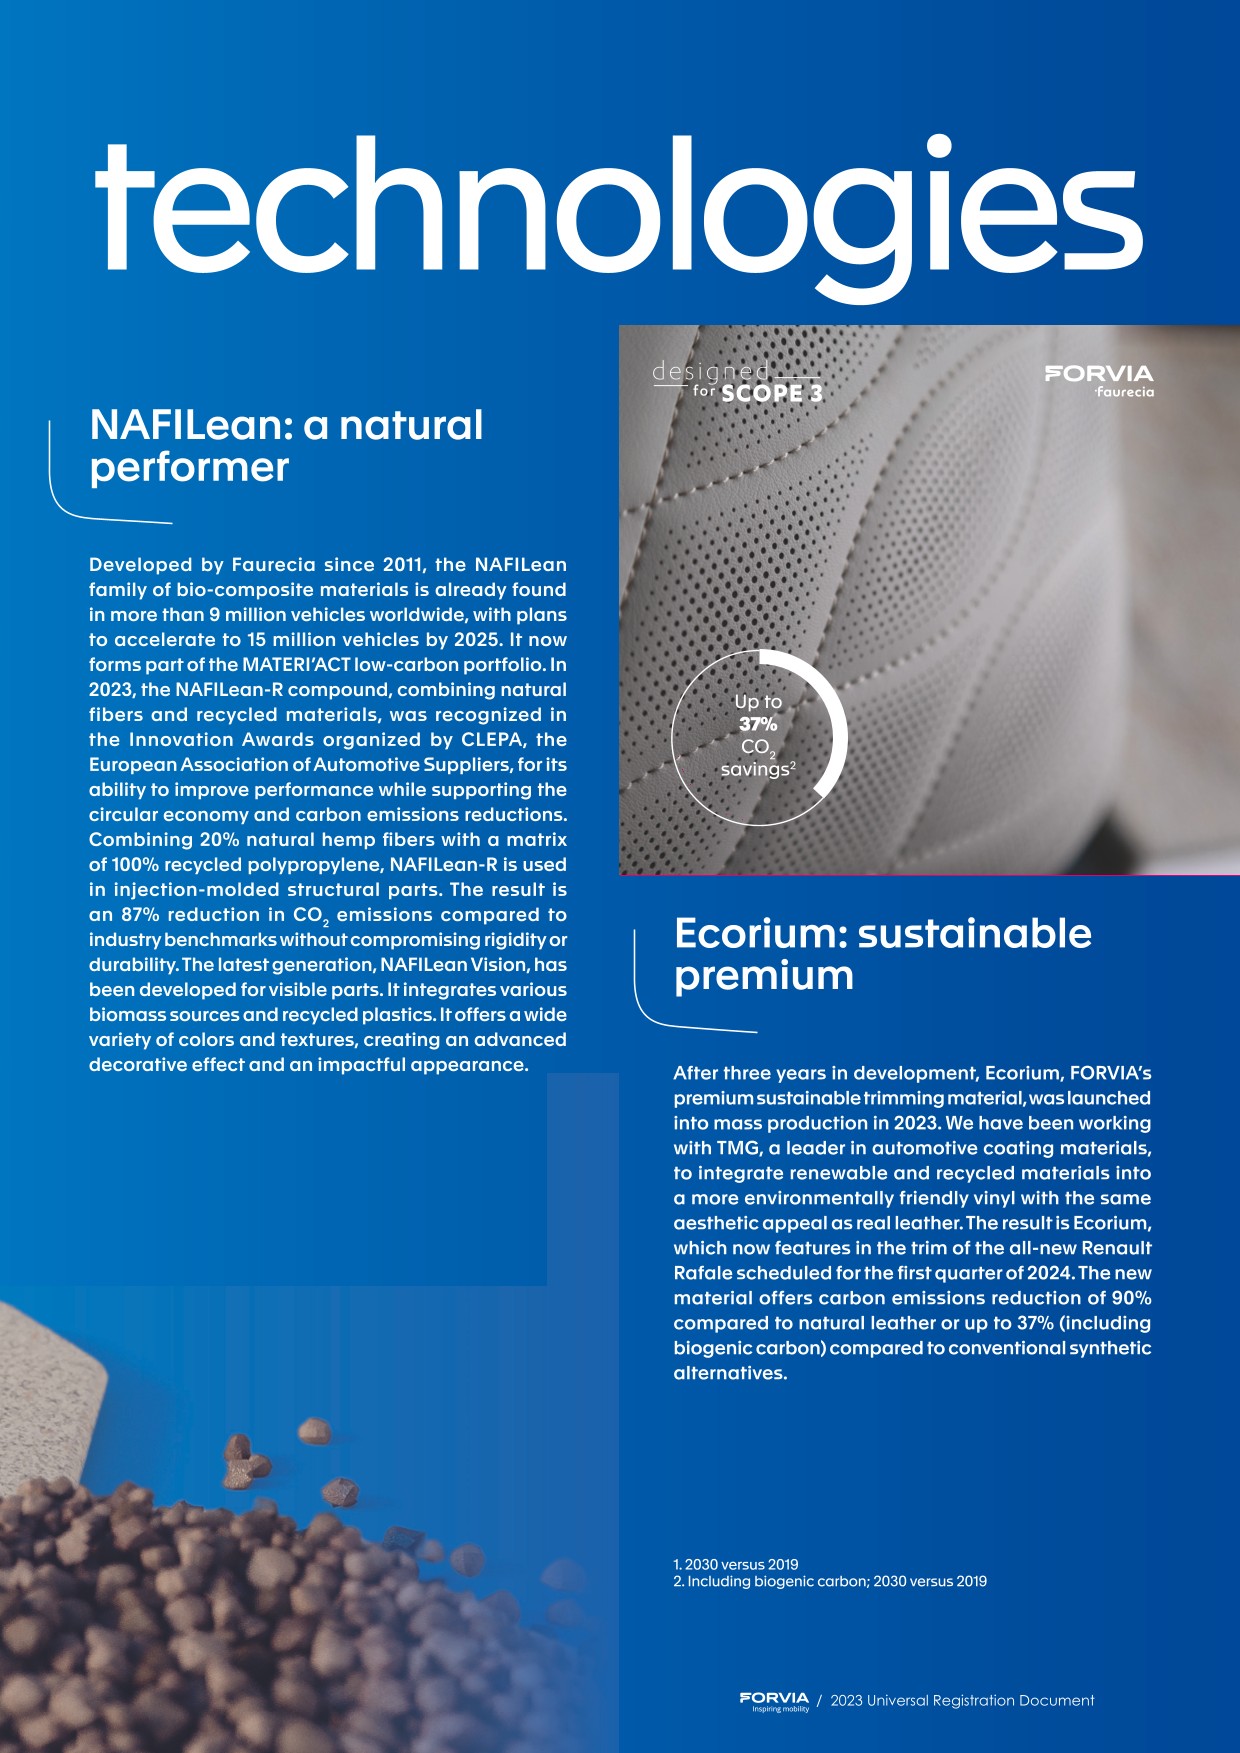
- ■NAFILean-R: more recycled content in sustainable materials,
- ■XL Tank: game-changing solution to address the needs of Heavy-Duty hydrogen mobility.
November 2023
- ■FORVIA has been awarded a contract from a major automotive manufacturer to supply Type IV hydrogen storage systems for medium-duty commercial trucks in the North American market, with start of production in 2025.
- ■In November 2023 FORVIA’s corporate ratings assigned by Fitch (BB+) was reaffirmed and the outlook was raised from “negative” to “stable” by Fitch.
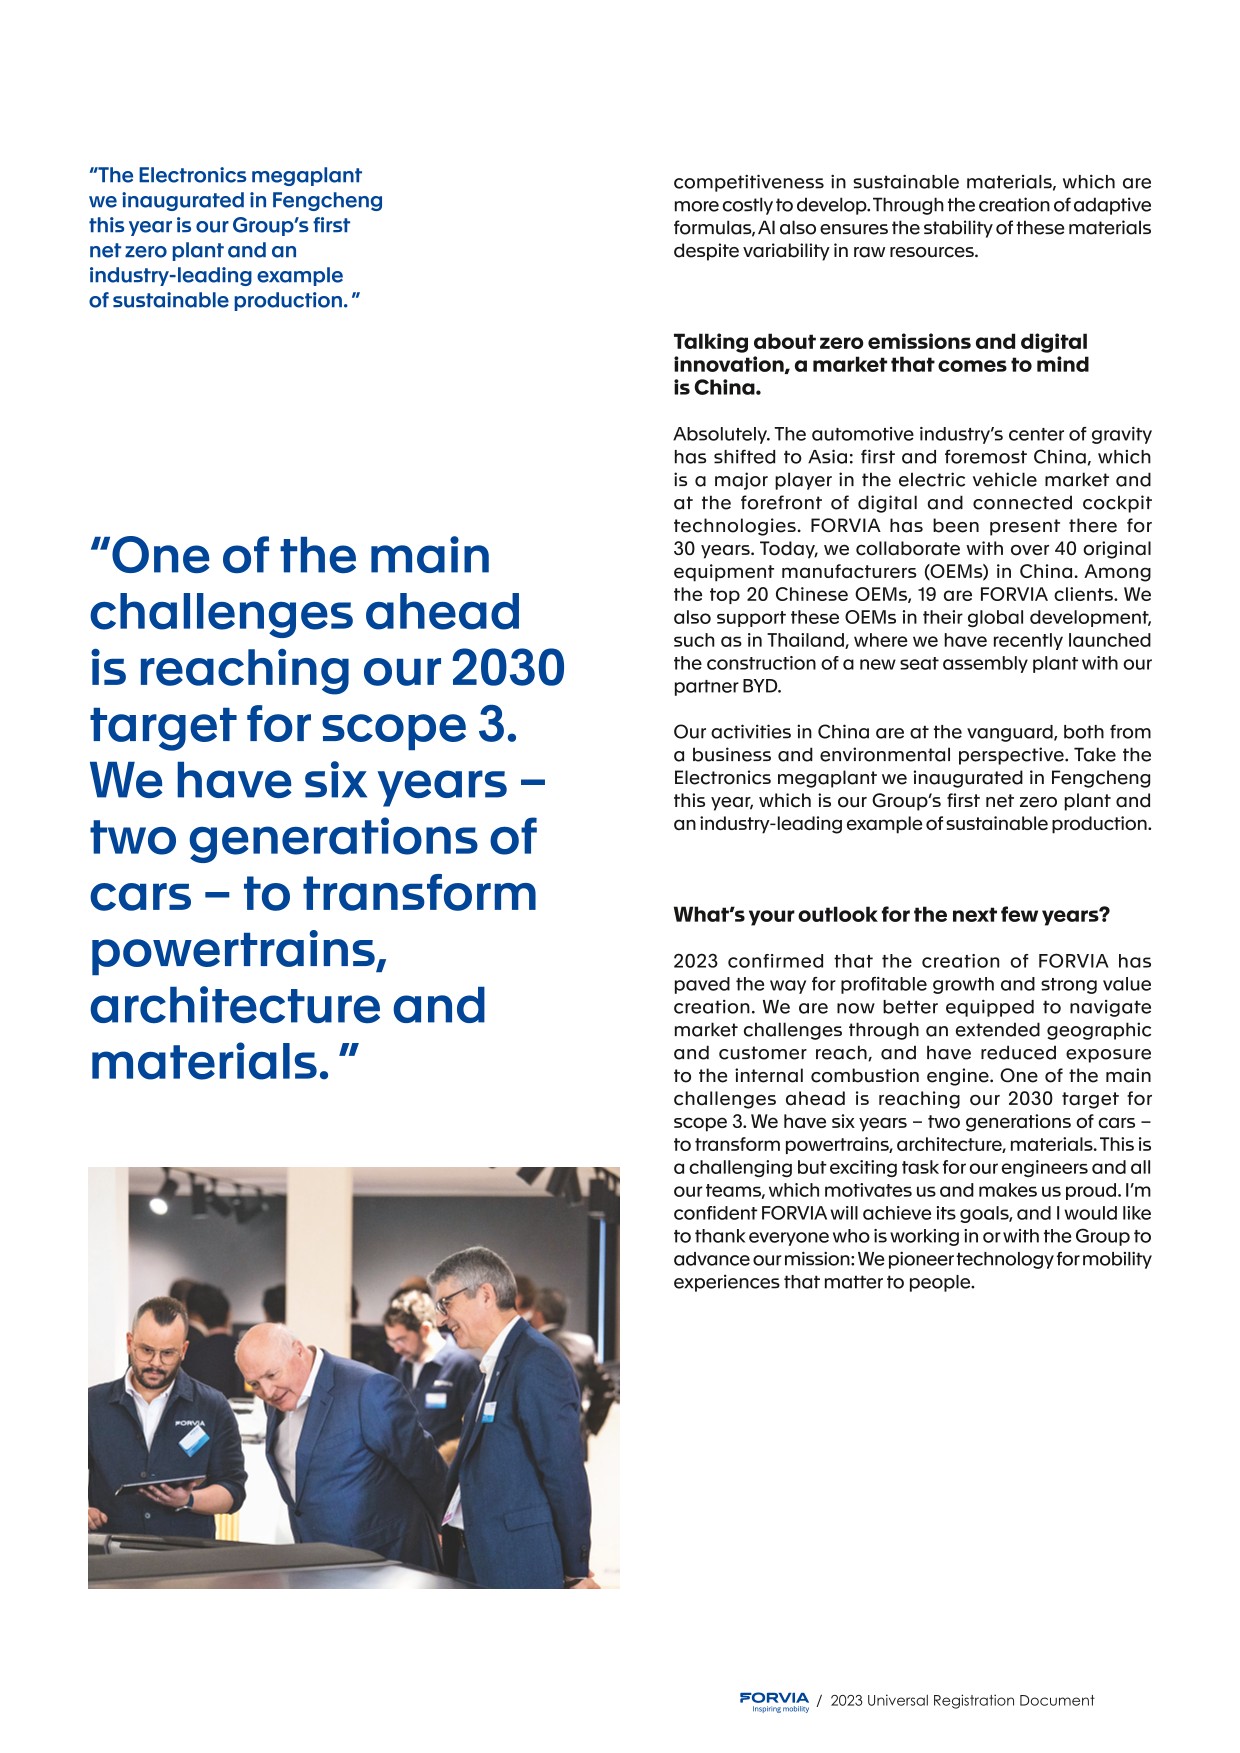
- ■FORVIA, has officially inaugurated its latest Electronics mega plant Poenix in Fengcheng (Jiangxi, China) in the presence of government representatives, partners and more than 40 customers. The Phoenix plant in Fengcheng, China, is best-in-class both in smart manufacturing and sustainability. This new Electronics megaplant uses end-to-end digitalization to produce electronics systems for cockpit displays and automated driving, with a capacity of 2 million units per year. It sets a precedent for FORVIA – the first plant to be designed using digital-twin technology at such a level and scale to simulate its 89 production lines and workflows in a virtual environment, allowing streamlined construction and improved operational efficiency. This strategic pilot plant is on track to become a full “lighthouse” for the group, setting the standard for other similar plants around the world with real-time data analysis, state-of-the-art automation tools and intelligent digitalized warehousing. It is also FORVIA’s first plant to achieve net zero on scopes 1 and 2: its green building design has been awarded LEED Gold certification.
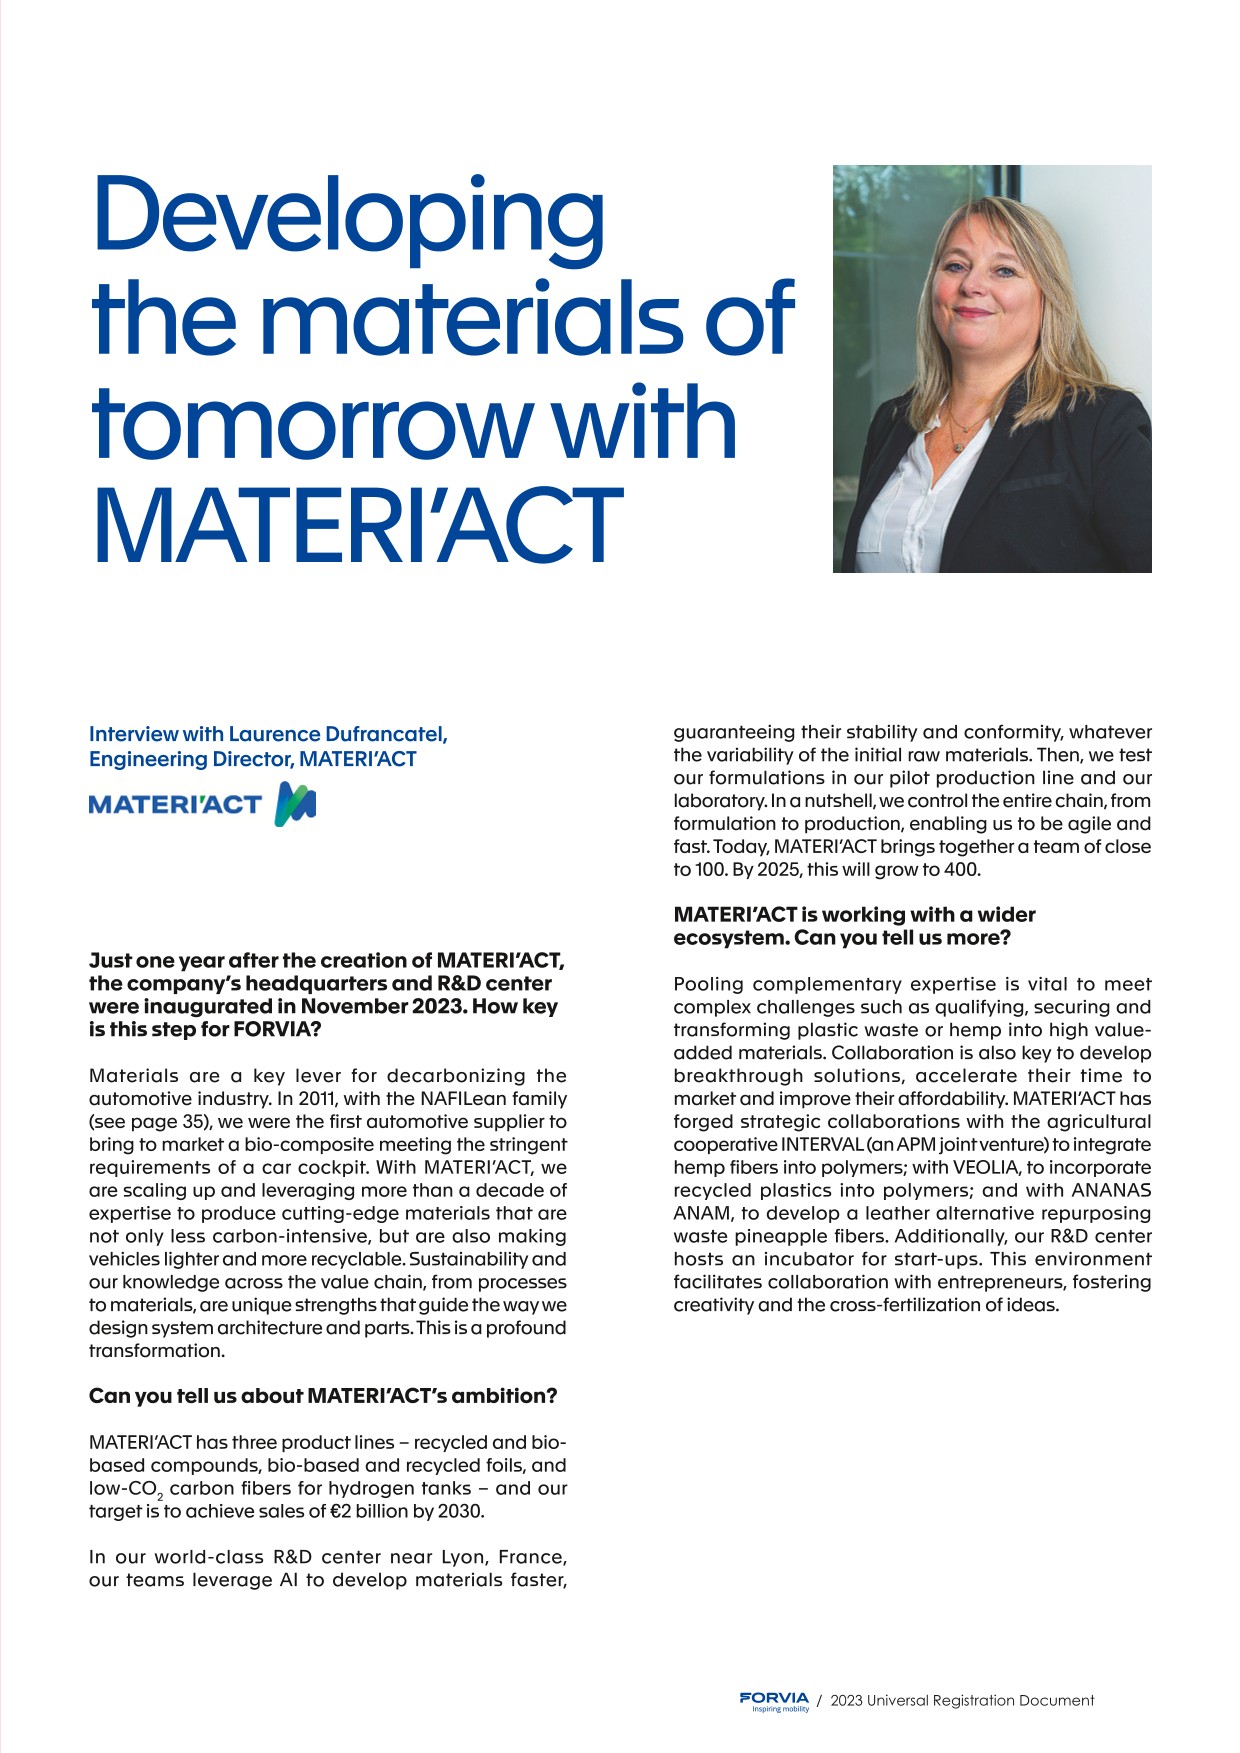
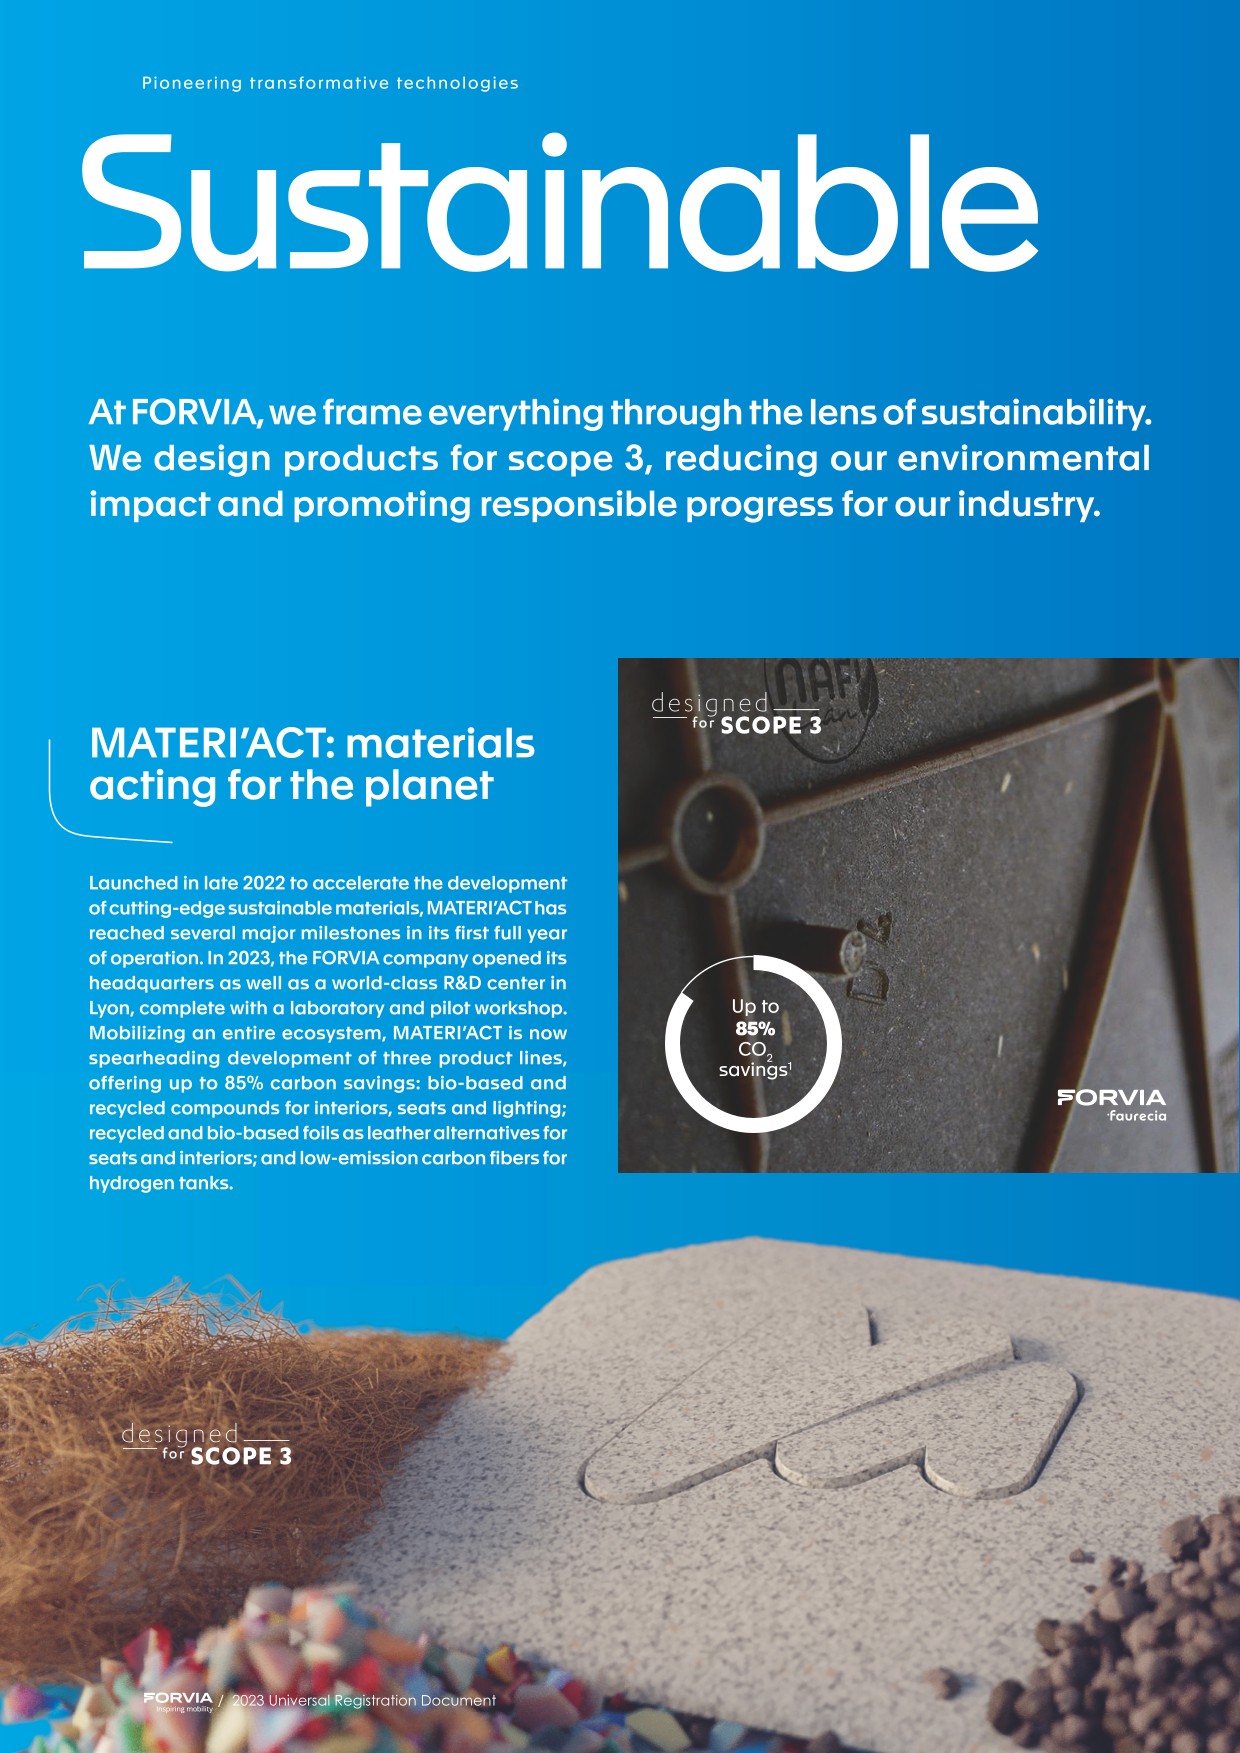
- ■One year after its creation, MATERI'ACT, a company of the FORVIA group, inaugurated its Headquarters and R&D center in Villeurbanne (France) on November 13. At the cutting edge of technology, this center brings together engineers, researchers and data scientists, and is destined to become a world-class center of excellence, and one of Europe's leading centers in the field of materials with very low CO2 footprints.
- ■FORVIA, combining the complementary strengths of Faurecia and HELLA, has received four accolades at the CES 2024 Innovation Awards in the category “Vehicle Tech & Advanced Mobility”:
- ■HELLA’s FlatLight | µMX technology,
- ■Skyline Immersive Display,
- ■eMirror Safe UX,
- ■Light Tile for Transparent Door.
December 2023
- ■TMD Friction and HELLA, a company of the group FORVIA, have agreed to transfer the 50 percent share currently held by TMD Friction in the brake joint venture HELLA Pagid to HELLA. The two companies signed a letter of intent. HELLA would thus become the sole shareholder of HELLA Pagid. Founded in 2013, HELLA Pagid, a joint venture between automotive supplier HELLA and brake friction manufacturer TMD Friction, sells brake components and accessories on the global automotive aftermarket.
- ■Symbio, an equally owned joint venture between FORVIA, Michelin and Stellantis, has inaugurated SymphonHy, its first gigafactory, a center of technological and industrial excellence. Located in Saint-Fons, in the Auvergne-Rhône-Alpes region, SymphonHy is the largest integrated fuel cell production site in Europe, confirming Symbio's role as a technological and industrial leader.
- ■FORVIA has set up a 4-year strategic partnership with CentraleSupélec, a renowned French Higher Education and Research Institution specialized in engineering and systems sciences, to shape the future of Smart Vehicles. In pursuit of scientific advancements, FORVIA’s Clarion Electronics Business Group has harnessed its expertise and research activities in Artificial Intelligence (AI) for automotive applications, with a focus on data fusion and image processing.
- ■On December 8, 2023, FORVIA, successfully raised JPY19.2 billion – corresponding to c. €123 million - through a three-tranches senior bond issuance on the Japanese market. The three maturities of 2.25 years, 3.25 years and 5 years offer an average coupon of 2.62%. This transaction represented FORVIA’s first issuance of a “Samurai bond” – yen-denominated bonds issued by non-domestic issuers as well as the first-ever Samurai bond issuance by an international automotive supplier. It contributed to the diversification of FORVIA’s debt investor base and supports the globalization of its footprint.
- ■At its meeting held on December 14, 2023, the Board of Directors of FORVIA SE decided to propose, for approval at the 2024 Annual Shareholders’ Meeting, the renewal of the following Board members, each of whose current terms expire in 2024: Judy CURRAN, Jean-Bernard LÉVY, and Michel de ROSEN.
January 2024
- ■Effective 19th December 2023, Jill GREENE is appointed Executive Vice-President, Group General Counsel and Board Secretary. She succeeds Nolwenn DELAUNAY and reports to CEO of FORVIA Patrick KOLLER.
- ■Effective 1st January 2024, Chuan MA is appointed Executive Vice-President, China. He reports to the CEO of FORVIA Patrick Koller. This appointment takes place at a time when Chinese OEMs are becoming Global Automotive players in the context of electrification of the Automotive industry.
February 2024
- ■FORVIA, has been recognized for leadership in corporate transparency and performance on climate change by global environmental non-profit Carbon Disclosure Project (CDP), securing a place on its annual ‘A List’. Based on data reported through CDP’s 2023 Climate Change questionnaire, FORVIA is one of the very few companies that achieved ‘A’ – out of over 21,000 companies scored.
-
1.2.Outlook
2024 GUIDANCE
- ■broadly stable worldwide automotive production in 2024 vs. 2023, in line with S&P’s latest forecast dated February 2024 that estimates 90.0 million light vehicles produced in 2024 vs. 90.3 million in 2023 (-0.4%);
- ■average 2024 currency rates of 1.10 for €/USD and of 7.50 for €/CNY.
And assumes no major lockdown impacting production or retail sales in any automotive region during the year.
- ■a limited negative scope effect on sales of c. €50 million as the net effect of the disposal of the CVI business to Cummins (deconsolidated as from Q4 2023) for €(300) million largely offset by the consolidation as from January 1, 2024 of HELLA’s joint-venture in Lighting in China for c. €250 million;
- ■the impact of the first step, already announced, of the second €1 billion disposal program underway, i.e. the disposal by HELLA of its 50% stake in BHTC that should contribute cash proceeds estimated at c. €200 million.
-
1.3.Consolidated financial statements
In the financial statements reported thereafter, please note that figures reported for the year 2023 include 12 months of activity of HELLA (major acquisition of 2022) vs 11 months in 2022.
1.3.1.Consolidated statement of comprehensive income
(in € million)
Notes
2023
2022 restated*
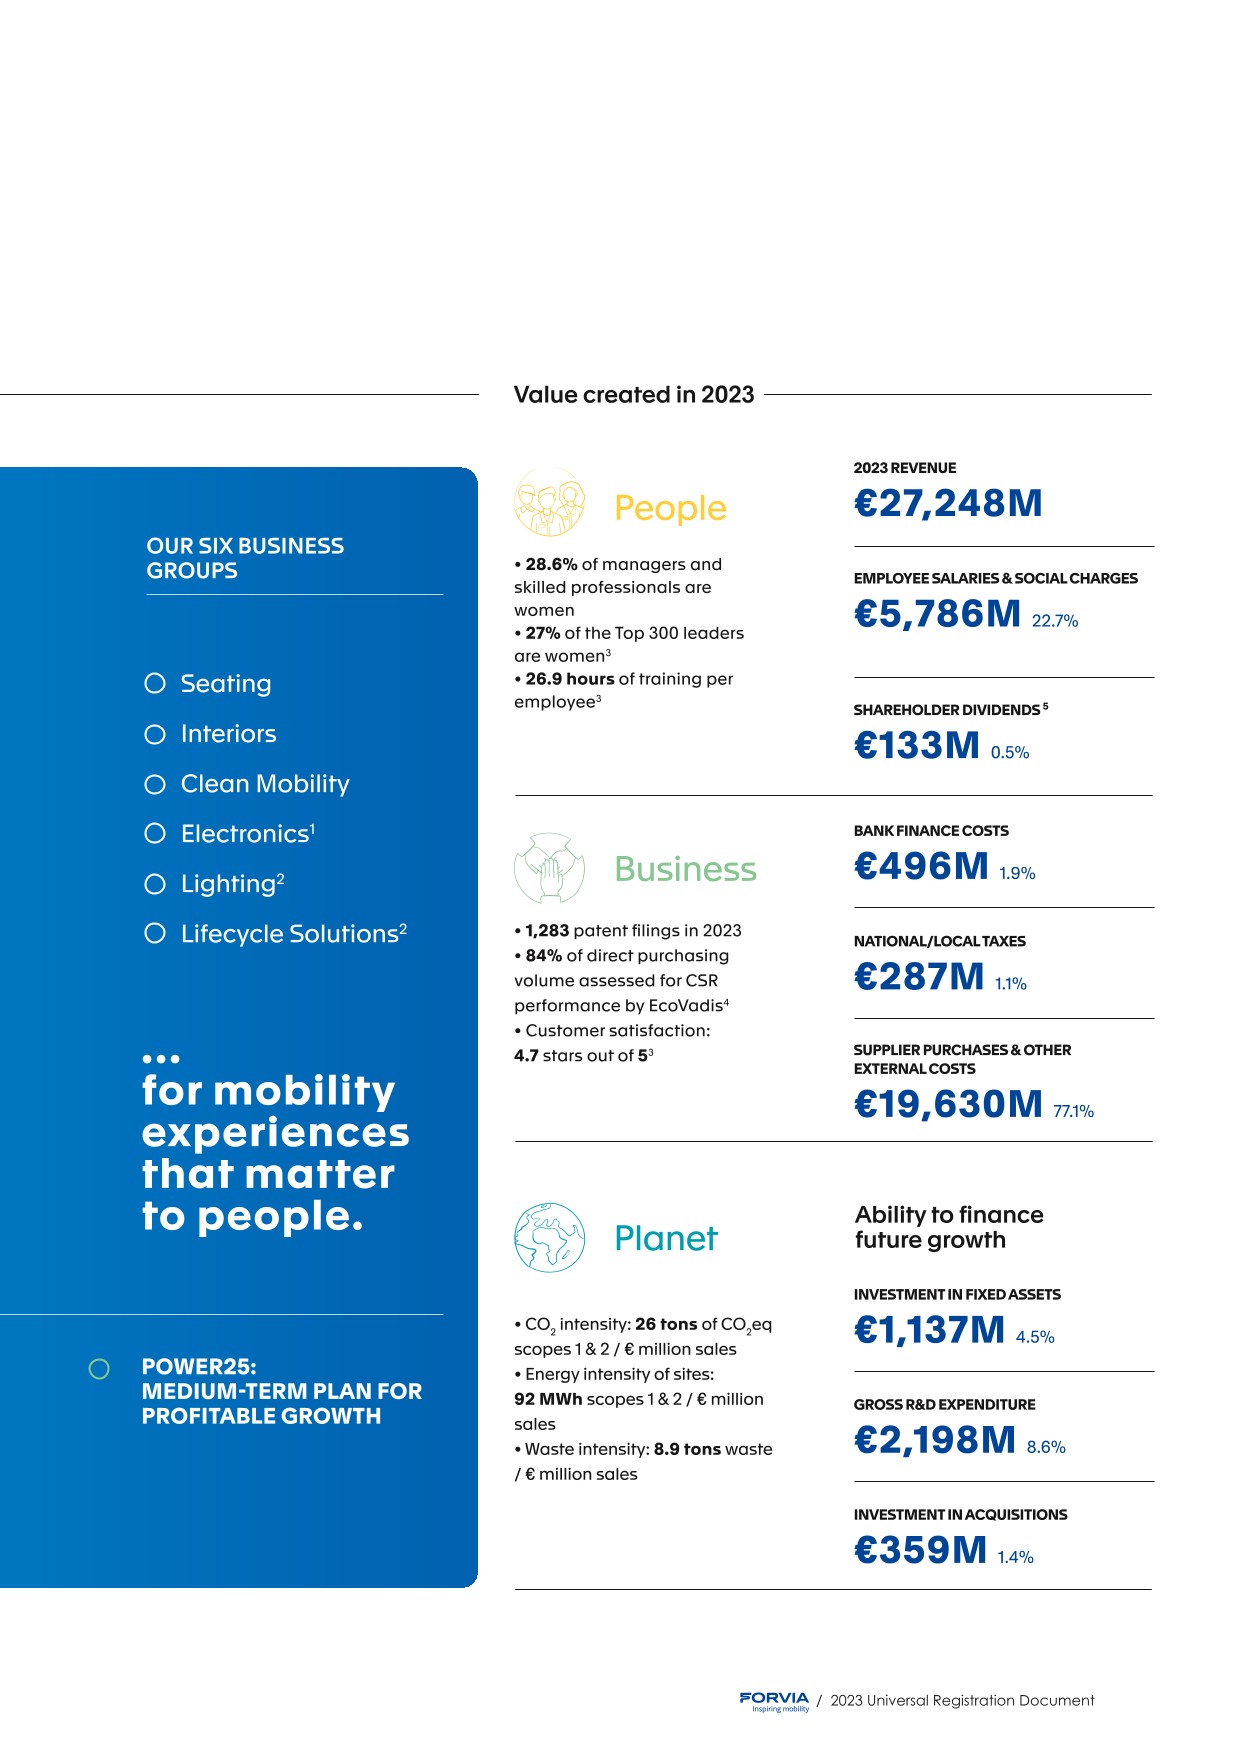
Sales
4
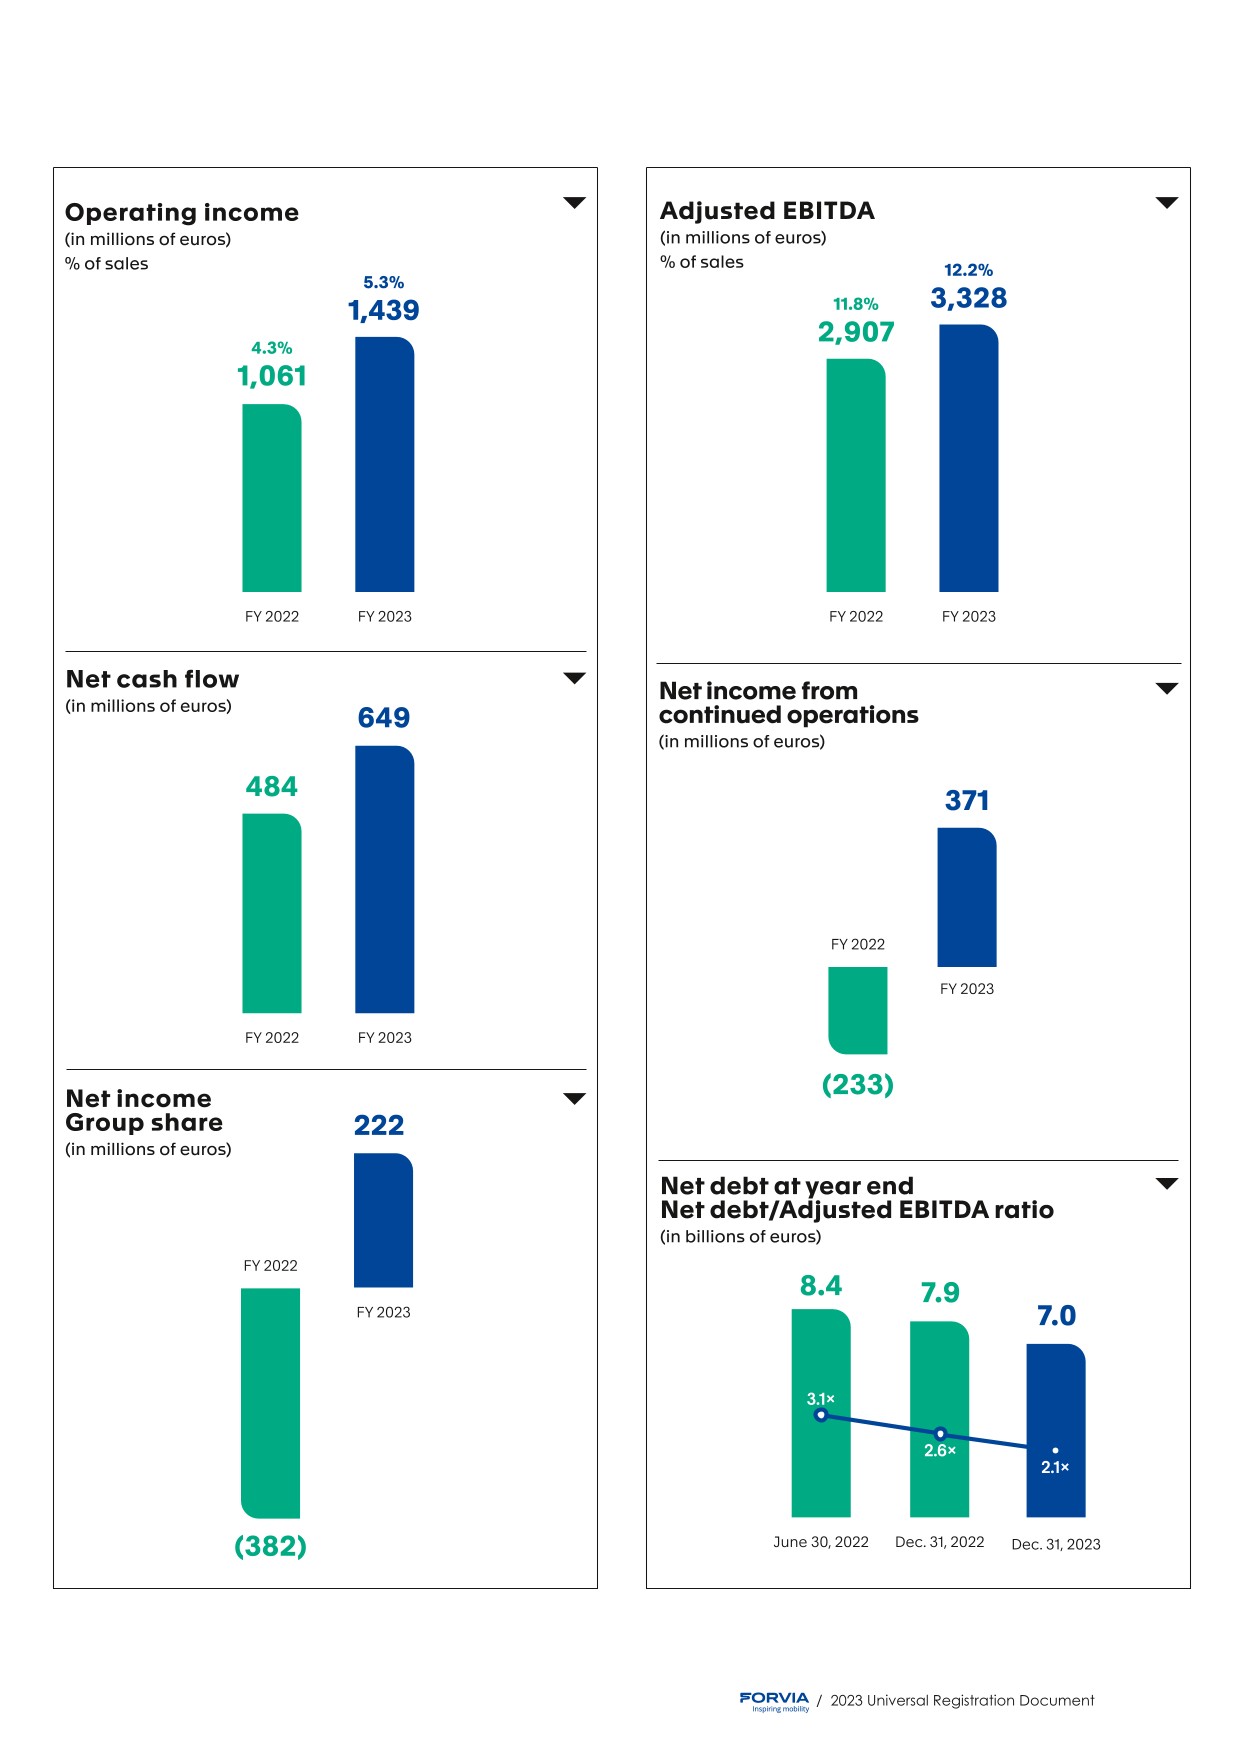
27,247.9
24,573.7
Cost of sales
5
(23,585.5)
(21,442.1)
Research and development costs
5
(953.0)
(896.0)
Selling and administrative expenses
5
(1,270.3)
(1,175.1)
Operating income
(before amortization of acquired intangible assets)4
1,439.1
1,060.5
Amortization of intangible assets acquired in business combinations
11
(193.2)
(189.9)
Operating income
(after amortization of acquired intangible assets)1,245.9
870.6
Other non-recurring operating income
6
7.8
1.8
Other non-recurring operating expense
6
(189.2)
(444.3)
Income from loans, cash investments and marketable securities
90.7
50.3
Finance costs
7
(586.2)
(377.1)
Other financial income and expense
7
36.6
(168.4)
Income before tax of fully consolidated companies
605.6
(67.1)
Taxes
8
(232.4)
(177.0)
of which deferred taxes
8
181.6
177.5
Net income (loss) of fully consolidated companies
373.2
(244.1)
Share of net income of associates
13
(2.2)
11.4
Net income from continued operations
371.0
(232.7)
Net income from discontinued operations
2.1
(5.4)
(17.7)
Consolidated net income (loss)
365.6
(250.4)
Attributable to owners of the parent
222.2
(381.8)
Attributable to minority interests from continued operations
23
143.4
131.4
Attributable to minority interests from discontinued operations
0.0
0.0
Basic earnings (loss) per share (in €)
9
1.13
(2.20)
Diluted earnings (loss) per share (in €)
9
1.12
(2.20)
Basic earnings (loss) from continued operations per share (in €)
9
1.15
(2.10)
Diluted earnings (loss) from continued operations per share (in €)
9
1.15
(2.10)
Basic earnings (loss) from discontinued operations per share (in €)
9
(0.03)
(0.10)
Diluted earnings (loss) from discontinued operations per share (in €)
9
(0.03)
(0.10)
* See Note 1 C.
Other comprehensive income
(in € million)
Notes
2023
2022 restated*
Consolidated net income (loss)
365.6
(250.4)
Amounts to be potentially reclassified to profit or loss from continued operations
(320.6)
79.5
Gains (losses) arising on fair value adjustments to cash flow hedges
(25.6)
92.6
of which recognized in equity
69.1
82.5
of which transferred to net income (loss) for the period
(94.7)
10.1
Exchange differences on translation of foreign operations
(297.7)
11.8
Tax impact
2.6
(24.9)
Amounts not to be reclassified to profit or loss from continued operations
(29.2)
168.6
Actuarial gain/(loss) on post-employment benefit obligations
25
(43.0)
244.2
Tax impact
13.8
(75.6)
Other comprehensive income from discontinued operations
(13.3)
(8.9)
Total comprehensive income (expense) for the period
2.5
(11.2)
Attributable to owners of the parent
(102.2)
(150.8)
Attributable to minority interests
104.7
139.6
* See Note 1 C.
-
1.4.Statutory auditors’ report on the consolidated financial statements for the year ended December 31, 2023
This is a translation into English of the statutory auditors’ report on the consolidated financial statements of the Company issued in French and it is provided solely for the convenience of English-speaking users.
This statutory auditors’ report includesinformation required by European regulations and French law, such as information about the appointment of the statutory auditors or verification of the information concerning the Group presented in the management report and other documents provided to shareholders.
This report should be read in conjunction with, and construed in accordance with, French law and professional auditing standards applicable in France.
Opinion
In compliance with the engagement entrusted to us by your annual general meeting, we have audited the accompanying consolidated financial statements of Forvia for the year ended December 31st, 2023.
In our opinion, the consolidated financial statements give a true and fair view of the assets and liabilities and of the financial position of the Group as at December 31st, 2023 and of the results of its operations for the year then ended in accordance with International Financial Reporting Standards as adopted by the European Union.
-
1.5Review of Company’s business and financial results
Forvia SE company is a holding company which directly and indirectly provides financial, accounting, IT, executive management and administrative services to companies in the Group.
Forvia invoices trademark royalties, calculated as a proportion of the subsidiaries’ sales. These royalties, extended since 2015 to all companies wholly owned by the Group, totaled €59.3 million in 2023, versus €64.2 million in 2022.
Results of operations
The operating result for the year 2023 is a loss of €1.0 million to be compared to a profit of €18.5 million in 2022.
The net financial income totaled €83.6 million, compared to a net financial income of €314.0 million in 2022.
The variance is mainly due to the decrease in dividends received from €277.3 million in 2022 to €87.2 million in 2023. Interest income, net of interest expense, represents €1.4 million, compared to €44.1 million in 2022.
Tax income amounted to €7.9 million, compared with €14.3 million for fiscal year 2022. This corresponds to the tax income recognized from the positive earnings of French subsidiaries that are part of the consolidated tax group.
Net income for the fiscal year showed a profit of €87.1 million (5). This compares with a profit €344.3 million in 2022.
-
1.6Parent company’s financial statements for the year ended December 31, 2023
1.6.1Income statement
(in € thousands)
Notes
2023
2022
Services sold
85,382
96,589
Sales
85,382
96,589
Outside services
(108,403)
(111,441)
Taxes other than on income
(3,854)
(2,685)
Salaries and wages
(24,778)
(15,524)
Payroll taxes
(6,290)
(7,937)
Amortization, depreciation and provisions
(net of reversals) and expense transfers
3
(1,675)
(3,591)
Other income/(expenses)
4
58,571
63,061
Total operating income and expenses
(86,429)
(78,117)
Net operating income
(1,047)
18,472
Financial income
5
790,245
790,244
Financing costs
5
(706,623)
(476,261)
Net financial income (expense)
5
83,622
313,983
Operating income after net financial income
82,575
332,455
Non-recurring income
6
2,845
739
Extraordinary expenses
6
(5,938)
(3,160)
Net non-recurring income
6
(3,093)
(2,421)
Employee profit-sharing
(344)
(9)
Corporate income tax
7
7,913
14,300
Net income
87,051
344,325
-
1.7.Statutory auditors’ report on the financial statements
This is a translation into English of the statutory auditors’ report on the financial statements of the Company issued in French and it is provided solely for the convenience of Englishspeaking users. This statutory auditors’ report includes information required by European regulations and French law, such as information about the appointment of the statutory auditors or verification of the management report and other documents provided to the shareholders. This report should be read in conjunction with, and construed in accordance with, French law and professional auditing standards applicable in France.
Opinion
In compliance with the engagement entrusted to us by your annual general meeting, we have audited the accompanying financial statements of Forvia SE for the year ended December 31st, 2023.
-
2Risk factors
& Risk managementThis section describes the parties involved in FORVIA group's Enterprise Risk Management program (ERM) and the main risk factors to which the Group believes it is exposed as of the date of this Universal Registration Document. However, other risks that the Group is not aware of at the date of this Universal Registration Document, or which are not considered to date as likely to have a significant unfavorable impact for the Group, its Business Groups, its financial position, its results or its outlook, may exist or occur.
The risk factors of the Group presented below are those identified as being within its ERM scope as of the date of this Universal Registration Document, it being understood that certain information presented below and identified as such relates specifically to the 2023 fiscal year.
2.1.Methodology and description of the main risk factors and their management
The Group operates its activities in an environment that is constantly changing. It is therefore exposed to risk factors that could result in events whose probability of occurrence and/or severity could adversely affect the achievement of its objectives in the short, medium or long term.
Methodology
Raising awareness of risk culture is the key element of the methodology, for which training is provided to all players in the risk management system. The Group works every year on a risk tolerance mapping through a global approach that is broken down into several stages:
- 1 .the definition of the Group’s context and associated objectives; this forward-looking strategy phase is carried out at the beginning of the year as part of the strategic plan. Thanks to a bottom-up approach, for each product line, the deliverable is formalized with a SWOT analysis and a risk tolerance mapping, with three key factors:
- ■the uncertainties related to the global environment and the automotive sector,
- ■the threats, known or unknown, that could affect the Group’s objectives,
- ■the opportunities associated with the threats identified in order to achieve the Group’s objectives.
- A version is then consolidated by business groups with the entries of its product lines to form a Strategic risk mapping that represents the net impact in function of the time horizon; a final version is then consolidated for the Group;
- 2 .the risk assessment of which the Group is aware, with three phases:
- ■risk identification which is approached via various methods, including surveys and interviews with the main stakeholders at Group and business level,
- ■risk analysis by the causes and consequences to better qualify the risk parameters using a qualitative method,
- ■risk assessment using the prioritization method described below;
- 3 .the risk processing is done using four different levers so called 4T (terminate or avoid, treat or reduce, transfer or share and then tolerate the residual risk) and this thanks to risk control tools that apply for:
- ■the probability of occurrence with control measures, to anticipate the occurrence of any known and possible event,
- ■the impact (or severity) with appropriate mitigation plans, to limit the effects of any adverse event as far as possible.
The Group’s risk mapping changes each year according to the external and internal context. It is submitted to the Risk Committee for approval.
- ■the corruption risk mapping in application of the provisions of the Sapin II law;
- ■the extra-financial performance risk mapping in the context of the Non-Financial Performance Declaration.
Since 2022, more granular risk analyzes have been carried out at the level of functions, Business Groups or regions, and these feed into the Group’s vision. They also give more autonomy to the operational teams thanks to the deployment of tools and help to raise their awareness of risk management and culture. The result is formalized in the form of risk tolerance maps. They are specific to the scope in question and are accompanied by risk mitigation measures and plans.
The link between risk management and internal control is described in Section 2.2.2.2. “Internal control” in this section.
The assessment of the main risks takes into account the control measures implemented to reduce the risk (net or residual risk) and is based on a simplified risk tolerance mapping with a three-level scale:
- ■impact or severity (low/medium/high) which is characterized by financial, operational, reputational, human and/or legal criteria;
- ■the probability of occurrence (low/medium/high) which is characterized by a frequency.
Since 2022, the Group created the ABC Risk class method to better control risk (see paragraph 2.2.4 "Risk department").
The simplified mapping of the main risk factors is shown below. The different risk factors included in this matrix are detailed in this section. The risk tolerance mapping is an internal tool to manage the Group's risk factors. It is also validated by the Audit Committee and by the Board of Directors of FORVIA SE once a year.
Note: The abbreviation NFPD indicates that this risk presents non-financial challenges, which are described in detail in Chapter 4 “Non-Financial Performance.” Identification of the primary CSR risks & opportunities is based on CSR risk mapping produced by the Group to supplement Group risk mapping. A risk universe (and the associated descriptions) was thus defined during a process that included consultations with internal and external stakeholders. Identified risks were rated by stakeholders. The risks selected are those with high criticality during this rating phase and have been approved by the Group’s Risk Committee.
In addition to the simplified mapping of the main risks above, the following table provides a summary of the risk factors and the associated measures of control. The categories below are not set out in order of importance. However, within each category, the risk factors are set out in decreasing order of importance as determined by the Group at the date of this Universal Registration Document on the basis of an assessment of their probability and potential impact, taking into account mitigating measures (net risk). The assessment made by the Group of this ranking in terms of importance may however be modified at any time, in particular, in response to new events outside or within the Group. Moreover, even a risk that is currently considered to be of lesser importance could have a significant impact on the Group should it occur at a future date.
Other risks of which the Group is currently unaware, or which it does not consider significant at the date of this Universal Registration Document, could also affect its business.
Risk factors
Main risk control measures
Probability
Impact
Related Section
Operational & industrial risks
2.1.1.
Supply-chain disruptions & supplier failure
- ■Qualification process of supplier panel according to specific criteria (innovation, quality, cost, cash, lead times, etc.)
- ■Systematic assessment of supplier risks within dedicated sourcing committees
- ■Integration of geopolitical, social, ethical, economic and financial risks
- ■Monthly monitoring of operational and financial performance
- ■Supplier development plan (logistics, quality, international development, etc.)
- ■Implementation of a supplier risk management solution
- ■Analysis of the capacity of suppliers beyond tier 2 for critical families
●●●
●●○
2.1.1.9.
Risk associated with the automotive supplier business
- ■Diversity of sales by region, by brand and vehicle model
- ■Dependency rate per customer limited to 15% of Group sales
- ■Constant monitoring of the competition
- ■Innovation and investment in Research & Development
- ■Forward management method enabling fine-tuning of the means of production
●●●
●●○
2.1.1.3.
Cybersecurity and reliability of information systems, data & embedded software
- ■Team of specialists dedicated to cybersecurity headed by a CISO
- ■Strategic plan dedicated to information systems risks (IT + OT)
- ■High Availability Architecture and Disaster Recovery Plan
- ■Regular audits of sensitive applications
- ■Precise methodology for computer science project management
- ■Existence of a Security Operation Center and a Product Security Incident Response team
- ■Management of access rights and roles
- ■Continuous software updates
- ■GDPR compliance program
- ■Regular simulation exercises for the Group
- ■Deployment of online training and an annual awareness campaign
●●○
●●●
2.1.1.1.
New product launches & program management
- ■Existence of a standard organizing the program life
- ■Systematic risk assessment program as of the initial phase using 16 criteria
- ■Monthly review of programs and monitoring of action plans
- ■Regular audit of each development center and the industrial parks
●●○
●●●
2.1.1.5.
NFPD
Talent acquisition & retention
- ■Partnerships with more than 100 post-secondary institutions
- ■Specific on-boarding program for newcomers using a dedicated platform
- ■Internal mobility policy (including abroad)
- ■Regular reviews of the compensation policy
- ■Quantitative indicators through dedicated reporting
- ■Succession plans for key positions
●●○
●●○
2.1.1.12.
NFPD
Climate transition & its impact on the economic system
- ■Vice-Chairman reporting to the Executive Committee, who manages the CO2 reduction project
- ■Roadmap validated by the Science-Based Targets Initiative (SBTi)
- ■Special partnership with Schneider Electric, Accenture, Engie, KPMG and Deloitte
- ■Performance indicator linked to variable compensation for Management
- ■Risk mitigation plan with specific projects being rolled out
●●○
●●○
2.1.1.2.
NFPD
Loss of a site due to industrial or natural events
- ■Industrial risk assessment model based on a framework of 15 assessment criteria
- ■Valuation of the existing portfolio of industrial parks using the aforementioned model
- ■Periodic audits conducted by the insurer and issuance of an RHP label
- ■Assessment of external factors (fire, climate risks, cyber, etc.)
- ■Systematic analysis and sharing of incidents
- ■Specific audits of most vulnerable sites carried out by technical experts
- ■Existence of a surveillance and real-time warning system for climate-related events
- ■Analysis of vulnerabilities to the climate transition of the portfolio of industrial parks
●●○
●●○
2.1.1.8.
External growth & integration of HELLA
- ■Strategic priorities set by the Board of Directors
- ■Control and allocation of necessary resources by a team of specialists
- ■This team is involved in the life of entities concerned and takes part in decision-making bodies
- ■Constitution of provisions as necessary
●○○
●●●
2.1.1.4.
Pandemic
- ■Crisis management process
- ■Deployment of the “Safer Together” program applicable to all sites and conducting regular audits
- ■Implementation of cost reduction and cash protection measures
●○○
●●●
2.1.1.7.
NFPD
Site environmental impact
- ■Analysis and control of local environmental risks based on ISO 14001
- ■Monthly Environment and Energy Committee at Group level
- ■Network of HSE managers at all levels of the organization (site, division, Business Group, Group)
- ■Operational requirements defined in the 10 Green Fundamentals, accompanied by a self-assessment tool integrated into the FORVIA Excellence System
- ■Regular internal and FORVIA Excellence System audit of sites
●●○
●○○
2.1.1.11.
NFPD
Product Quality & Safety
- ■IATF 16949 certification
- ■Existence of a designated Quality Control department at all levels of the organization
- ■Measuring customer satisfaction
- ■Alert management system and problem solving with evidence
- ■Specialized and independent auditors
●○○
●●○
2.1.1.6.
NFPD
Safety at work
- ■Existence of an HSE network at all levels of the organization
- ■Systematic accident analysis
- ■Mandatory training in HSE rules
- ■Regular audits of all sites and systematically in the event of an alert
- ■Ergonomic analysis of all workstations
- ■Regular “hazard hunting” in industrial plants
●●○
●●○
2.1.1.10.
Financial & market risks
2.1.2.
Risk related to raw material & inflation of costs
- ■Negotiations with customers and strict inventory management
- ■Raw material price fluctuations mainly passed on to customers on a “pass-through basis”
- ■Specific negotiations to pass price increases linked to inflation and impacting different cost items (energy, transport, labor, etc.) on to customers
●●○
●●●
2.1.2.4.
Liquidity risk
- ■Diversification of fundings sources (bond issues, bank loans, factoring, commercial papers, etc.)
- ■Implementation of committed credit facilities (syndicated and bilateral)
- ■Maintenance of a cash cushion
●○○
●●○
2.1.2.1.
Customer credit risk
- ■Completion of a risk analysis prior to the acquisition of new customers
- ■Specific reporting on customer receivables
●●○
●●○
2.1.2.5.
Interest rate risk
- ■Centralized management of interest rate hedging
- ■A monthly Finance Committee validates hedging decisions
- ■Interest rate policy to limit the impact of rate fluctuations on the Group P&L
●●○
●○○
2.1.2.2.
Currency risk
- ■Centralized management of foreign exchange risk hedging
●●○
●○○
2.1.2.3.
Legal, regulatory & reputational risks
2.1.3.
Regulatory developments & geopolitical tensions
- ■Network of legal, tax and financial experts
- ■Constant monitoring of laws and regulations in France and abroad
- ■Monitoring of a sanctions compliance process
●●●
●●○
2.1.3.1.
NFPD
Business ethic
- ■Global network of Compliance Officers
- ■Employee training and awareness raising
- ■Code of Ethics/internal procedures
- ■Anti-corruption risk mapping
- ■Third-party assessment process
- ■Accounting controls specific to the prevention and detection of corruption
- ■Existence of a whistle-blowing system
●●○
●●●
2.1.3.5.
Significant litigation
- ■Regular monitoring through dedicated reporting
- ■Adequate provisioning
●●○
●●○
2.1.3.2.
Intellectual property
- ■Internal network of experts and specialists
- ■Global network of external advisors
- ■Performing patent searches and searches on technologies
- ■Centralized control of technical and legal matters
●●●
●○○
2.1.3.4.
NFPD
Responsible supply chain
- ■Buy Beyond sustainable buying policy with a dedicated solution
- ■Systematic CSR analysis of new programs suppliers
- ■Minimum CSR score required to join the panel
- ■Quality audit of suppliers covering all aspects of CSR
- ■Existence of a whistle-blowing system
●●●
●○○
2.1.3.3.
Note: The abbreviation NFPD indicates that this risk presents non-financial challenges, which are described in detail in Chapter 4 “Non-Financial Performance.” Identification of the primary CSR risks & opportunities is based on CSR risk mapping produced by the Group to supplement Group risk mapping. A risk universe (and the associated descriptions) was thus defined during a process that included consultations with internal and external stakeholders. Identified risks were rated by stakeholders. The risks selected are those with high criticality during this rating phase and have been approved by the Group’s Risk Committee.
- 1 .the definition of the Group’s context and associated objectives; this forward-looking strategy phase is carried out at the beginning of the year as part of the strategic plan. Thanks to a bottom-up approach, for each product line, the deliverable is formalized with a SWOT analysis and a risk tolerance mapping, with three key factors:
-
2.2.Contributors and Enterprise Risk Management program
The Audit Committee (specialized committee of FORVIA SE's Board of Directors), which is tasked with overseeing the effectiveness of the risk management program and the internal control system (which are not limited to accounting and financial risks), informs FORVIA SE's Board of Directors of the main actions taken by the Group in this domain. Risk contributors provide information to the Audit Committee which conducts a formal annual review of the global risk management program and the internal control system.
The following diagram provides a summary of the organization and processes of risk management and internal control within the Group.
2.2.1.Operational departments
The Group’s Executive Committee examines the major operational risks inherent to the Group’s business during the monthly meetings of the Operations Committee, and at least once per year it reviews the risk mapping prepared by the Group’s Risk Committee.
The Executive Management of each business (Business Group) is responsible for identifying and managing the operational risks inherent to its business, which are examined by the respective Operations Committee and Risk Committee. The operational and support functions direct and lead the actions, including risk management, necessary to achieve the Group’s objectives.
-
2.3.Insurance and risk coverage
The Group's asset protection policy is based on the implementation and ongoing adaptation of a policy of (i) preventing industrial risks and (ii) transferring the main insurable risks to the insurance market.
In addition, given the trend in claims and the unfavorable trend in the insurance market – in particular the increase in deductibles – Faurecia is de facto its own insurer to a certain extent. The Group has set up a captive reinsurance company based in Luxembourg in order to further structure this self-insurance. Since 2021, the Group has obtained approval from the Luxembourg Insurance Commission for FORVIA-Ré, which participates in the hedging of the Group’s civil liability, damage and business interruption insurance programs.
2.3.1.Fire, property damage and business interruption insurance
The Group has taken out a fire, property damage and business interruption insurance policy with a co-insurance group of major insurers led by FM Global.
Buildings and equipment are insured as replacement values. The guarantees are organized around a Master policy which directly covers the risks located in the area of freedom to provide services and local policies for subsidiaries located outside this area.
The premium rates applicable to exposed capital (direct damage and annual gross margin) depend directly on the Highly Protected Risk (HPR) classification assigned to the site, after audit by the insurer.
- ■June 2019: destruction following a fire at the plant belonging to the FCM supplier Modulo in Poland;
- ■November 2019: a fire in a workshop used for the manufacturing of flooring and trim and door panels in the Abrera plant in Spain following an outbreak of a fire on a painting production line.
These claims and general developments in the insurance market have led to a significant tightening of the program’s terms and conditions:
- ■a sharp increase in deductibles, particularly for major sites that are poorly protected or exposed to high natural risks;
- ■increase in the premium;
- ■increase in the deductible for failures, and reduction in the level of coverage provided for indirect failures (tier-2 and above suppliers, customer suppliers).
- ■monitoring by the Risk Committee of the fire protection action plans of the most vulnerable main sites;
- ■the launch of an analysis and a monitoring of the fire and natural risks of our main suppliers, in particular through the precise location of their production plants;
- ■the launch of a technical and an economic evaluation of the costs of securing sites exposed to a high risk of flooding, earthquakes, wind or snowfall.
FORVIA completely reviewed the production of insurable property values at the time of the renewal in July 2023: the insured assets are now valued by a specialized service provider according to an algorithmic and predictive methodology based on the characteristics and location of the buildings as well as the list of equipment present at each site. Inventory and gross margin values are extracted from the ERP and then allocated to each site. This innovation made it possible to contain the inflation of securities and therefore the premium budget.
Lastly, the increase in climatic hazards could increase claims related to natural events or trigger other events (heat waves, water scarcity, etc.) likely to affect the Group’s operations. A comprehensive analysis of the industrial park portfolio was carried out by an external partner in 2022, with the aim of anticipating the likely impacts of climate change on the most vulnerable industrial parks. Based on this analysis of exposure to natural disasters, the Group assesses the resilience of its activities using the OCARA method. In 2023, five pilot sites have tested the methodology before rolling it out at its most exposed sites.
-
3Corporate
governanceThe information below constitutes the chapter relating to the corporate governance report as provided for by the last paragraph of Article L. 225-37 of the French Commercial Code.
Some of the information forming an integral part of the corporate governance report, as required by Articles L. 22-10-8 and L. 22-10-10 of the French Commercial Code, is included in other chapters of this Universal Registration Document. Where applicable, references included in this section indicate the chapter of this Universal Registration Document to which they refer.
This chapter has been prepared on the basis of the work carried out by the Group’s Legal department and Human Resources department.
The Company refers to the AFEP-MEDEF Corporate Governance Code for listed companies, available on the MEDEF website (www.medef.fr).
3.1.Board of Directors
3.1.1.Summary presentation of the Board of Directors and key figures
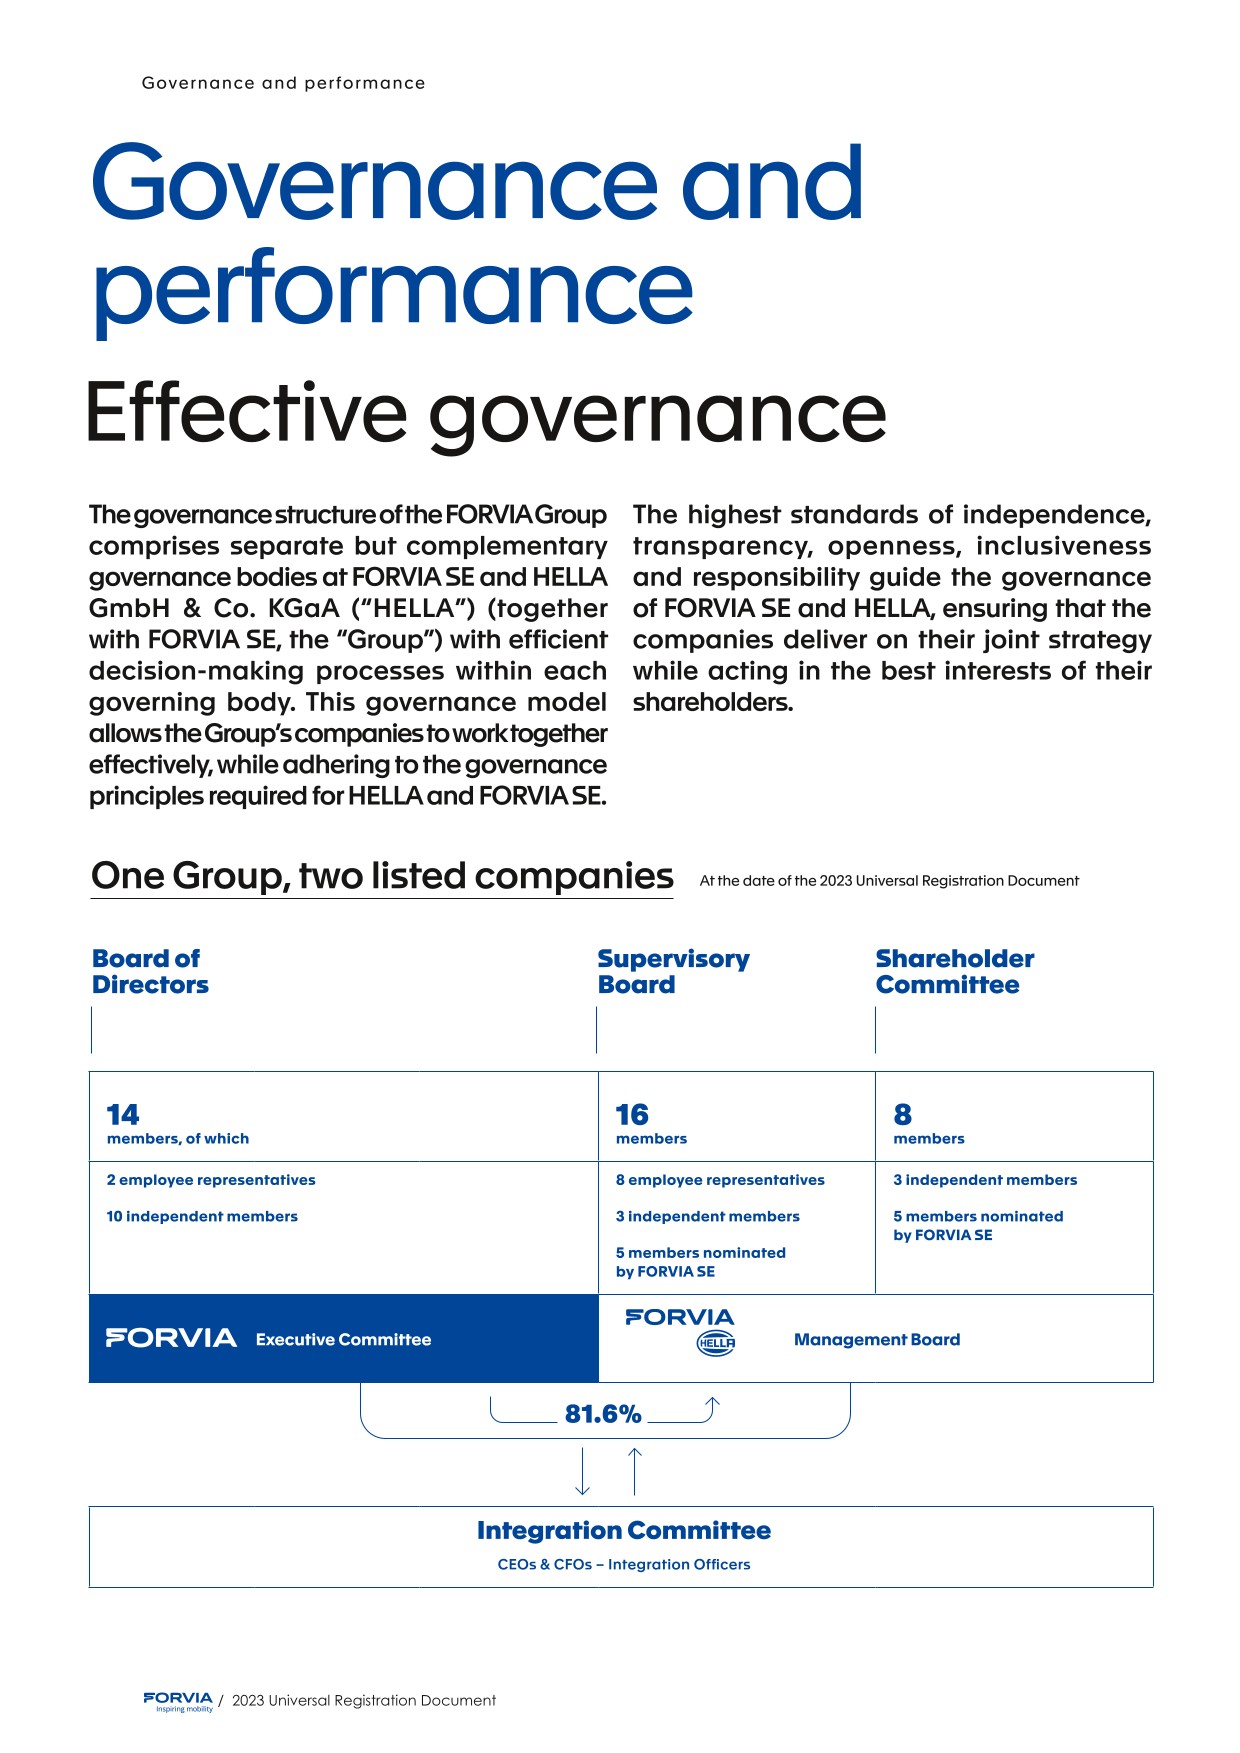
The diagram below summarizes the composition of the Board of Directors and the Committees (permanent) at the date of this Universal Registration Document:
-
3.2.Operational management of the Group
In addition to Executive Management, the information about which is given in Section 3.1.2.4 “Governance structure and shareholder dialog”, the Group has an Executive Committee and is also supported by Group Leadership Committee (TOP 300). The diversity policy within the governing bodies is described in Chapter 4 “Environmental and social performance”, Section 4.3.1.4. “Actions and assesssment of their effectiveness” paragraph Diversity & Inclusion of this Universal Registration Document.
As mentioned in Section 4.3.1.4. paragraph Diversity & nclusion of this Universal Registration Document, FORVIA has set itself the goal of boosting the recruitment and internal promotion of women in order to increase the presence of women among engineers and executives and in the Group top management with targets at 24% in 2025 and at 30% in 2030 of women in the Group Leadership Committee (TOP 300). As at December 31, 2023, the TOP 300 leaders comprised 27% women (compared to 23% in 2022) evidencing a strong feminization dynamic in the top management. The feminization of the Group Leadership Committee (TOP 300), in particular by the 2030 horizon, allows to build the necessary “reservoir”, in order to accelerate the gender balance in the Executive Committee (given that the majority of the Executive Committee’s members comes from the Group Leadership Committee (TOP 300).
In this context, FORVIA has notably implemented ambitious actions and initiatives described in Section 4.3.1.4. paragraph Diversity & Inclusion of this Universal Registration Document, in particular, in terms of hiring, training and promotion of female talents. In 2023, the Group will continue its efforts in terms of the promotion of female talent, notably by implementing a new program referred to as “RISE” in favor of about 40 identified female talents (who may occupy top leaders positions, including Executive Committee member). This nine-month program includes collective coaching sessions, co-development exercises and networking events. It is sponsored by four members of the Executive Committee, including the Chief Executive Officer. By developing female talent at the highest level, the Group wishes to develop a more inclusive management, allowing female potential to be developed in turn by these role models.
In addition, it is to be noted that recent performance share plans for the Group Leadership Committee (TOP 300) include an internal condition relating to gender balance, therefore supporting actions in favor of the feminization of top management.
On an annual basis, the Board of Directors carries out a review of the succession plan for the Executive Committee (with a special attention to the percentage of women in the succession plan) and a specific review of the Group diversity policy.
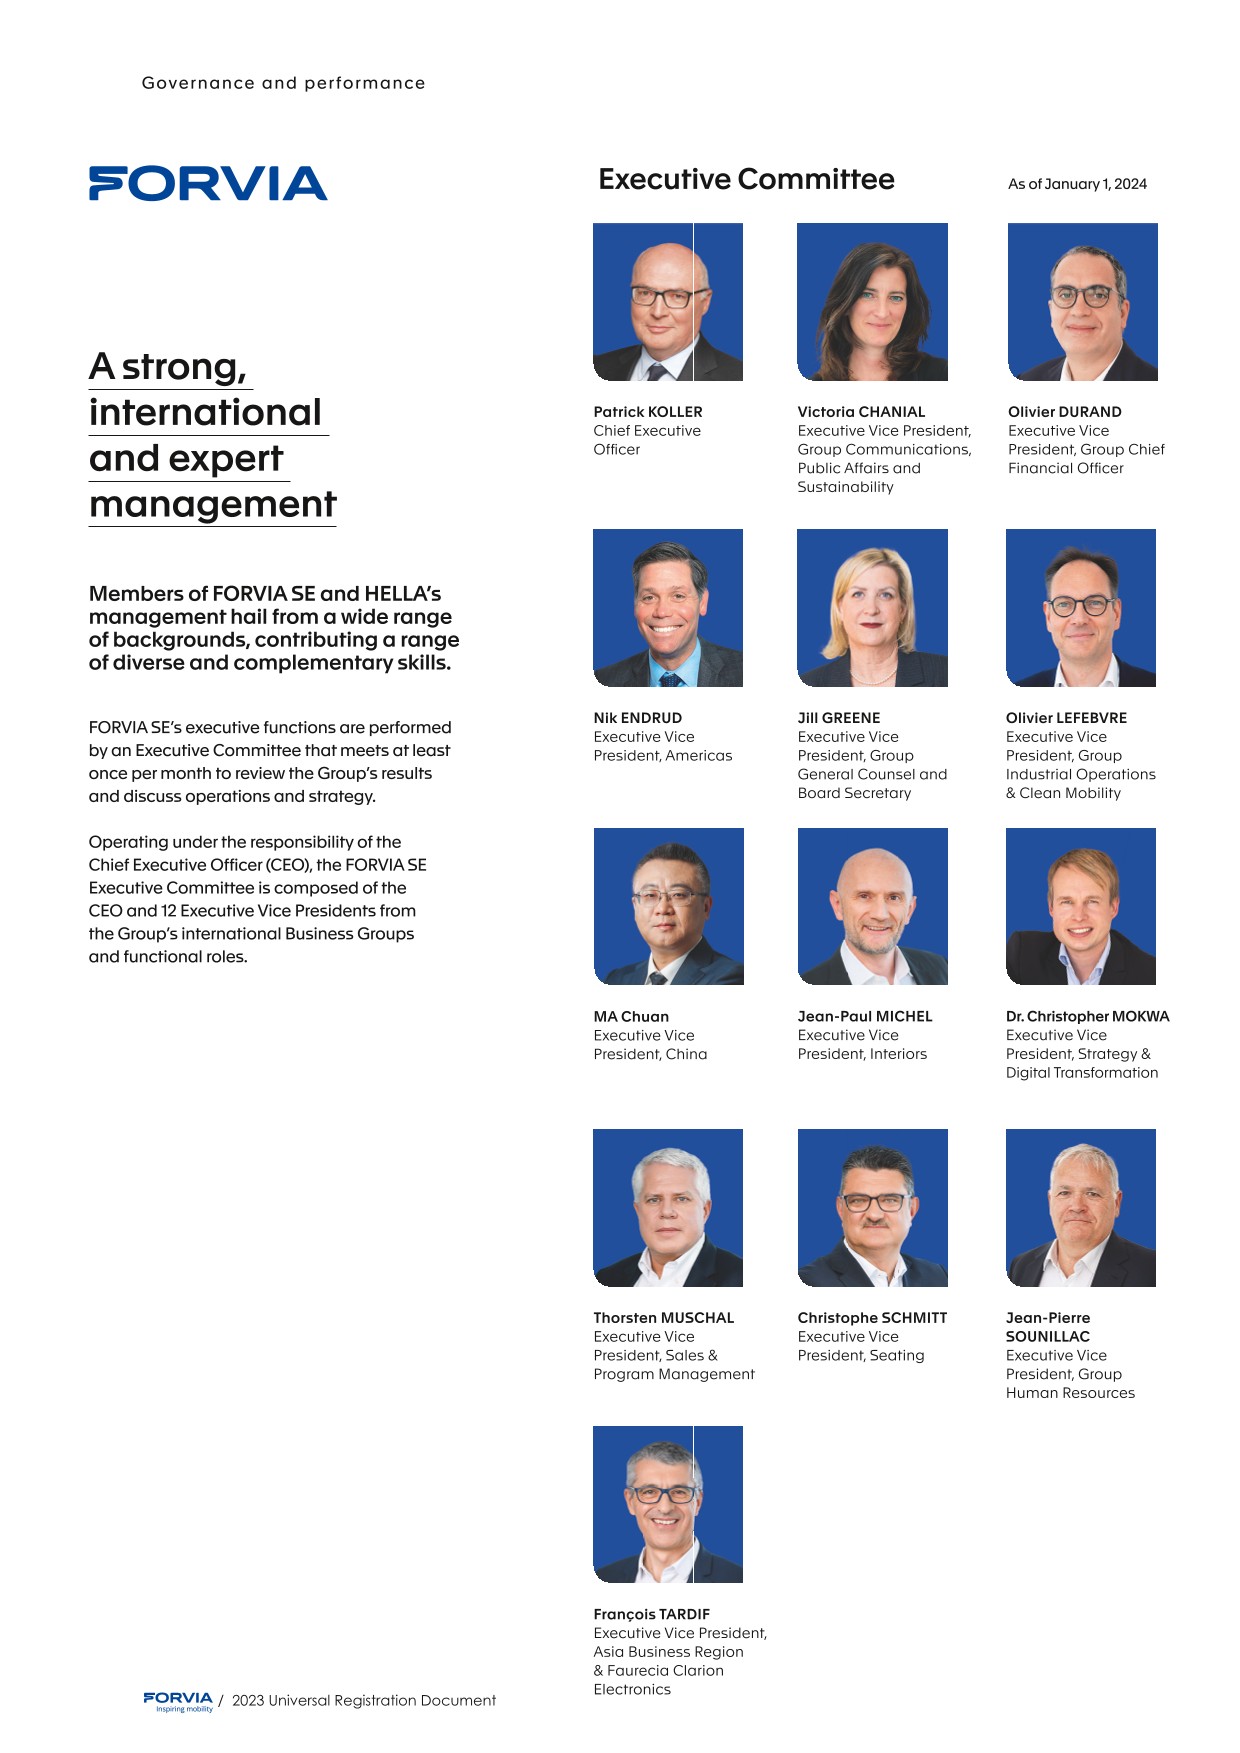
3.2.1.Executive Committee
FORVIA’s Executive Management is provided, under the responsibility of the Chief Executive Officer, by an Executive Committee which meets at least once a month to review the Group’s results and deliberate on general Group issues, or as often as the interests of the Company require.
Composition of the Executive Committee
Patrick KOLLER
Chief Executive OfficerVictoria CHANIAL
Executive Vice President, Communication, Public Affairs and Sustainable DevelopmentOlivier DURAND
Executive Vice President, Group Chief Financial OfficerNik ENDRUD
Executive Vice President, AmericasJill GREENE
Executive Vice President, Group General Counsel and Secretary to the Board of DirectorsOlivier LEFEBVRE
Executive Vice-President, Group Operations and FORVIA Clean MobilityChuan MA
Executive Vice President, China
Jean-Paul MICHEL
Executive Vice-Chairman, FORVIA InteriorsChristopher MOKWA
Executive Vice President, Group Strategy & Digital Transformation
Thorsten MUSCHAL
Executive Vice-President, Sales and Program ManagementChristophe SCHMITT
Executive Vice-President, FORVIA SeatingJean-Pierre SOUNILLAC
Executive Vice President, Group Human ResourcesFrançois TARDIF
Executive Vice President, Asia and Faurecia Clarion Electronics -
3.3.Compensation of corporate officers
3.3.1.Compensation of executive and non-executive corporate officers for the 2022 and 2023 fiscal years
The Board of Directors, further to a proposal from the Compensation Committee, sets the compensation for executive and non-executive corporate officers in accordance with the applicable legal provisions and the compensation policy.
3.3.1.1.Compensation of the Chairman of the Board of Directors
3.3.1.1.1.Reminder of the principles of the 2023 compensation policy
The compensation policy setting the structure as well as the principles and criteria defined in order to determine the compensation and all benefits granted to the Chairman of the Board of Directors for the fiscal year ended December 31, 2023, which was 99.79% approved at the Company’s General Meeting held on May 30, 2023 pursuant to the 12th resolution, is set out in the Company’s 2022 Universal Registration Document, in Section 3.3.4.1 “Compensation policy for corporate officers”, and more specifically in Section 3.3.4.1.2. “Compensation policy for the Chairman of the Board of Directors”.
It should be noted that, in a summarized form, as in previous years, the 2023 compensation policy for the Chairman of the Board of Directors provided for fixed compensation, benefits in kind and social protection schemes.
The Chairman of the Board of Directors’ compensation, for the 2022 and 2023 fiscal years, as described below, complies with the compensation policy approved by the shareholders.
3.3.1.1.2.Compensation paid during the 2023 fiscal year or granted for the same fiscal year
3.3.1.1.2.1. Fixed annual compensation
On February 17, 2023, the Board of Directors, on the recommendation of the Compensation Committee, decided, subject to the adoption of the 2023 compensation policy by the Company’s General Meeting, to maintain the annual fixed compensation of the Chairman of the Board unchanged at €300,000. This has remained unchanged since 2017.
The fixed annual compensation of the Chairman of the Board of Directors, net of benefits in kind related to the provision of an assistant for his activities other than those relating to the chairmanship of FORVIA, amounted to €265,200 (excluding benefits in kind and social protection described thereafter). It was paid in full in 2023.
3.3.1.1.2.2. Benefits in kind and social protection
In addition to the provision of a personal assistant for activities other than those related to the chairmanship of FORVIA for an amount valued at €34,800 (which is included in the above mentionned €300,000), the Chairman of the Board of Directors was provided with a company car. This benefit is valued at €6,624.
It is finally specified that the Company paid €4,765 in consideration of the supplementary health/life/disability pension scheme.
3.3.1.1.2.3. Other components of compensation
With the exception of the components described above, the Chairman of the Board of Directors did not receive any other compensation (including compensation for his duties as Board member), including by a company comprised in the scope of consolidation of the Company within the meaning of Article L. 233-16 of the French Commercial Code.
3.3.1.1.3.Compensation paid during the 2022 and 2023 fiscal years or granted for the same fiscal years
The tables below present the compensation and benefits paid during the 2022 and 2023 fiscal years or granted for these fiscal years to the Chairman of the Board of Directors.
It is stipulated that, since the Chairman of the Board of Directors receives only fixed compensation as well as benefits in kind and has social protection schemes, to the exclusion of any other compensation, tables No. 4 to No. 7 and No. 10 provided for by the AFEP-MEDEF Code and AMF recommendation No. 2021-02 are not applicable.
Summary of compensation and options and shares granted to Michel de Rosen
Table No. 1 (AFEP-MEDEF Code and AMF recommendation No. 2021-02)
Summary of compensation payable to Michel de Rosen
Table No. 2 (AFEP-MEDEF Code and AMF recommendation No. 2021-02)
(gross in €)
Full-year 2022
2023 fiscal year
Amount granted
Amount
paidAmount granted
Amount
paidFixed compensation
265,200
265,200
265,200
265,200
Annual variable compensation
-
-
Multi-annual variable compensation
-
-
Exceptional compensation
-
-
Compensation awarded as a Board member
-
Benefits in kind(1)
46,116
46,116
46,189
46,189
Total
311,316
311,316
311,189
311,189
- ( 1 )This figure includes the provision of an assistant, the provision of a vehicle (€6,624 for the 2022 fiscal year and €6,624 for the 2023 fiscal year) and also social protection (€4,692 for the 2022 fiscal year and €4,765 for the 2023 fiscal year).
Table No. 11 (AFEP-MEDEF Code and AMF recommendation No. 2021-02)
Employment contract
Supplementary pension scheme
Compensation or benefits due or that may be due on termination or change in position
Compensation due under a non-competition clause
Yes
No
Yes
No
Yes
No
Yes
No
Name: Michel de ROSEN
Position: Chairman of the Board of Directors since May 30, 2017
Corporate office end date: 2024 GM
No
No
No
No
3.3.1.2.Compensation of the Chief Executive Officer
3.3.1.2.1.Reminder of the principles of the 2023 compensation policy
The compensation policy setting the structure as well as the principles and criteria established to determine the compensation and all benefits granted to the Chief Executive Officer for the fiscal year ended on December 31, 2023, which was 92.66% approved by the Company’s General Meeting of May 30, 2023 in the 13th resolution, appears in the Company’s 2022 Universal Registration Document in Section 3.3.4.1 “Compensation policy for corporate officers”, and more specifically in Section 3.3.4.1.3. “Compensation policy for the Chief Executive Officer”.
The compensation policy for the Chief Executive Officer for 2023 therefore provided for the following:
- ■a fixed annual compensation;
- ■a variable annual compensation, subject to performance conditions and representing up to a maximum of 180% of the fixed annual compensation;
- ■a long-term compensation in the form of free share allocations subject to presence and performance conditions;
- ■termination payment;
- ■an indemnity in return for a non-compete commitment;
- ■a notice period and a non-poaching/non-solicitation commitment;
- ■additional defined contributions and benefits pension schemes;
- ■benefits in kind and social protection;
- ■a compensation for his duties in the Shareholder Committee of HELLA.
The Chief Executive Officer’s compensation for the 2023 fiscal years, as described below, is compliant with the compensation policy as approved by the shareholders.
3.3.1.2.2.Compensation paid during the 2023 fiscal year or granted for the same fiscal year
Compensation of the Chief Executive Officer in 2023
Fixed annual compensation
Variable annual compensation
Long-term variable compensation
Other components
Policy:
€1,100,000
Implementation:
€1,100,000
Policy
0-180% of fixed annual compensation
Quantifiable Criteria
from 0 to 142.5% of the fixed annual compensation (75% at target)
Net-debt-to-EBITDA ratio and synergies in relation to HELLA integration (60% at target) + Carbon Neutrality (15% at target)
- Individual criteria
- from 0 to 37.5% of the fixed annual compensation (25% at target)
Implementation: 1,782,921 € of which:
- •Quantifiable: 1,443,750 €
- •Qualitative: 339,171 €
Policy
0-250% of fixed annual compensation
Performance shares subject to presence and performance conditions
- •Internal conditions relating to operating income (20%) and net cash flow (25%)
- •Internal condition related to gender diversity (10%)
- •Internal condition relating to the reduction of CO2 emissions (15%)
- •External condition related to growth in net EPS vs benchmark (30%)
Implementation:
- •Performance share plan no. 15
- •Allocation: 236.69% of fixed annual compensation(1)
- •Severance indemnity (24 months)*
- •12-month non-compete covenant in case of resignation, with a 6-month indemnity*
- •6-month notice period in case of resignation*
- •12-month non-solicitation covenant*
- •Defined benefits pension of vesting rights (1.2% rights acquired in 2022)
- •Benefits in kind and social protection (€29 310 paid)
- •Compensation for his duties in the Shareholder Committee of HELLA
* No payments in 2023

SHORT TERM
LONG TERM
- ( 1 )Percentage calculated on the basis of valuation of the shares (allocated to Patrick Koller under plan no. 15) according to the method used for the consolidated financial statements (IFRS 2 expense)
The 2023 fiscal year was marked by the continuation of the transformation of the Group in a context which remained tense in the automotive sector. The Company has carried on the necessary actions in terms of deleveraging trajectory, improvement of the operating income, protection of cash and make fixed costs more flexible . The Group has thus executed its strategy related to the sale of assets as per the plan submitted to Shareholders and advanced the various synergy programs following the consolidation of HELLA. It has in addition pursued its ambitious carbon neutrality plan, which has produced effects in all the Group's sectors and geographies.
These achievements are reflected in the compensation of the Chief Executive Officer in 2023, a significant part of which is based on the Group's performance, in particular for the short-term and long-term variable aspects.
3.3.1.2.2.1. Fixed annual compensation
On February 17, 2023, the Board of Directors, on the recommendation of the Compensation Committee, decided, subject to the adoption of the 2023 compensation policy by the Company’s General Meeting, to maintain the fixed annual compensation of the Chief Executive Officer unchanged.
As a result, the fixed annual compensation of the Chief Executive Officer amounted to €1,100,000 for the 2023 fiscal year. This amount was paid in full in 2023.
3.3.1.2.2.2. Variable annual compensation
On the recommendation of the Compensation Committee, the Board of Directors set the procedures for determining the variable compensation of the Chief Executive Officer for 2023, in accordance with the 2023 compensation policy approved by the shareholders.
The table below summarizes the results of the analysis carried out by the Board of Directors on February 16, 2024, on the recommendation of the Compensation Committee, and assesses the levels of achievement of the quantifiable and qualitative criteria targets set in respect of the variable annual compensation for the fiscal year ended December 31, 2023: (note on the basis of the pre-estimate presented in December)
Relative weight of each performance criterion
Minimum(1)
Target objective(1)
Maximum(1)
Achievement level
Amount in cash
(€)
Assessment
Quantifiable (distribution of criteria on a 100% basis): from 0% to 142.50% of fixed annual compensation
FORVIA Net-debt-to-EBITDA ratio (50%)
0%
100%
190%
167.50%
921,250
Exceeded targets for the execution of the deleveraging strategy over 2023, the deployment of the Faurecia/HELLA synergy plan with quantifiable impacts over 2023, and the achievement of the carbon neutrality path objectives.
FORVIA Synergies (10%)
0%
100%
190%
190%
209,000
Quantifiable environmental criteria relating to carbon neutrality (15%)
0%
100%
190%
190%
313,500
Total Quantifiable
-
-
-
175%
1,443,750
Individual (distribution of criteria on a 100% basis): 0% to 37.5% of fixed annual compensation
Order intake at FORVIA level associated with operating income and reduction of fixed costs (25%)
0%
100%
150%
123.30%
339,171
Achievement of 2023 order intake targets, with associated margin and fixed costs reduction.
Total INDIVIDUAL
-
-
-
123.30%
339,171
Total
-
-
-
162.08%
1,782,921
-
- ( 1 )The quantified amount of the objectives of the quantifiable criteria are not made public for confidentiality reasons.
- ■quantifiable criteria:
- ■the criterion relating to the net debt to EBITDA ratio was defined by the Board of Directors with reference to the deleveraging trajectory following the acquisition of HELLA, and the targets were set in the Group's budget. Achievement was measured at June 30, 2023 and December 31, 2023, and the Board of Directors noted that the objectives had been reached at 167.50%,
- ■the criterion relating to synergies from the integration of HELLA was defined by the Board of Directors with reference to the HELLA integration plan and the expected financial synergies at the level of the consolidated Group, and the objectives were set in the Group budget. Achievement was measured at December 31, 2023, and the Board of Directors noted that the objectives had been reached to the maximum extent possible,
- ■the environmental criterion linked to carbon neutrality has been defined by the Board of Directors with reference to the trajectory for achieving the Group's commitments for 2025 and in line with the intermediate stage of 2023, as specified in the "sustainability-linked financing framework". Achievement was measured as of December 31, 2023 and the Board of Directors noted that the Group had reached its maximum target, with 27.3 tons of CO2 issued per € million of revenue;
- ■individual criterion: given the objectives set and the results obtained, 123.30% of the individual criterion was met. The elements taken into account are detailed below:
- ■the amount of new orders in € was overachieved at Forvia level; operating margins associated with these orders were higher than the Forvia budgets set by the Board of Directors.
- ■the amount of fixed costs reduction has been achieved in accordance with the budget objective set by the Board of Directors.
After examining the rate of achievement of the objectives of the criteria for the variable annual compensation for the 2023 fiscal year, the Board of Directors of February 16, 2024, noted that the total amount of the variable annual compensation for 2023 amounts to € 1,782,921, compared to €1,980,000 for the 2022 fiscal year (and €300,000 for the 2021 fiscal year). Taking into account the amount of variable annual compensation for fiscal year 2023 resulting from outperformance relative to the quantifiable criteria, the relative proportion of fixed and variable annual compensation for fiscal year 2023 is as follows: 38% for fixed annual compensation and 62% for variable annual compensation.
In accordance with the provisions of Article L. 22-10-34 of the French Commercial Code, the variable compensation for the fiscal year ended December 31, 2023, shall be paid only after the shareholders, in a General Meeting to be held on May 30, 2024, have approved the components of compensation paid during the course of the 2023 fiscal year or awarded in respect of this fiscal year to Patrick Koller, Chief Executive Officer.
It is also acknowledged that the payment of Patrick Koller’s variable annual compensation for the 2022 fiscal year, which amounted to €1,980,000 was, in accordance with the law, subject to a favorable vote at the General Meeting of May 30, 2023, on the components of compensation paid or awarded in respect of the 2022 fiscal year (10th resolution). Since the vote in favor of this resolution was 84.27%, the payment of Patrick Koller’s variable annual compensation for the 2022 fiscal year was made after this General Meeting.
3.3.1.2.2.3. Performance shares
Introductory information: Plan delivered in 2023/Plan for which the performance assessment took place in 2023/Plan for which the performance conditions are set by reference to the 2023 fiscal year
The Board of Directors, at a meeting held on October 9, 2019, on a recommendation from the Compensation Committee, resolved to grant a maximum of 1,147,260 performance shares, including 56,220 to Patrick Koller (Chief Executive Officer). In addition to a condition of presence, this grant is subject to (i) an external condition of net earnings per share assessed between the 2018 fiscal year and the 2021 fiscal year, by comparison with a reference group of global automotive suppliers, weighting 30%, (ii) an internal condition related to the Group net income (after tax) at December 31, 2021, weighting 60% and (iii) a CSR internal condition related to gender diversity within the “Managers and Professionals” category (Group executives), weighting 10%.
At its meeting of February 18, 2022, the Board of Directors noted, on the recommendation of the Compensation Committee (i) the non-achievement of the quantified objectives of the internal condition related to the Group’s net income (after tax) as assessed at December 31, 2021 (weighting of 60%) and (ii) the achievement of 115% of the internal CSR condition linked to gender balance within the “Managers and Professionals” category at December 31, 2021.
At its meeting of April 21, 2022, the Board of Directors noted, on the recommendation of the Compensation Committee, the non-achievement of the external condition linked to the net earnings per share of plan no. 11.
As a consequence and given the decision made by the Board of Directors on July 22, 2022, to proceed to an adjustment of the number of unvested rights to free shares related to the Performance Share Plans (as a result of the capital increase carried out by the Company in June 2022), the number of performance shares that has therefore been delivered to the Chief Executive Officer on October 9, 2023 is 5,365 shares.
The conditions for the definitive vesting of these shares, set out in the summary table below, are described in more detail in chapter 5 “Capital stock and shareholding structure”, section 5.2.2 of the 2022 Universal Registration Document. In accordance with the term of plan No. 11, 70,843 shares were delivered to the beneficiaries concerned on October 9, 2023, including 5,365 shares to the Chief Executive Officer.
The Board of Directors, at a meeting held on October 22, 2020, on a recommendation from the Compensation Committee, resolved to grant a maximum of 1,384,630 performance shares, including 61,140 to Patrick Koller (Chief Executive Officer).
In view of the decision of the Board of Directors on July 22, 2022, to adjust the rights to free shares subject to performance conditions not yet vested (as a result of the capital increase carried out by the Company in June 2022), the maximum number of performance shares now granted to Patrick Koller,under plan no. 12, has been adjusted to 65,958 .
In addition to a condition of presence, this grant is subject to (i) an external condition of net earnings per share assessed between the 2019 fiscal year and the 2022 fiscal year, by comparison with a reference group of global automotive suppliers, weighting 30%, (ii) an internal condition related to the Group net income (after tax) as of December 31, 2022, weighting 60% and (iii) a CSR internal condition related to gender diversity within the “Managers and Professionals” category (Group executives), weighting 10%.
The impact of the integration of HELLA into FORVIA's accounts as from 2022, as well as exceptional events such as the war in Ukraine and the level of vehicle production, have been restated from the internal target criterion for net income after tax under plan no. 12 by decision of the Board of Directors on July 22, 2022, while maintaining the same trajectory curve.
At its meeting of April 13, 2023, the Board of Directors noted, on the recommendation of the Compensation Committee (i) the achievement of 94.7% of the quantified objectives of the internal condition related to the Group’s net income (after tax) as assessed at December 31, 2022 (weighting of 60%), (ii) the achievement of 127.9% of the internal CSR condition linked to gender balance within the “Managers and Professionals” category at December 31, 2022 and (iii) the non-achievement of the external condition related to net earnings per share.
As a consequence and given the decision made by the Board of Directors on July 22, 2022, to proceed to an adjustment of the number of unvested rights to free shares related to the Performance Share Plans (as a result of the capital increase carried out by the Company in June 2022), the number of performance shares that will therefore be delivered to the Chief Executive Officer in October 2024 will be 35,312 shares.
The Board of Directors, at a meeting held on October 25, 2021, on a recommendation from the Compensation Committee, resolved to grant a maximum of 1,389,000 performance shares, including 96,150 to Patrick Koller.
In view of the decision of the Board of Directors on July 22, 2022, to adjust the rights to free shares subject to performance conditions not yet vested (as a result of the capital increase carried out by the Company in June 2022), the maximum number of performance shares now granted to Patrick Koller has been adjusted to 103,727 under plan no. 13.
On July 26, 2023, the Board of Directors decided to adjust the net income after tax objective of plan no. 13 while maintaining the same achievement curve, in order to take into account the exceptional circumstances related to the integration and financing of the acquisition of HELLA, inflation, the impact of the ecological transition, and restructurings.
At its meeting of February 16, 2024, the Board of Directors noted, on the recommendation of the Compensation Committee (i) the achievement of 58.3% of the quantified objectives of the internal condition related to the Group’s net income (after tax) as assessed at December 31, 2023 (weighting of 60%), (ii) the achievement of 130% of the internal CSR condition linked to gender balance within the “Managers and Professionals” category at December 31, 2023.
The achievement of the external condition of net earnings per share of plan no. 13 will be assessed by the Board of Directors at its meeting reviewing the first quarter 2024 sales.
Executive Super Performance Initiative (ESPI) Plan awarded in 2021 – second tranche assessment in 2023
The Board of Directors, at a meeting held on July 23, 2021, on a recommendation from the Compensation Committee, resolved to grant a maximum of 673,549 performance shares, including 71,941 to Patrick Koller (Chief Executive Officer).
The definitive vesting of these free shares to Patrick Koller (Chief Executive Officer) is subject to the following two conditions:
- ■50% of the rights subject to a condition of Annual Relative Total Shareholder Return (TSR), with a level of achievement noted each year, over a period of five years, giving rise to a maximum annual partial vesting of 20% of the tranche of the year in question. The total amount of the definitive grant under the Annual Relative TSR will be equal to the sum of the five years of partial vesting of the Annual Relative TSR;
- ■50% of the rights subject to a condition of Average Relative Five-Year TSR, not giving rise to any partial vesting, the level of realization being calculated at the end of the five-year reference period and taking into account all the Relative Annual TSR of the period.
In view of the decision of the Board of Directors on July 22, 2022, to adjust the rights to free shares subject to performance conditions not yet vested (as a result of the capital increase carried out by the Company in June 2022), the maximum number of performance shares now granted to Patrick Koller, under the ESPI plan, has been adjusted to 77,610 .
At its meeting of July 26, 2023, the Board of Directors, on the recommendation of the Compensation Committee, noted the non-fulfillment of the second tranche of the annual relative Total Shareholder Return (TSR) condition. Consequently, the maximum number of shares remaining for Patrick Koller (Chief Executive Officer) is 62,088.
The conditions for the definitive vesting of these shares described above, as well as the consequence of the neutralization of the capital increase carried out by the Company in June 2022, are set out in Chapter 5 "Capital stock and shareholding structure", section 5.2.2 "Potential capital stock" of this Universal Registration Document.
The table below summarizes, for the three Plans No. 11 to 13, described above, the maximum number of shares to be allocated to the Chief Executive Officer, the rate of achievement of the performance conditions, the rate of vesting and the number of shares delivered (or to be delivered) to the Chief Executive Officer; The features of plan no. 14 (and the number of performance shares allocated to the Chief Executive Officer under this plan) are detailed in Chapter 5.
Plan no. 11
Plan no. 12
Plan no. 13
Maximum number of shares initially allocated
56,220
61,140
96,150
Maximum number of shares after capital increase adjustment of June 2022
60,651
65,958
103,727
Achievement rate of performance conditions
Internal condition of net income: 0%
Internal CSR gender equality condition: 115%
External condition: 0%
Internal condition of net income: 94.7%
Internal CSR gender equality condition: 127.9%
External condition: 0%
Internal condition of net income: 58.3%
Internal CSR gender equality condition: 130%
External condition: assessed by the Board of Directors at its Q1 2024 sales meeting
Rate of allocation (vesting)
11.5%
69.6%
Number of shares delivered (or to be delivered) to the Chief Executive Officer
4,973
32,732
-
Number of shares delivered (or to be delivered) to the Chief Executive Officer after adjustment related to the capital increase of June 2022
5,365
35,312
-
Plan awarded in 2023
Plan no. 15 awarded
At a meeting held on July 26, 2023, the Board of Directors, on a recommendation from the Compensation Committee, resolved, on the basis of the 22nd resolution of the General Meeting of May 30, 2023, to grant a maximum of 2,116,540 performance shares, of which 146,270 performance shares (i.e., 0.07% of the capital stock at December 31, 2023) to Patrick Koller (Chief Executive Officer).
The valuation of the maximum grant, according to the standards used for the consolidated financial statements, amounts to €2,603,606, i.e. 236.69% of the reference fixed compensation.
The internal and external conditions of plan no. 15 as well as the objectives are presented in the table below:
Relative weight of each performance criterion(1)
Minimum
Target objective
Maximum
Assessment
Internal condition: Group operating income (scope of consolidation) for the fiscal year ended December 31, 2025, as approved by the Board of Directors (“2025 Operating Income”), compared with the income forecast for the same fiscal year by the Group's strategic plan (“SP Operating Income”).
Weighting: 20%
Operating Income 2025 = 90% of the SP Operating Income target
Operating Income 2025 = SP Operating Income target
Operating Income 2025 ≥ 110% of the SP Operating Income target
For all conditions:
- ■between the thresholds, linear progression;
- ■assessment of performance at the beginning of the 2026 fiscal year.
Internal condition: Group net cash flow (scope of consolidation) for the fiscal year ended December 31, 2025, as approved by the Board of Directors (“net cash flow for 2025”), compared with the result forecast for the same fiscal year by the Group's strategic plan (“SP net cash flow”).
Weighting: 25%
Net cash flow 2025 = 90% of the net cash flow target
Net cash flow 2025 = net cash flow target
Net cash flow 2025 ≥ 110% of the net cash flow target
Internal condition: Gender balance (% of women) in the Group’s “Managers and Professionals” category of Faurecia Group at December 31, 2025 compared to the target set by the Board of Directors.
Weighting: 10%
- 1 point
100% of the target
≥ + 2 points
Internal condition: Reduction in CO2 emissions, measured in “tCO2e” for “scopes 1 & 2” per € million of sales produced within the consolidated Group scope for the fiscal year ended December 31, 2025, compared to CO2 emissions in 2019 (adjusted for scope effects)
Weighting: 15%
- 5 point
100% of the target
≥ + 5 points
External condition: Level of growth in FORVIA’s net earnings per share between the 2022 and 2025 fiscal years (“FORVIA EPS”), and assessed against the weighted growth of a reference group comprised of 12 comparable international automotive suppliers(2) (“Benchmark EPS”).
Weighting: 30%
Hypothesis 1: Benchmark EPS ≤ - 20% (therefore negative)
FORVIA EPS = 125% Benchmark EPS
Hypothesis 2:
- 20% < Benchmark EPS <+ 20%
FORVIA EPS = Benchmark EPS - 5%
Hypothesis 3: Benchmark EPS ≥ + 20%
FORVIA EPS = 75% Benchmark EPS
Hypothesis 1: Benchmark EPS ≤ - 20% (therefore negative) /
Hypothesis 2: - 20% <Benchmark EPS < + 20% /
Hypothesis 3: Benchmark EPS
≥ + 20%
FORVIA EPS = Benchmark EPS
Hypothesis 1: Benchmark EPS ≤ - 20% (therefore negative)
FORVIA EPS ≥ 75% Benchmark EPS
Hypothesis 2: - 20% < Benchmark EPS < + 20%
FORVIA EPS ≥ Benchmark EPS + 5%
Hypothesis 3: Benchmark EPS ≥ + 20%
FORVIA EPS ≥ 125% Benchmark EPS
- ( 1 )The numerical targets of the internal conditions (and more specifically those of the internal condition linked to operating income and net cash flow) are not made public for confidentiality reasons.
- ( 2 )The reference group consists (to date) of the following European and North American automotive suppliers: Adient, Aptiv (formerly Delphi), Autoliv, Autoneum, Borg Warner, Continental, Dana Incorporated, Lear, Magna, Plastic Omnium, Schaeffler, Valeo.
In case of deviation in the volumes of the worldwide automobile production compared to the Company's strategic plan figures for the year in question, the Board of Directors shall have the possibility to adjust mechanically the objectives of the internal financial criteria. This possibility is detailed in Chapter 5 “Capital stock and shareholding structure”.
An attendance condition (subject to standard exceptions) applies to all beneficiaries including the Chief Executive Officer. The vesting is completed after a four-year vesting period, it being stipulated that no holding period is stipulated by the plan.
The Chief Executive Officer must retain, in registered form and while he continues to hold office, at least 30% of all shares actually acquired under each plan. This percentage threshold requirement ceases to apply when the Chief Executive Officer holds a number of shares corresponding to three years of base gross compensation, factoring in all the previously established plans, and becomes applicable again if the Chief Executive Officer no longer holds the number of target shares corresponding to this level of base gross compensation. As of the date of this Universal Registration Document, the Chief Executive Officer holds 154,751shares.
In accordance with the AFEP-MEDEF Code, Patrick Koller (Chief Executive Officer) has made a formal commitment not to use any risk hedging transactions on the performance shares granted to him.
3.3.1.2.2.4. Pension plans
The Chief Executive Officer benefits from the same pension scheme as the one provided for the other members of the Group’s Executive Committee with a French contract. This plan includes a supplementary defined contributions pension scheme and a supplementary defined benefits pension scheme.
The main features of these schemes are described in the summary table below, being reminded that following the freezing of past potential rights under defined benefits pension schemes governed by Article L. 137-11 of the French Social Security Code, complying with Law No. 2019-486 of May 22, 2019 and Order No. 2019-687 of July 3, 2019 transposing the directive on pension rights’ portability, the Group implemented two vested rights supplementary pension schemes for rights relating to periods of employment after January 1, 2020 that comply with the new legal requirements set out in Article L. 137-11-2 of the French Social Security Code.
Defined contribution pension scheme
Defined benefit plan (frozen – all tranche C executives)
Specific supplementary pension scheme (frozen – members of the Executive Committee France)
Specific supplementary Defined benefit plan of vesting rights subject to performance conditions (members of the Executive Committee France)
Defined benefit plan of vesting rights and under performance conditions (all tranche C executives)
Applicable law
Article 83 of the French General Tax Code
Articles 39 of the French General Tax Code and L.137-11 of the French Social Security Code
Articles 39 of the French General Tax Code and L.137-11 of the French Social Security Code
Article L. 137-11-2 of the French Social Security Code
Article L. 137-11-2 of the French Social Security Code
Authorization of the benefits
BoD of July 25, 2016
GM of May 30, 2017
BoD of July 25, 2016
GM of May 30, 2017
BoD of July 25, 2016
GM of May 30, 2017
BoD of April 17, 2020
GM of June 26, 2020 (as part of the ex-ante vote on the compensation policy for the Chief Executive Officer) – Pending implementation with retroactive effect as of January 1, 2020
Board meeting of February 19, 2021
GM of May 31, 2021
Scheme entry conditions and other conditions giving entitlement to benefit from it
One year’s seniority in the Group at the time of retirement
- ■Having an employment contract or a position as a corporate officer and a five years’ seniority in the Group at the time of retirement
- ■Ending a career within the Group
- ■Having an employment contract (active or suspended) or a position as a corporate officer in France
- ■Three-year’s seniority within FORVIA’s Executive Committee as from January 1, 2015
- ■Ending a career within the Group
- ■Being a member of FORVIA’s Executive Committee
- ■Having an employment contract (active or suspended) or a position as a corporate officer in France
- ■Three years seniority within FORVIA's Executive Committee
- ■Having an employment contract (active or suspended) or a position as a corporate officer in France
- ■Have a gross annual remuneration of more than four times the PASS
- ■Minimum contribution period of two years for the definitive acquisition of rights
Method for determining the reference compensation used to calculate entitlements
Contributions to tranche A and tranche B of the current year (amount of contributions paid by the Company in 2023: €8,358.48
Average over the three years preceding the liquidation of the rights of compensation in tranche C, which, in 2023, corresponds to €175,968
Average over the three years preceding the liquidation of the rights of the total compensation (basic and variable) excluding exceptional items
Gross salary within the meaning of Article L. 242-1 of the French Social Security Code (basic and variable, excluding exceptional items) received during the year of Executive Committee membership
Portion of gross annual compensation (gross annual base compensation, gross annual variable compensation, benefits in kind and hardship allowance paid to the beneficiary during the year in question) between four and eight times the PASS
Vesting formula
1% of the compensation in tranche A and 6% of the compensation in tranche B
1% of the compensation in tranche C and performance conditions linked to the degree of the achievement of variable compensation targets(1)
Depending on Faurecia’s performance, from 1 to 3% of total compensation (base + variable), excluding special compensation(2)
From 0 to 3% of the annual reference compensation depending on the achievement of performance conditions(3)
For beneficiaries whose compensation exceeds eight times the PASS and for corporate officers, the vesting percentage is between 0 and 0.50% depending on the achievement of performance conditions(6). This percentage may be as high as 0.75% for beneficiaries of this plan who are also potential beneficiaries of the former “Article 39” plan and whose rights have been frozen(7)
Ceiling, amount or terms and conditions for determining it
Not applicable
- ■According to the leaving age, between 65-70% of the average salary of the last three years
- ■Eight times the annual French social security ceiling
- ■The total retirement amounts paid by FORVIA must be less than 25% of the reference compensation
- ■In addition, the replacement rate across all pension schemes (mandatory and specific) must also be less than 45%
- ■Yearly ceiling rights: 3%
- ■Vesting rights ceiling: 30 points
- ■The amount of retirement pensions paid by the Group is capped at eight annual social security ceilings
- ■The sum of the rights vested under the supplementary plans provided by the Group must be less than 25% of the average annual reference compensation received over the last three calendar years
- ■Yearly ceiling rights: 3%
- ■Vesting rights ceiling: 30 points
- ■Ceiling of 70% of the average annual gross remuneration received during the three calendar years preceding retirement for beneficiaries of the Article L. 137-11 regime of the Social Security Code
Ceiling, amount or terms and conditions for determining it
- ■The annual amount of retirement pensions paid under the Group’s mandatory plans and specific plans must be less than 45% of the average annual gross reference compensation received during the three calendar years preceding the date of termination of employment or the departure from the Executive Committee
Funding of rights
Outsourced
Outsourced
Outsourced
Outsourced
Outsourced
Estimated amount of the pension for the Chief Executive Officer at the end of the fiscal year
€5,024 annual(8)
€24,266 annual(4)
€169,007 annual(5)
€109,200 annual(8)
€1,955 annual(8)
Associated tax and payroll expenses
Not applicable
Tax on annuity
Tax on contribution
Contribution of 29.7%
Contribution of 29.7%
- ( 1 )For the Chief Executive Officer, if the annual variable compensation targets are achieved: (i) up to 80% or more, a 1% increase in potential rights (limited to tranche C of the compensation) will be vested for the period in question and (ii) less than 80%, the increase in rights will be reduced in proportion to the achievement of the objectives (e.g.: a target achieved at 30% will result in a 0.30% increase in potential rights).
- ( 2 )For the Chief Executive Officer and members of the Executive Committee (France), the level of annual pension is determined according to the Company’s operating income, in relation to the budget, as approved by the Board of Directors on the basis of the following formula: ∑ Xi × R where R = annual reference compensation and Xi = rights granted for each year of seniority, i being equal to (i) 3% if the operating income for the year is greater than 105% of the budgeted operating margin, (ii) 2% if the operating margin for the year is between 95 and 105% of the budgeted operating margin, and (iii) 1% if the operating margin for the year is lower than 95% of the budgeted operating margin.
- ( 3 )For the Chief Executive Officer and the members of the Executive Committee (France), the level of annual pension is calculated according to the following formula: ∑ Xi × R where R = annual reference compensation and Xi = annual entitlement granted on the basis of an annual annuity for each year of service in the plan, i being equal to the sum of the rights granted on the basis of the following criteria:
- based on the Group net debt to EBITDA ratio:
- ●1.5% if the net debt to EBITDA ratio for the year is strictly greater than 100% of the set objective;
- ●1.0% if the net debt to EBITDA ratio for the year is between 90% and 100% of the set objective;
- ●0.5% if the net debt to EBITDA ratio for the year is between 75% and 90% of the set objective;
- ●0% if the net debt to EBITDA ratio for the year is strictly lower than 75% of the set objective.
- based on the synergies in relation to HELLA integration:
- ●0.3% if the amount of synergies in relation to HELLA integration is strictly greater than 100% of the set objective;
- ●0.2% if the amount of synergies in relation to HELLA integration is between 90% and 100% of the set objective;
- ●0.1% if the amount of synergies in relation to HELLA integration is between 75% and 90% of the set objective;
- ●0% if the amount of synergies in relation to HELLA integration is strictly lower than 75% of the set objective.
- based on the CO2 Carbon neutrality:
- ●0.45% if the reduction of CO2 emissions is strictly greater than 100% of the set objective;
- ●0.3% if the reduction of CO2 emissions is between 90% and 100% of the set objective;
- ●0.15% if the reduction of CO2 emissions is between 75% and 90% of the set objective;
- ●0% if the reduction of CO2 emissions is strictly lower than 75% of the set objective.
- based on the level of achievement of individual objectives composing the individual part of annual variable compensation (FVC) targets:
- ●0.75% if the achievement of the individual objectives is strictly greater than 100%;
- ●0.5% if the achievement of the individual objectives is between 90% and 100%;
- ●0.25% if the achievement of the individual objectives is between 75% and 90%;
- ●0% if the achievement of the individual objectives is strictly lower than 75%.
- The vesting of rights is the sum of the achievement of each of the criteria
- At its meeting of February 16, 2024, the Board of Directors, on the recommendation of the Compensation Committee, assessed the levels of achievement in relation to the objectives set and noted the maximum achievement of the four criteria, representing an acquisition of rights of 3.0% for the year ended December 31, 2023.
- ( 4 )Seniority starting from December 18, 2006.
- ( 5 )Seniority starting from January 1, 2015.
- ( 6 )Based on the level of achievement of annual variable compensation (FVC) targets:
- ●0.50% if the level of achievement of the annual variable compensation targets is strictly higher than 100%;
- ●0.30% if the level of achievement of the variable annual compensation targets is between 95% (strictly higher than 95% and 100% of the objective);
- ●0.10% if the level of achievement of the variable annual compensation targets is between 75% and 95% of the objective;
- ●0% if the level of achievement of the annual variable compensation targets is lower than 75% of the objective.
- ( 7 )Based on the level of achievement of annual variable compensation (FVC) targets:
- ●0.75% if the level of achievement of the annual variable compensation targets is strictly higher than 100%;
- ●0.55% if the level of achievement of the variable annual compensation targets is between 95% (strictly higher than 95% and 100% of the target);
- ●0.35% if the level of achievement of the annual variable compensation targets is between 75% and 95% of the objective;
- ●0% if the level of achievement of the annual variable compensation targets is lower than 75% of the objective.
- ( 8 )Vested rights December 31,2023
Further information on these pension schemes can be found in Note 25-2 to the consolidated financial statements.
3.3.1.2.2.5. Termination payment
Patrick Koller (Chief Executive Officer) benefits from a termination payment of up to 24 months of compensation which was authorized by the Board of Directors on July 25, 2016, pursuant to the procedure of Article L. 225-42-1 of the French Commercial Code (now repealed and reproduced in Articles L. 22-10-4 and L. 22-10-8 of the French Commercial Code) and approved by the General Meeting of May 30, 2017, in respect of its 5th resolution. This payment was adjusted during the review of the Chief Executive Officer’s package by the Board of Directors on February 14, 2020, in order to align the calculation methods for the reference compensation with those of the non-competition clause, and approved in accordance with the law by the General Meeting of June 26, 2020, as part of the vote on the compensation policy for the Chief Executive Officer for 2020 (16th resolution). The conditions of this compensation have remained unchanged since that date.
The terms and conditions of the termination payment granted to the Chief Executive Officer are described in the compensation policy for the Chief Executive Officer for 2023 and 2024, which appear respectively in Sections 3.3.4.1.3 “Compensation policy for the Chief Executive Officer” of the 2022 Universal Registration Document and this Universal Registration Document.
3.3.1.2.2.6. Non-competition indemnity
Since the decision of the Board of Directors of February 14, 2020, Patrick Koller (Chief Executive Officer) is subject to a non-compete commitment for a period of 12 months applicable in the event of his resignation, it being specified that the obligation to pay the compensation due in return for this commitment became effective following the approval, in accordance with the law, by the General Meeting of June 26, 2020 of the 2020 compensation policy for the Chief Executive Officer in respect of the 16th resolution. The conditions of this non-compete commitment remained unchanged in 2023.
The terms of the non-compete commitment, and the related indemnity, to which the Chief Executive Officer is entitled, are described in the compensation policy for the Chief Executive Officer for 2023 and 2024 which appear respectively in Sections 3.3.4.1.3 “Compensation policy for the Chief Executive Officer” of the 2022 Universal Registration Document and this Universal Registration Document.
3.3.1.2.2.7. Notice and non-solicitation
Patrick Koller is subject to six months’ notice in the event of his resignation and has a non-solicitation commitment of 12 months. These provisions were decided by the Board of Directors on February 14, 2020, and became effective following the approval, by the General Meeting of June 26, 2020, of the 2020 compensation policy for the Chief Executive Officer in respect of the 16th resolution. The terms of the notice period and the non-solicitation commitment remained unchanged in 2023.
The terms of the notice period and the non-solicitation commitment are described in the compensation policy for the Chief Executive Officer for 2023 and for 2024 which appear respectively in Sections 3.3.4.1.3 “Compensation policy for the Chief Executive Officer” of the 2022 Universal Registration Document and this Universal Registration Document.
3.3.1.2.2.8. Benefits in kind and social protection
Patrick Koller has been provided with a company car. The total amount of the benefits in kind is €21,850.
It is also specified that the Company paid, in respect of the supplementary medical/life/disability insurance plan, €7,460.
3.3.1.2.2.9. Other components of compensation
With the exception of the items described above, Patrick Koller did not receive any other compensation or benefits (including for his duties as a Company Board member).
For information, Patrick Koller receives compensation for his term of office on the HELLA Shareholders’ Committee (for more information, please refer to the HELLA annual report). Such approach is in line with German corporate standard (notably for listed companies controlled by another listed company).
3.3.1.2.2.10. Taking into account the vote of the last General Meeting
FORVIA has an active engagement policy with its investors and proxy advisory firms during the financial roadshows to discuss governance as well as developments in governance and compensation-related best practices. Numerous meetings were held during the first quarter of 2023, until the General Meeting of 2023, on compensation topics (see section 3.1.2.4. “Governance structure and shareholder dialog” of this Universal Registration Document).
The Board of Directors took their comments into account, in particular with regard to the stability of the compensation structure and the level of the fixed compensation of the Chief Executive Officer (following the increase granted by the General Meeting in 2022). Thus, the fixed compensation of the Chief Executive Officer remained unchanged between 2022 and 2023. Also, for the sake of continuity, the structure of the compensation policy proposed by the Board of Directors for the 2024 financial year remains unchanged (see below the compensation policy for the Chief Executive Officer for 2024).
FORVIA has also taken into account the expectations of its shareholders and voting advisory agencies with regard to the growing importance of Environmental, Social and Governance (ESG) criteria in the assessment of executive performance. A criterion linked to the carbon neutrality trajectory has been integrated into the elements of the short-term variable compensation of the Chief Executive Officer (as well as those of all the beneficiaries of a variable compensation system in the Group) from year 2022, as presented in the 2022 Compensation Policy. FORVIA has also included in its performance share plan no. 11 granted in 2019, an objective related to gender diversity and added a second ESG objective linked to carbon neutrality among the performance conditions applicable to the Performance Share Plan awarded to the Chief Executive Officer in 2023.
3.3.1.2.2.11. Compliance of compensation paid with the compensation policy
The elements of compensation awarded or paid to the Chief Executive Officer are in accordance with the provisions adopted by the Board of Directors, upon recommendation of the Compensation Committee and voted by the General Meeting held on May 30, 2023 (13th resolution adopted with 92.66% of the votes).
The compensation paid contributes to the long-term performance of the Company insofar as the criteria for variable compensation are consistent with the long-term strategy of the Group.
3.3.1.2.3.Compensation paid during the 2022 and 2023 fiscal years or granted for the same fiscal years
The tables below set out the compensation and benefits paid during fiscal years 2022 and 2023 or awarded in respect of these fiscal years to Patrick Koller, the Chief Executive Officer.
To the extent that all stock subscription options ceased to be in force, tables No. 4, No. 5 and No. 8 on options awarded or exercised during the fiscal year as defined by the AFEP-MEDEF Code and AMF recommendation No. 2021-02 are not applicable. This is also the case with regard to table No. 10 of the AFEP-MEDEF Code given that Patrick Koller does not receive multi-annual variable compensation in cash.
Lastly, the tables setting out the past granting of performance shares (table No. 9 of the AFEP-MEDEF Code and table No. 10 of AMF recommendation No. 2021-02) are set out in Chapter 5 “Capital stock and shareholding structure,” Section 5.2.2 “Potential capital stock”.
Summary of compensation and options and shares granted to Patrick Koller
Table No. 1 (AFEP-MEDEF Code and AMF recommendation No. 2021-02)
(in €)
Full-year 2022
2023 fiscal year
Compensation granted for the fiscal year (see table No. 2)
3,102,342
2,912,231
Value of stock options granted during the fiscal year
-
Value of performance shares granted during the fiscal year (set out in table 6)
2,228,170
2,603,606
Value of other long-term compensation plans
-
Total
5,330,512
5,515,837
Summary of Patrick Koller’s compensation
Table No. 2 (AFEP-MEDEF Code and AMF recommendation No. 2021-02)
(gross in €)
Full-year 2022
2023 fiscal year
Amount granted
Amount
paidAmount granted
Amount
paidFixed compensation
1,100,000
1,100,000
1,100,000
1,100,000
Annual variable compensation
1,980,000(3)
300,000(1)
1,782,921(2)
1,980,000(3)
Multi-annual variable compensation
-
-
Exceptional compensation
-
-
Compensation as Board member
-
-
Benefits in kind
22,342(4)
22,342(4)
29,310(4)
29,310(4)
Total
3,102,342
1,422,342
2,912,231
3,109,310
- ( 1 )Amount paid in 2022 in respect of the 2021 fiscal year.
- ( 2 )Amount granted in respect of the 2023 fiscal year, which will be paid subject to a favorable 2023 ex post vote for the Chief Executive Officer at the General Meeting of May 30, 2024.
- ( 3 )Amount paid in 2023 in respect of the 2022 fiscal year further to the approval of the 9th resolution in relation to ex post vote for the Chief Executive Officer at the General Meeting of May 30, 2023.
- ( 4 )Provision of a company car. This figure also includes social protection schemes (€6,964 in respect of the 2022 fiscal year and €7,460 in respect of the 2023 fiscal year).
Performance shares granted to Patrick Koller during the fiscal year
Table No. 6 (AFEP-MEDEF Code and AMF recommendation No. 2021-02)
Number and date of plan
Maximum number of shares granted during the relevant fiscal year(1)
Valuation of shares according to the method used for the consolidated financial statements
(in €)
Vesting date
Availability date
Performance conditions(1)
Plan no. 15 of July 26, 2023
146,270
2,603,606
July 26, 2023
July 26, 2027
Internal condition, linked to the Group net operating income (weighting of 20%)
Internal condition linked to the Group’s net cash flow (weighting of 25%)
Internal condition linked to gender diversity (% of women) within the Group’s “Managers and Professionals” category (weighting of 10%)
Internal condition relating to the reduction of CO2 emissions (weighting of 15%)
External condition linked to weighted growth in FORVIA's net earnings per share (weighting of 30%)
Total
146,270
2,603,606
- ( 1 )Details on the performance conditions as well as the targets set can be found in Section 3.3.1.2.2.3 “Performance shares”.
Performance shares that became available to Patrick Koller during the fiscal year
Table No. 7 (AFEP-MEDEF Code and AMF recommendation No. 2021-02)
Number and date of plan
Number of shares that became available during the fiscal year(1)
Vesting conditions
Plan no. 11 of October 9, 2019
5,365
Patrick Koller must retain, in registered form and while he continues to hold office, at least 30% of all shares actually acquired under each plan. This percentage threshold obligation for each plan ceases to apply once Patrick Koller owns a number of shares that corresponds to three years’ gross base compensation, factoring in all the plans already vested, and will again become applicable in the event that Patrick Koller no longer holds the target number of shares corresponding to this level of base gross compensation.
Total
5,365
- ( 1 )It should be noted that the initial allocation concerned a maximum number of 56,220 shares, increased to 60,651 after adjustment related to the capital increase of June 2022. As a result of the non-fulfillment of the external condition related to net earnings per share compared to the reference group, the non-fulfillment of the internal condition related to the Group’s earnings (before tax), and the achievement of 115% of the internal condition linked to gender equality, the overall vesting rate is 11.5%.
The total maximum number of performance shares outstanding at December 31, 2023, which may vest to Patrick Koller (minus the number of shares already vested) represents a total of 517,227 shares, i.e., 0.26% of FORVIA’s capital at that date. This number is obtained after adjustment related to the capital increase of June 2022.
Table No. 11 (AFEP-MEDEF Code and AMF recommendation No. 2021-02)
Employment contract
Supplementary pension scheme
Compensation or benefits due or that may be due on termination or change in position
Compensation due under a non-competition clause
Name: Patrick Koller
Position: Chief Executive Officer since July 1, 2016
Date of end of corporate office: undetermined, Patrick Koller’s appointment as Chief Executive Officer being without a specified term
No
Yes(1)
Yes(2)
Yes(3)
- ( 1 )The key aspects of the supplementary pension scheme are described in Section 3.3.1.2.2.4 “Pension schemes” of this Universal Registration Document.
- ( 2 )The terms and conditions of the severance payment are described in Section 3.3.4.1.3 “Compensation policy for the Chief Executive Officer” of this Universal Registration Document.
- ( 3 )The terms of the non-compete payment are described in Section 3.3.4.1.3 “Compensation policy for the Chief Executive Officer” of this Universal Registration Document.
3.3.1.3.Information on compensation for executive corporate officers and changes during the last five fiscal years
This paragraph relates specifically to multiples of compensation between the level of compensation of executive corporate officers and the level of average and median compensation of Group employees in France. It also deals with the annual evolution of compensation for executive and non-executive corporate officers and Group employees in France, as well as Group performances’ evolution. Information is presented, for the 2019-2023 period, in accordance with the AFEP guidelines on compensation multiples updated in February 2021. It is also the case for the table on data.
The Group’s governance structure has been composed of a Chairman of the Board of Directors and a Chief Executive Officer.
The corporate office of Chairman of the Board of Directors has been held by Michel de Rosen since May 30, 2017. The corporate office of Chief Executive Officer has been held by Patrick Koller since July 1, 2016.
As for the employees’ scope to be taken into account, FORVIA SE, as the holding company of the Group, and having only seven employees for a total France headcount of 8,824 employees, as of December 31, 2023 it has been decided to take into consideration a more representative scope for the Business Group in France, and to take into account all French legal entities integrated into the Group (HELLA perimeter excluded) from January 1 to December 31(3), according to AFEP-MEDEF Code (§26-2) and AFEP guidelines on compensation multiples, updated in February 2021.
It is specified that the Group’s French headcount only represents, at the end of 2023, 7% of the Group’s total headcount and includes nearly 60% of non-executive employees.
The compensations taken into account in calculations are those French employees of the Group (HELLA perimeter excluded) who were present throughout the entire year in question. The compensation for part-time employees has been recalculated to the full-time equivalent. The components of the compensation used for these ratios have been calculated on the basis of the fixed and variable compensation paid over the course of the fiscal years in question, including incentive plans and profit-sharing, as well as the performance shares granted, to the target, over the same fiscal years and recorded at fair value(4). Short-time working allowances were also taken into account. Only additional pension schemes that represent a posterior benefit to the contract and corporate offices were not taken into account.
The increase of the Chief Executive Officer's compensation in 2023, for the purpose of the equity ratio, is mainly linked to the amount of his annual variable compensation for 2022 paid in 2023, in comparison to previous financial year (2022). This increase in linked to the very good results in terms of transformation of the Group, implementation of the strategy and preservation of financial results as mentioned in sections 3.3.1.2.2. and 3.3.1.2.2.2. of the 2022 Universal Registration Document.
In addition, the performance criterion used to assess Group performance is the operating income. This criterion is established on a consolidated basis.
Table of ratios for I. 6° and 7° of Article L. 22-10-9 of the French Commercial Code
Compensation paid during the fiscal year under review includes variable compensation due for the previous fiscal year
2019 fiscal year
2020 fiscal year
2021 fiscal year
2022 fiscal year
2023 fiscal year
Change (in %) of the compensation(1) for the Chairman of the Board of Directors(2)
0.0%
- 4.3%
4.7%
0.4%
0.0%
Change (in %) in the compensation of the Chief Executive Officer(3)
8.6%
4.7%
24.7%
- 33.8%
63.10%
Information on the scope of the listed company
Change (in %) of employees’ average compensation
The scope of the listed company is not relevant since it only comprises six employees, excluding the Chief Executive Officer. It was deemed more representative to include all of the Group’s French legal entities in the enlarged scope, with the exception of companies that joined or left the Group during the five years in question.
On average, over the five years studied, the scope represents nearly 95% of French employees.
Employee’s average compensation ratio
Change in ratio (in %) versus previous fiscal year
Employees’ median compensation ratio
Change in ratio (in %) versus previous fiscal year
Additional information on a broader scope (French legal entities)
Change (in %) of employees’ average compensation in French legal entities
3.1%
0.2%
6.1%
0.5%
8.6%
Chairman of the Board of Directors
Employee’s average compensation ratio
5.8
5.6
5.5
5.5
5.1
Change in ratio (in %) versus previous fiscal year
- 3.0%
- 4.0%
- 1.4%
- 0.1%
-7.9%
Employees’ median compensation ratio
7.9
7.5
7.7
7.6
7.1
Change in ratio (in %) versus previous fiscal year
- 4.2%
- 4.9%
0.03%
- 2.5%
-6.6%
Chief Executive Officer (CEO)
Employee’s average compensation ratio
70.0
72.4
85(4)
56
84.1
Change in ratio (in %) versus previous fiscal year
5.3%
4.5%
17.4%(4)
- 34.1%
50.2%
Employees’ median compensation ratio
94.6
97.9
120.0(4)
77.1
117.5
Change in ratio (in %) versus previous fiscal year
7.3%
4.6%
22.6%(4)
- 35.7%
52.3%
Group performances
Operating margin (in € millions)(5)
Change (in %) versus previous fiscal year
0.7%
- 67.4%
106.2%
23.1%
35.7%
- ( 1 )Total compensation paid or granted for the fiscal year.
- ( 2 )Michel de Rosen since June 1, 2017.
- ( 3 )Patrick Koller since July 1, 2016.
- ( 4 )Due to the exceptional nature of the single ESPI plan of 2021and to facilitate comparison with previous years, it is specified that the ratios and changes would have been respectively 67.2; - 7.2%; 94.0; and - 4.0% if the value of the ESPI is not taken into account in the Chief Executive Officer’s compensation in 2021.
- ( 5 )Operating income – annual values: 2018: €1,273.9 million; 2019: €1,283.3 million; 2020: €418 million; 2021: €862 millions. 2022: €1,061 million (Faurecia + 11 consolidated months with HELLA; 2023: €1,439 million.
3.3.1.4.Tables summarizing the components of the compensation paid or awarded for the fiscal year just ended to executive corporate officers
The tables below present a summary of the compensation and benefits paid during the 2021 fiscal year or awarded in respect of this same fiscal year to the executive and non-executive corporate officers.
3.3.1.4.1.Summary of the components of compensation paid to the Chairman of the Board of Directors during the 2022 period or awarded in respect of this same period
Components of compensation
Amounts granted in respect of the fiscal year just ended or accounting valuation
Amounts paid during the fiscal year just ended
Presentation
Fixed compensation
€265,200
€265,200
The principles for determining the compensation of Michel de Rosen as Chairman of the Board of Directors, as well as the methods for implementing it (the “2023 Compensation”), are respectively described (i) in the compensation policy for the Chairman of the Board of Directors set out in Section 3.3.4.1.2 “Compensation policy for the Chairman of the Board of Directors” of the 2022 Universal Registration Document and of this Universal Registration Document (the “2023 and 2024 Compensation Policies”) and (ii) in Section 3.3.1.1.2.1 “Fixed annual compensation” of this Universal Registration Document.
The amount of the 2023 fixed annual compensation was set at €300,000 (cap integrating the benefit in kind linked to the provision of a personal assistant).
Annual variable compensation
Not applicable
Not applicable
No annual variable compensation.
Multi-annual variable compensation
Not applicable
Not applicable
No multi-annual variable compensation.
Exceptional compensation
Not applicable
Not applicable
No exceptional compensation.
Stock options, performance shares or any other long-term benefit
Not applicable
Not applicable
No stock subscription or purchase options grant, performance shares, or any other long-term benefits.
Compensation as Board member
Not applicable
Not applicable
No compensation awarded as Board member
All benefits (including social protection)
€46,189 (including accounting valuation of €41,424)
€46,189 (including accounting valuation of €41,424)
The 2023 Compensation is respectively described in (i) the 2022 and 2023 Compensation Policies and (ii) Section 3.3.1.1.2.2 “Benefits in kind and social protection” of this Universal Registration Document.
Termination payment
Not applicable
Not applicable
No termination payment.
Non-competition indemnity
Not applicable
Not applicable
No non-competition indemnity.
Supplementary pension schemes
Not applicable
Not applicable
No supplementary pension scheme benefit.
3.3.1.4.2.Summary of the components of the compensation of the Chief Executive Officer paid during the 2023 fiscal year or awarded for the same fiscal year(5)
Components of compensation
Amounts granted in respect of the fiscal year just ended or accounting valuation
Amounts paid during the fiscal year just ended
Presentation
Fixed compensation
€1,100,000
€1,100,000
The principles for determining the compensation of Patrick Koller as Chief Executive Officer, as well as its implementation methods (the “2023 Compensation”) are respectively described (i) in the compensation policy for the Chief Executive Officer in Section 3.3.4.1.3 “Compensation policy for the Chief Executive Officer” of the 2022 Universal Registration Document (the “2022 Compensation Policy”) and this Universal Registration Document (the “2023 and 2024 Compensation Policies”) and (ii) in Section 3.3.1.2.2.1 “Fixed annual compensation” of this Universal Registration Document.
Annual variable compensation
€1,782,921
(amount to be paid in 2024 subject to a favorable vote by the General Meeting)
€1,980,000 (compensation for the 2022 fiscal year, paid in 2023 following a favorable vote 84.27% by the General Meeting of May 30, 2023, on the components of the compensation paid or awarded for the 2022 fiscal year [10th resolution]).
The 2023 Compensation is respectively described in (i) the 2023 Compensation Policies and (ii) Section 3.3.1.2.2.2 “Variable annual compensation” of this Universal Registration Document.
At a meeting held on February 16, 2024, the Board of Directors, on the recommendation of the Compensation Committee, determined and finalized the total annual variable compensation to be awarded to Patrick Koller (Chief Executive Officer) for the fiscal year ended on December 31, 2023, as follows:
- ■quantifiable criteria (ratio Net debt/EBITDA, synergies related to the integration of HELLA and environmental criterion): 175%, which gives entitlement to €1,443,750;
- ■individual criteria (order intake associated with the operating income): 123.30%, which gives entitlement to €339,171;
- ■total amount: €1,782,921 (compared to €1,980,000 for the 2022 fiscal year and €300,000 for the 2021 fiscal year).
In accordance with the provisions of Article L. 22-10-34 of the French Commercial Code, the variable compensation for the fiscal year ended December 31, 2023, shall be paid only after the shareholders have approved the components of compensation paid during the course of the 2023 fiscal year or awarded in respect of the same fiscal year to Patrick Koller, Chief Executive Officer.
Multi-annual variable compensation
Not applicable
Not applicable
No multi-annual variable compensation.
Exceptional compensation
Not applicable
Not applicable
No exceptional compensation.
Stock options, performance shares or any other long-term benefit
Options = not applicable
Performance shares = €2,603,606 calculated on the maximum number of shares granted under plan no. 15.
Options = not applicable
Performance shares = not applicable
No stock subscription or purchase options grant.
The compensation for 2023 is respectively described (i) in the 2022 and 2023 Compensation Policies and (ii) in Section 3.3.1.2.2.3 “Performance Shares” of this Universal Registration Document.
Introductory information: Plan delivered in 2023 / Plan for which the performance assessment took place in 2023 / Plan for which the performance conditions are set by reference to the 2023 fiscal year:
- ■plan no. 11 awarded in 2019 (assessment of the performance conditions at December 31, 2021): 5,365 shares were made available out of a maximum number of 60,651 after adjustment related to the capital increase of June 2022 and were delivered to the during the 2023 fiscal year;
- ■plan no. 12 awarded in 2020 (assessment of performance conditions at December 31, 2022):
- ■the internal condition, linked to the Group net income after tax (weighting of 60%) was achieved at 94.70%,
- ■the internal condition related to gender balance within the category of “managers and professionals” was achieved at 127.9% (weighting of 10%),
- ■the external condition linked to earnings per share (weighting of 30%) was not met.
- The total achievement is therefore at 69.6%.
- ■one-off ESPI plan:
- the Annual Relative Total Shareholder Return (TSR) condition, corresponding to half of the total allocation of the Chief Executive Officer, was not met for the second annual tranche.
Plan awarded in 2023:
- ■plan no. 15: the Board of Directors meeting held on July 26, 2023, on the basis of the authorization from the General Meeting of May 30, 2023 (22nd resolution), resolved to grant a maximum of 146,270 shares to Patrick Koller (Chief Executive Officer) subject to performance conditions (it being stipulated that, in the event of the achievement of the targets set, the number of shares to be delivered will be 112,520). These 146,270 shares correspond to 0.07% of the Company’s capital stock at December 31, 2023.
Other long-term benefits = not applicable
Other long-term benefits = not applicable
No other long-term benefits grant.
Compensation as Board member
Not applicable
Not applicable
No compensation awarded as Board member.
All benefits (including social protection)
€29,310 (of which €21,850 in accounting valuation)
€29,310 (of which €21,850 in accounting valuation)
The 2023 compensation is respectively described (i) in the 2022 and 2023 Compensation Policies and (ii) in Section 3.3.1.2.2.8 “Benefits in kind and social protection” of this Universal Registration Document.
Termination payment
Not applicable
No payments during the fiscal year
The 2023 compensation is respectively described (i) in the 2022 and 2023 Compensation Policies and (ii) in Section 3.3.1.2.2.5 “Termination payment” of this Universal Registration Document.
Patrick Koller benefits from a termination payment since July 25, 2016. This scheme, which was authorized for Patrick Koller, Chief Executive Officer, by the Board of Directors’ decision of July 25, 2016, under the conditions set forth under Article L. 225-42-1 of the French Commercial Code (now repealed and reproduced in Articles L. 22-10-4 and L. 22-10-8 of the French Commercial Code), was approved by the General Meeting of May 30, 2017 (fifth resolution). It was then adjusted by the Board of Directors on February 14, 2020, solely in order to align the calculation methods for the reference compensation with that of the non-compete clause, and approved in accordance with the law by the General Meeting of June 26, 2020, in the context of the 2020 vote on the compensation policy for the Chief Executive Officer (16th resolution). It has not been modified since that date.
Non-competition indemnity
Not applicable
No payments during the fiscal year
The 2023 compensation is respectively described (i) in the 2022 and 2023 Compensation Policies and (ii) in Section 3.3.1.2.2.6 “Non-competition indemnity” of this Universal Registration Document.
Patrick Koller (Chief Executive Officer) has been bound by a non-compete covenant since February 14, 2020, and benefits from a related indemnity since June 26, 2020. The decision was taken by the Board of Directors on February 14, 2020, and approved in accordance with the law by the General Meeting of June 26, 2020, as part of the 2020 vote on the Chief Executive Officer’s compensation policy (16th resolution). The terms of this commitment remained unchanged in 2022.
Supplementary defined contribution pension scheme (Article 83 of the French General Tax Code) and supplementary defined benefits pension scheme (Article 39 of the French General Tax Code)
Frozen supplementary pension schemes: Defined benefits pension scheme and specific pension scheme (Article 39 of the French General Tax Code)
Not applicable
No payments during the fiscal year
The 2023 compensation is respectively described (i) in the 2022 Compensation Policies described in the 2021 Universal Registration Document and (ii) in Section 3.3.1.2.2.4 “Pension schemes” of this Universal Registration Document.
- ■Defined-contribution pension scheme: the amount of the pension is €5,024.
- ■Frozen defined benefits pension scheme: in accordance with the provisions of the order of July 3, 2019, the potential rights acquired by Patrick Koller (Chief Executive officer) under the defined benefits pension scheme (Tranche C) which he had continued to benefit from after his appointment as Chief Executive Officer on July 1, 2016, were frozen (as a percentage) in the existing plan at December 31, 2019. The amount of the pension at December 31, 2023, was €24,266. The same applies to the additional defined benefits pension scheme (PAPP). The amount of the pension under this additional scheme was, at December 31, 2023, €169.007. These plans were authorized by a decision of the Board of Directors of July 25, 2016, and approved by the General Meeting of May 30, 2017 (5th resolution).
- Defined benefit plans of vesting rights: the Chief Executive Officer benefits from a defined-benefit pension plan (Tranche C2) and an additional defined-benefit pension plan (PAPP2). The vesting of rights under these two plans is subject to the achievement of performance conditions. The performance conditions related to the rate of achievement of the annual variable compensation for the C2 Tranche pension plan, the net debt to EBITDA ratio, the synergies related to the integration of HELLA, the reduction of CO2 emissions and the level of achievement of the individual annual variable compensation targets for the PAPP2 pension plan have been achieved. As a result, rights will vest for the fiscal year ended December 31, 2023. The amount of the pension under these schemes is therefore €111,155.
-
3.4.Summary of compliance with the recommendations of the AFEP-MEDEF Code
The AFEP-MEDEF Code requires detailed reporting on the application of its recommendations and explanations to be provided, if applicable, as to why a company may not have implemented some of them. As of the end of the 2023 fiscal year, FORVIA did not entirely comply with the recommendations contained in the AFEP-MEDEF Code on the following issues.
AFEP-MEDEF Code recommendations
Explanations – Practice followed by the Company
25.4 Conclusion of a non-competition agreement with an executive corporate officer
“The Board also provides that the payment of the non-competition indemnity is excluded when the executive exercises their retirement rights. In any event, no indemnity may be paid beyond the age of 65."
The Board of Directors, on the recommendation of the Compensation Committee, carried out an in-depth review of the structure and components of the Chief Executive Officer’s compensation in 2020 as part of the development of the compensation policy, and decided in particular to submit the Chief Executive Officer to a non-competition undertaking. This mechanism was approved, as part of the compensation policy for the Chief Executive Officer, by the General Meeting of June 26, 2020, under Resolution No. 16.
The non-competition undertaking, which lasts 12 months, will apply in the event of the resignation of the Chief Executive Officer. In consideration for this undertaking, the Chief Executive Officer may receive throughout the period of this undertaking, a monthly payment equal to half of the reference compensation (annual fixed and variable) paid with respect to the 12 months preceding the resignation.
The non-competition agreement does not expressly provide for a restriction on the payment of the indemnity when the person concerned claims his pension rights, as this principle is now provided for by law.
In addition, the non-competition agreement does not provide for an age limit for the payment of the non-competition indemnity. The Board of Directors considers that this recommendation of an age limit is not compatible with the objective of protecting the Group’s interests, as the implementation of a non-competition undertaking is intended to protect the Group’s governance on a permanent basis against a departure of its executive to a competitor. Compensation for such an undertaking is customary and eliminating it beyond the age of 65, when many former executive directors continue to work after that age, does not seem to be in line with the objective of protection sought.
The payment of this indemnity is not, however, automatic, as the Board of Directors reserves the right, in light of the circumstances that it will assess and on a discretionary basis, to apply or not apply the non-competition undertaking. If the Board of Directors waives the application of the non-competition undertaking, the non-competition indemnity will not be due to the Chief Executive Officer for the period waived by the Company.
-
3.5.Shareholding by corporate officers and transactions in the Company’s securities
3.5.1.Shares held by corporate officers
Pursuant to the Company's bylaws, each Board member must hold at least 20 shares throughout the term of office.
Furthermore, the internal rules of the Board of Directors provide that each Board member must hold 500 shares in the Company, including 20 shares provided for in the bylaws, during the entire term of their corporate office. However, Board members who do not receive compensation in respect of their directorship are only required to hold 20 shares provided for in the bylaws and, in accordance with the law, Board members representing employees are not required to hold a minimum number of shares.
The internal rules of the Board of Directors’ also state that the Chairman of the Board of Directors must hold shares corresponding to one year’s compensation (including the 500 shares held as a Board member) and must comply with this obligation within two years of being appointed as Chairman.
At December 31, 2023, the corporate officers held approximately 3.2% of the Company’s capital stock and 5.3% of the voting rights (including 3.1% of the capital stock and 5.1% of the voting rights held by Peugeot 1810).
Details of the number of shares held by each corporate officer are provided in the summary table in section 3.1.2.1. “General information on the composition of the Board of Directors” and in the biographies of the Board members in section 3.1.2.2. "Board members’ expertise, positions and corporate offices as of the date of this Universal Registration Document". It is apparent from this information that, as at December 31, 2023, the Board members comply with the holding obligations laid down in the bylaws and internal rules.
-
3.6.Declarations of the members of the Board of Directors and Executive Management
Within the framework of an active conflict of interests management policy and to collect the information required under Annex 1 item 12 of European Regulation No. 2019/980, each year the Company provides its Board members with a detailed questionnaire allowing them to obtain the information required and thus make the necessary declarations.
To the Company’s knowledge and on the date this Universal Registration Document was drawn up, there is no family relationship between FORVIA's corporate officers.
Moreover, to the Company’s knowledge and on the date this Universal Registration Document was drawn up, none of the members of the Board of Directors and Executive Management have, within the last five years:
- ■been found guilty of fraud;
- ■been incriminated by a statutory or regulatory authority (including designated professional bodies);
- ■been publicly sanctioned by a statutory or regulatory authority (including designated professional bodies);
- ■been banned by a tribunal from serving as a member of an administrative, management or supervisory body or from being involved in the management of an issuer;
- ■been involved in a bankruptcy, receivership, liquidation, or receivership of companies having served as a member of an administrative, management or supervisory body.
To the Company’s knowledge and on the date this Universal Registration Document was drawn up, no potential conflicts of interest have been identified between the duties of each of the members of the Board of Directors and the Executive Management with regard to the Company and their private interests and/or other duties. It is specified that one Board member, Peter Mertens, whose mandate expired at the end of the annual general meeting dated May 30, 2023, has a minority interest in a start-up in which the Group has made a very small investment (less than 0.03% of the Group’s sales of the period during which the investment was made (2019) and was appointed, in November 2019, as a Board member of this Company. It is noted that this investment was made prior to the effective appointment of Peter Mertens as a Board member of the Company, that the investment conditions are similar for all minority investors (including the Company), that the Company does not have voting rights on the Board of Directors of this start-up and that the decisions on this investment are not made at the level of the Board of Directors of the Company. In addition, if a conflict of interest were to arise, the provisions of the internal rules on this subject would apply (for details of these rules, see Section 3.1.3.1. “Organization of the Board of Directors”, paragraph “Board members’ obligations”).
As part of the HELLA acquisition, the Company made a commitment for representation of the HELLA family pool on the Company’s Board of Directors. This commitment continues as long as the HELLA Family Pool holds at least 5% of the Company’s capital stock.
In accordance with the Investment Agreement of August 14, 2021, as subsequently amended, the HELLA family pool has undertaken not to sell:
- ■for a period of 18 months from the date of completion of the acquisition, i.e., until July 31, 2023, their shares held in the Company;
- ■during a period of 12 months as from the expiry of the preceding period described above, i.e., until July 31, 2024, more than 5% of the Company’s capital stock (as outstanding on July 31, 2023).
These lock-up commitments are subject to the usual exceptions in this respect, formalized in a contract under German law entered into between Faurecia and the members of the HELLA family pool on January 27, 2022, entitled the “Blocking Agreement”. Moreover, the Company has been informed of the execution by the HELLA family pool of a shareholders’ agreement constituting a concert action vis-à-vis Faurecia. This shareholders’ agreement also provides for preemptive rights to the benefit of the other members of the HELLA family pool on shares held by a member excluded from the shareholders’ agreement.
Lastly, to the Company’s knowledge and as of the date of this Universal Registration Document, there are no other restrictions accepted by the members of the Board of Directors and Executive Management concerning the sale, within a certain time period, of the Company’s shares they hold, with the exception of (i) the provisions of the bylaws and the internal rules on shareholding (see section 3.5.2. “Transactions in the Company's securities by corporate officers” of this Universal Registration Document) and (ii) the holding obligation related to the allocation of performance shares to the Chief Executive Officer under the terms of which he must retain at least 30% of the shares effectively vested under each plan. This percentage threshold requirement ceases to apply when the Chief Executive Officer holds a number of shares corresponding to three years of base gross compensation, factoring in all the previously established plans, and becomes applicable again if the Chief Executive Officer no longer holds the number of target shares corresponding to this level of base gross compensation.
-
3.7.Authorizations relating to sureties, endorsements and guarantees
In accordance with the law and bylaws, the Board of Directors can, within the limit of a total amount which its fixes, authorize the Chief Executive Officer to issue sureties, endorsements and guarantees on behalf of the Company.
In its meeting held on July 26, 2023, the Board of Directors authorized the Chief Executive Officer to issue sureties, endorsements and guarantees within the limits of a global amount of €50 million, up to a limit of €10 million per transaction, for a one-year period. If the Group is required to provide advance payment guarantees or performance bonds for contracts with successive partial deliveries, the Chief Executive Officer is authorized to provide guarantees representing a maximum of €5 million per transaction. It is specified that sureties, endorsements and guarantees provided to tax and customs regimes may be given without any limit on the amount.
-
3.8.Agreements
3.8.1.Related-party agreements
The Statutory Auditors’ special report on related-party agreements is included in Section 3.8.4 of this Universal Registration Document. It mentions two related-party agreements, signed in 2022, still in force, one of which was renewed twice in 2023. As a reminder, no related-party agreement was entered into during previous fiscal years.
-
3.9.Other Information
The table summarizing the current delegations of authority granted by the General Meeting in the area of capital increases and showing the use made of these delegations during the period is presented in Chapter 5, Section 5.2.1 “Authorized capital stock” of this Universal Registration Document.
The specific conditions governing shareholders’ participation in the General Meeting or the provisions of the bylaws which outline these conditions are included in Chapter 6, Section 6.1 “Legal information”.
Lastly, factors likely to affect a public takeover bid or exchange are described in Chapter 6, Section 6.1 “Legal information”.
(1)This calculation takes into account the seniority of Peugeot 1810, represented by its permanent representative Robert Peugeot since May 31, 2021 (and not the seniority of Robert Peugeot on the Board of Directors in his function as a Board member of the Company from May 29, 2007, until May 31, 2021).(2)Temporary composition until the conclusion of the term of Odile Desforges at the 2024 AGM.(3)Taking into account acquisition or sale transactions impacting the Group perimeter (HELLA perimeter excluded) in France for the concerned years, it is noted that:
- were only taken into account in 2019 and 2020: companies FAI (634 employees), FIM (93 employees) and FISQ (117 employees), exiting the Group on Octobre 31, 2021 ;
- were only taken into account in 2021 and 2022 : the three French companies of SAS (SAS Automotive France, SAS Logistics France et Cockpit Automotive Systems Rennes) for 225 employees, as they were integrated in the Group in 2020 and were sold in 2023;
- were taken into account as of 2021 : Faurecia Clarion Electronics Europe (357 employees) inttegrated to the Group during 2018 and Clarion Europe (56 employees) integrated in 2019.(4)It should be noted that the value of the performance shares at grant is not necessarily representative of the value at delivery.(5)As the prior notice and the non-solicitation covenant do not give rise to specific compensation, they are not mentioned in this table. For information, these mechanisms have not been implemented in 2023.(6)Presence condition with the usual exceptions. -
4.Environmental
and social performance4.1.General information
4.1.1.General preparation basis
4.1.1.1.General basis for preparing the sustainable performance declaration
- ■the requirements of Order No. 2017-1180 of July 19, 2017 and Decree No. 2017-1265 of August 9, 2017 creating a Non-Financial Performance Declaration, described in more detail in Articles L. 225-102-1 and R. 225-105 et seq. of the French Commercial Code;
- ■the requirements of law No. 2017-399 of March 27, 2017 on the duty of care.
Non-financial information covers the same scope as that used for the financial statements, i.e. the entire scope of consolidation of the Group excluding equity-accounted companies (see Chapter 1).
FORVIA takes into account its upstream and downstream value chain on all environmental issues (see 4.2.), particularly on the climate (see 4.2.2). The Group includes the stakeholders of its value chain in the reporting: suppliers (see 4.3.2), affected communities (see 4.3.3), consumers and end-users (see 4.3.4). The methodology is detailed in Section 4.5.2.
At the date of publication of this report, Faurecia owns more than 80% of HELLA, and the two companies form the FORVIA group. The consolidation of FORVIA group data is underway for certain topics. To ensure a better understanding, it is important to note the following points:
- ■When the term "FORVIA SE" is used, it refers to the scope of the former Faurecia SE entity.
- ■When the term "FORVIA" is used, it refers to the combined scope of Faurecia SE and HELLA.
4.1.1.2.Disclosure of information relating to specific circumstances
This year, the structure of the chapter on environmental and social performance was reworked in order to anticipate the expectations of the Corporate Sustainability Reporting Directive (CSRD). This chapter is structured according to the architecture of the European Sustainability Reporting Standards (ESRS), in four main sections: general information (see 4.1), Environment (see 4.2), Social (see 4.3) and Governance (see 4.4). It already meets the requirements for some of the information that will need to be published in the 2024 fiscal year.
For FORVIA’s carbon footprint, the Group uses estimates for value chain data. Sources of uncertainty associated with greenhouse gas (GHG) emissions estimates, results and calculation methodology are published in Note 4.5.2. Specificities relating to the reporting scope and the methodologies for calculating GHG emissions, volatile organic compounds (VOCs), and environmental indicators are presented in the same methodological note.
The Group’s vigilance plan is presented in Section 4.3.2.4. and its response to the European Taxonomy in Chapter 4.2.2.
FORVIA ensures compliance with best environmental, social and societal practices and adheres to recognized international norms and standards. The Group also relies on recognized CSR partners and methodologies to monitor and support its supply chain, develop its climate strategy and protect biodiversity, as well as international reporting frameworks to ensure transparency.
FORVIA’s CSR strategy participates in the United Nations Sustainable Development Goals (SDG): adopted in 2015 by 193 countries at the United Nations, the 17 Sustainable Development Goals constitute an action plan for a fair transition towards sustainable development by 2030. FORVIA supports these goals and contributes to them through its CSR strategy.
-
4.2.Environment
4.2.1.Environmental policy and culture
4.2.1.1.Environmental impact of operations
From an environmental standpoint, the Group’s overall ambition is to become the most environmentally friendly automotive technology company, aiming for “zero waste”, “zero air, water and soil pollution” and a minimal impact on biodiversity. The Group’s environmental policy therefore focuses on respect for the environment and creating a positive impact on communities. In this context, in addition to ensuring compliance with regulatory requirements and its stakeholders’ demands, the Group aims to reduce the environmental impact of its operations by focusing on reducing its CO2 footprint and its impact on air, water and soil. The Group actively takes measures to protect the environment, prevent pollution, protect biodiversity, and fight against climate change with a commitment certified by SBTi (Science-Based Target initiative) net zero standard, to reduce its scopes 1 & 2 emissions by 80% by 2025, its scope 3 emissions by 45% by 2030 and its scopes 1, 2, and 3 emissions by 90% by 2045 (see Chapter 4.2.3):
- ■ensuring regulatory compliance and meeting the expectations of its stakeholders;
- ■preventing and reducing air, water and soil pollution, by limiting the use of chemical substances of concern throughout the supply chain in order to avoid any accidental discharges into water and soil;
- ■setting and deploying targets for reducing the waste produced and increasing the recycling rate;
- ■reducing its impact on water use, starting with actions in water-stressed areas;
- ■identifying biodiversity action plans for sites located near protected areas;
- ■training employees to develop a personal sense of environmental responsibility;
- ■implementing continuous improvement, in particular by deploying ISO 14001 certification procedures across all production plants, based on the requirements and audits of the FORVIA Excellence System.
The Business Groups implement this policy in their respective scope, and the whole is supervised by the 10 Green Fundamentals which cover all of the focuses above. The Group ensures that their roadmaps are aligned with the highest levels of requirements and targets thanks to audits of 10 Green Fundamentals and system audits.
The environmental policy applies to all of the Group’s Business Groups and regions. It is designed and updated taking into account the expectations expressed by the Group’s stakeholders (see 4.1.3.2. Stakeholders’ interests and points of views).
It is steered by the Group’s HSE+S (Hygiene, Security, Environment and Physical Safety) department. FORVIA SE’s Vice President HSE+S, who himself reports to the Executive Vice President in charge of operations, coordinates a network of HSE Directors in each Business Group and a network of HSE managers at the level of the operational divisions and plants.
The HSE organization of HELLA is also based on an HSE department and an HSE network, and will be gradually integrated with that of FORVIA SE.
4.2.1.2.Environmental impact of operations
In 2023, FORVIA strengthened its environmental prevention management approach at its plants. Until 2022, the Group required plants to deploy the 10 Green Attitudes. Based on a voluntary approach, these 10 attitudes covered the topics of soil and groundwater protection, reduction of energy consumption and CO2 emissions, prevention of air pollution and control of waste production. In 2023, the Group transformed these attitudes into 10 Green Fundamentals, the implementation of which is now mandatory for all sites and verified at least once a year. These Green Fundamentals are based on operational and organizational requirements. The approach, previously on a voluntary basis, therefore became mandatory in 2023 and applicable to all plants worldwide. In 2024, each plant will have to define the deployment plan for the 10 Green Fundamentals.
In addition, each Fundamental includes both general obligations for management, applicable to the entire plant, and specific and very concrete instructions that are communicated to all employees.
The 10 Green Fundamentals for FORVIA plants
PROTECTING THE CLIMATE
Management directives
- ■Ensure that a CO2 roadmap has been established along with an action plan
- ■Anticipate energy consumption when selecting new equipment
- ■Climate change adaptation plan
Instructions for employees
- ■I turn off my workstation, lights and computer during breaks
PROTECTING BIODIVERSITY
Management directives
- ■Identify areas of interest for biodiversity in the plant’s vicinity
- ■Act accordingly
- ■Do not use herbicides & pesticides
- ■Launch a communication campaign
Instructions for employees
- ■I practice the 5S’s(1) in outdoor areas, no plastic or cardboard should blow away, to prevent animals from ingesting it
- ■I only print if necessary
KEEPING THE LAND AND WATER CLEAN
Management directives
- ■Keep hazardous substances secure throughout the process (loading, storage, production, waste)
- ■List hazardous substances and reduce their use as much as possible
- ■Protect rainwater using appropriate means
Instructions for employees
- ■I ensure that the chemicals are stored over a collector
- ■I clean plastic granules after delivery (external areas)
COMPLYING WITH REGULATIONS
Management directives
- ■Comply with the operating permit
- ■Comply with local regulations
Instructions for employees
- ■I comply with my work instructions
PRESERVING WATER
Management directives
- ■Know the network, water withdrawals and identify water uses
- ■Reduce your water consumption with an appropriate action plan
Instructions for employees
- ■I do not leave water running
- ■I immediately report any leaks at my workstation or in the bathroom
MANAGING IMPACTS
Management directives
- ■Complete the assessment of the plant’s environmental impacts and identify the most significant ones (including management of chemicals and pollution, energy, waste, water, biodiversity, adaptation to climate change)
- ■Address all significant risks/adverse impacts through an action plan
Instructions for employees
- ■I know the impacts related to my workstation
REDUCING WASTE & IMPROVING RECYCLING
Management directives
- ■Identify the type and quantity of waste (waste analysis)
- ■Sort waste by type to increase its recycling rate
- ■Reduce scrapping and other types of waste
- ■Separate all types of waste
- ■Maintain dumpsters and waste areas in good condition
Instructions for employees
- ■I separate the different types of waste and I am able to help my new colleagues
- ■I do not waste food
MANAGING PERFORMANCE
Management directives
- ■Monitor performance with KPIs (e.g. electricity, gas, oil, water, waste, emissions, chemicals, etc.)
- ■Identify leaks (e.g. compressed air, oil, water) and take immediate action
- ■Define an action plan to achieve the targets
Instructions for employees
- ■I know the environmental indicators that we monitor at the level of the Autonomous Production Unit
PROTECTING THE AIR
Management directives
- ■Identify process emissions (solvent and VOC in the paint line, welding gases, etc.), as well as emissions from refrigerant gases, boiler combustion gases, etc.
- ■Reduce emissions with an appropriate action plan
Instructions for employees
- ■I close canister lids
- ■I immediately inform my supervisor in the event of a problem with a cooling unit, an extractor, etc.
TRAINING
Management directives
- ■Train employees according to their impact on environmental aspects
- ■Communicate/teach instructions at the workstation for the various positions
Instructions for employees
- ■I am trained in the environmental impacts and risks related to my workstation
- ( 1 )The 5S method: systematic approach that aims to create and maintain an organized, clean and efficient working space.
4.2.1.3.Environmental culture of the teams
The approach used by the Group to prioritize actions in the environmental field is called “I know, I care, I reduce”. For management as for all employees, this reflects the fact that it is necessary to start by understanding and measuring the environmental impact (network plan, critical facilities, consumption), taking care of it (maintenance, possible repairs) and then being able to support improvement plans on with solid foundations.
The awareness-raising approach, updated in 2023, takes the form of posters, theoretical and practical training courses at the plants and a self-assessment questionnaire. The latter makes it possible to measure the progress of the adoption of the 10 Green Fundamentals by the plants.
As part of its 10 Green Fundamentals, FORVIA supports its plants in their training on these 10 key topics, and makes its employees aware of the best practices to be systematically adopted. In 2023, the Group strengthened internal communications on environmental issues. For example, the first Environment Week was created, punctuated by events and communications, webinars and educational Articles on the impacts of waste, water and biodiversity.
FORVIA has also organized monthly highlights on environmental topics, since 2023. Green moments are an opportunity to share an environmental subject, policy or target, along with information on the subject and easy-to-implement best practices. The topics covered are varied: refrigerant gases, rainwater protection, waste management, etc. They are intended for all operators, at all sites, in plants and at research and development sites.
Lastly, FORVIA organizes a monthly best practices competition. All Group sites and entities share their best practices on a monthly basis, whether they apply or exceed FORVIA standards. In 2023, more than 300 best environmental practices were identified on the topics of water resource conservation, waste sorting and optimization, chemical management, climate change mitigation and the adaptation of the Group’s Business Groups to this change, the monitoring of regulatory compliance, training spaces dedicated to the environment and the prevention of emergency situations. These best practices are shared at a monthly meeting with all HSE managers of the Group and all sites.
Since February 2023, the Group has set up a monthly reporting tool to more accurately measure and monitor site water withdrawal and waste generation. This monitoring makes it possible to quickly detect abnormal variations and identify their causes. For example, a sudden increase in water withdrawal or waste generation may be due to a cleaning action, a leak, waste to be managed following a construction site or a one-off action, such as the disposal and recycling of obsolete packaging. Thanks to this tool, the Group can take corrective measures quickly and effectively, while promoting continuous improvement. Identifying exceptional or seasonal effects makes it possible to define a “baseline” with which each site can compare itself over the following period and measure its actual performance.
4.2.1.4.The FORVIA Excellence System: an operational management tool
All FORVIA plants are IATF 16949 certified for quality management. This standard defines the quality requirements of the automotive sector: continuous improvement, defect prevention, reduction of non-compliance and waste in the supply chain, etc.
The FORVIA group’s operations management system is based on a framework, called the FORVIA Excellence System (FES). In 2023, FORVIA adapted this system to enable its adoption by the HELLA sites. The new standard was renamed FES 4.0.
FES 4.0 capitalizes on more than 20 years of experience and its foundation, “People development & stable conditions”, consists in particular of workplace safety and environmental protection. It guarantees that the operational performance of production plants is at the highest level, regardless of their geographical position and local specificities. It is based on more than 60 fundamentals, each consisting of around ten criteria.
- ■the environmental policy of operations (see Section 4.2. Environment – Environmental impact of operations);
- ■workplace safety (see 4.3.1.4. Actions and assessment of their effectiveness – Workplace Health and Safety);
- ■product safety (see 4.3.4.4. Actions and assessment of their effectiveness – Product safety culture);
- ■optimizing energy consumption and reducing greenhouse gas emissions (see 4.2.3.3. Climate actions and resources: scopes 1 & 2).
FES 4.0 supports plants in the application of operational requirements, compliance with quality standards, regulatory compliance for the environment and safety, applied to the automotive industry. The application of the requirements expressed in FES 4.0 prepares for IATF 16949, ISO 14001, ISO 50001, ISO 45001 certifications.
The application of the FES fundamentals and criteria is subject to a self-assessment and Internal Audit program:
- ■the sites carry out a monthly self-assessment and an in-depth review every three months;
- ■the divisions conduct annual internal mock audits;
- ■lastly, the Group conducts annual Internal Audits on a representative sample of plants. In 2023, more than 150 plants were audited. In 2024, 158 sites will be audited.
The FES is enriched annually with best internal and external lean manufacturing practices (Lean Manufacturing). In 2023, the Group strengthened the environmental component on the energy efficiency, reduction of greenhouse gas emissions, reduction of waste generation at source and waste sorting criteria. The Group also strengthened the section on data digitization.
In addition, in order to accelerate the deployment and use of digital resources, the Group also expanded the scope of “traditional” standards by adding, for each fundamental, an additional section focused on the implementation of the digital tools related to the requirements of the management system.
The Group can now assess its plants and identify the best-performing plants and those in need of improvement, based on their impact on the environment and the climate. This progress, initiated on pilot sites in 2023, will be rolled out in 2024.
4.2.1.5.Employee training
All new employees arriving at a site attend an awareness-raising session on best environmental practices.
The Group has developed an online university offering numerous training courses. Environmental training is mainly carried out internally. These training courses, either regulatory or at the Group’s initiative, deal with environmental impact and risk management, waste classification and management, chemicals management, implementation of natural disaster emergency response plans, the environmental monitoring of subcontractors’ sites, energy consumption management and the reduction of greenhouse gas emissions. On this last point, the Group has initiated a process of deploying the Climate Fresk to its managers in the industrial operations area.
The training courses provided by external organizations mainly aims to develop internal expertise, such as mastering the ISO 14001 certification process.
4.2.1.6.ISO 14001
FORVIA is committed to ISO 14001 certification for all production plants with more than two years of activity. The percentage of sites with ISO 14001 certification (or with an action plan for ISO 14001 certification, with more than two years of activity) is tracked every six months by the Risk Committee.
NFPD
In 2023, 88% of FORVIA sites (including HELLA) were ISO 14001 certified (i.e. 168 out of the 190 production plants), and the Group also has six certified R&D sites.
Within the FORVIA SE Scope, 87% of production plants are certified, i.e. 138 sites. Within the HELLA scope, 100% of the production plants are certified.
The change between 2022 and 2023 is due to the fact that seven additional sites were certified in 2023 within the Faurecia scope, and by the exit from the reporting scope of the SAS business, which had a large majority of certified sites.
Number of ISO 14001 certified production plants or with ISO 14001 certification pending in 2023
4.2.1.7.LEED® or BREEAM® certification of all new buildings
To improve the energy efficiency of sites and, more generally, to reduce their environmental impact starting from the design phase, FORVIA ensures that all of its new buildings (new constructions) are Leadership in Energy and Environmental Design (LEED®) or BREEAM® certified. To obtain certification, new buildings must meet strict requirements in terms of site layout, efficient water management, energy use, the selection of materials, interior air quality and design factors.
To support the sites in these new certifications, the Group has set up a LEED® or BREEAM® certification procedure. In 2022, the Allenjoie site of the Clean Mobility Business Group obtained BREEAM Excellent certification. It is the first industrial building in France to obtain this certification and the second in Europe. In Germany, the Hanover site obtained Platinum Deutsche Gesellschaft für Nachhaltiges Bauen (DGNB) certification. In 2023, Fengcheng’s new electronics plant in China received LEED® Gold certification and the FAS site in Allenjoie obtained BREEAM Excellent certification.
-
4.3.Social
Employees, suppliers, customers, communities: people are at the heart of the Group’s mission. With a global presence, more than 125,000 employees for the FORVIA scope and nearly 86,000 for the FORVIA SE Scope, in 2023, the Group is convinced of the importance of promoting a culture of development, integrity and safety with its employees everywhere that the Group operates.
A member of the United Nations Global Compact since 2004, the Group is committed to respecting and promoting the international conventions of the International Labor Organization (ILO) on human rights, labor standards and the environment in its operational and commercial practices.
- ■recruiting the best talents, offering them attractive development prospects and promoting diversity within its teams while guaranteeing a safe working environment for all staff working on its sites, whether they are employees or people external to the Company (see 4.3.1);
- ■building a responsible supply chain through solid and lasting relationships with suppliers whose ethical and social values and environmental priorities are aligned with our own (see 4.3.2);
- ■supporting local communities by developing the solidarity commitment of its employees (see 4.3.3);
- ■developing products and services of irreproachable quality and safety and technologies for an ever safer and smarter driving environment (see 4.3.4).
In 2023, FORVIA SE and HELLA continued to align their human resources management systems with a common FORVIA approach, taking into account, among other things, the French anti-corruption law Sapin II.
Stakeholders’ interests and points of view
As an international company, FORVIA SE takes into account the impacts that the Group may have on all people involved in its value chain. To this end, the Group ensures that it interacts with the various stakeholders resulting from its activities, in particular with its employees, temporary workers, subcontractors, suppliers and local communities (see Chapter 4.1).
-
4.4.Governance
4.4.1.Business conduct
4.4.1.1.Governance
The role of the administrative, management and supervisory bodies
The Board of Directors oversees the corruption prevention and detection system. It is also responsible for monitoring the effectiveness of the internal control and risk management systems.
For several years, the Group has had a Governance, Nominations and Sustainability Committee, one of whose missions is to review the ethics and compliance policy with regard to best governance practices (see Chapter 3).
4.4.1.2.Management of impacts, risks and opportunities
Process for identifying impacts, risks and opportunities
In 2020, in the context of the Sapin II law in particular, the risk of corruption mapping was updated based on interviews and questionnaires sent to people exposed to the identified corruption risks. In 2021 and 2022, new compliance indicators (monitoring in particular of accounting data concerning donations, sponsorship, payment of commissions as well as cases reported in the Speak Up tool) were created and collected to update it. This mapping will be overhauled in 2024, notably to include the compliance indicators updated in 2023. These various figures made it possible to draw up remediation plans adapted to the level of residual risk.
The identification of these risks is integrated into FORVIA’s overall risk mapping process (see Chapter 2).
The Compliance department works closely with legal experts on antitrust issues and with the control functions, whether permanent or periodic, in order to ensure effective control of the risks identified.
Corporate culture and business conduct policies
With a global presence and more than 153,000 employees in 2023, FORVIA is convinced of the importance of promoting a culture of integrity, safety and vigilance wherever the Group operates.
A member of the United Nations Global Compact since 2004, FORVIA is committed to respecting and promoting the international conventions of the International Labor Organization (ILO) on human rights, labor standards and the environment in its business practices.
FORVIA SE’s Code of Ethics contains all of its rules and principles, which must be understood and respected in all countries, by all employees and partners, in each line of business.
- ■remaining vigilant and complying with the highest ethical standards: this is an essential part of the corporate culture, anchored in FORVIA SE’s convictions and values;
- ■guaranteeing a safe working environment for all staff working on its sites (see Section 4.3.1), whether they are employees or external parties;
- ■building a responsible supply chain (see Section 4.3.2) through solid and lasting relationships with suppliers whose ethical and social values and environmental priorities are aligned with our own;
- ■developing products and services of irreproachable quality and safety and technologies for an ever safer and smarter driving environment (see Section 4.3.4).
This year, FORVIA SE and HELLA continued to align their management systems with a common FORVIA approach, taking into account, among other things, the French anti-corruption regulation (Sapin II) and the guidelines of the French Anti-Corruption Agency.
Ethics and compliance culture
FORVIA SE’s ethics and compliance program helps to build a strong culture of integrity. It includes policies and procedures that are the subject of training and communication campaigns.
Code of Ethics
Created in 2005 and revised several times, FORVIA SE’s Code of Ethics (6) encompasses respect for human rights and fundamental labor rights, economic and social dialog, respect for the environment, ethics and rules of conduct – in particular those related to the prevention and detection of corruption.
It includes updates to FORVIA SE’s compliance systems and tools resulting from the requirements of the Sapin II law. The Code is intended to strengthen the Group’s ethical culture. The FORVIA SE Management Code and the other systems, such as the Anti-Corruption Code of Conduct and the Best Practices Guide in the fight against anti-competitive practices, translate many of the principles set out in the Code of Ethics into operational requirements (see also Chapter 2 of this document).
Whistle-blowing procedure
In accordance with the Sapin II law and the law on the duty of care (see Section 4.3.2.5), FORVIA SE has set up an alert system to manage allegations of violations of regulations and the Group’s internal rules. Thus, employees (including temporary employees, subcontractors, etc.), partners, suppliers, and civil society (NGOs), civil society organizations and local communities have access to the reporting system described in the Code of Ethics.
Internally, employees are invited to contact their line manager, the human resources manager or a compliance manager (including the Compliance Leaders identified within each division), orally or in writing.
The other method of reporting, accessible internally and externally to all stakeholders, is a dedicated whistle-blowing hotline – Speak Up, accessible via an internet link (http://faurecia.ethicspoint.com). Depending on the nature and importance of the events reported, additional investigations may be launched, an inquiry may be set up or an Internal Audit decided upon.
The identity of any person using the hotline, as well as all the details enabling them to be identified, are protected and kept confidential by the persons responsible for them within FORVIA SE. These people are specially trained to receive and investigate this type of alert. Alerts can be entered into the tool in the desired language by the whistle-blower. Upon receipt of this request, the investigation procedure is initiated in order to deal with it in accordance with the applicable internal and local rules. At the end of the investigation, corrective actions can be taken. The Compliance department (see Section 2) monitors the implementation of these actions and periodically reports on the trends identified.
This entire system is the subject of regular communications, notably in 2023 through a communication campaign at the time of the International Anti-Corruption Day, launched among all Group employees, in order to strengthen the culture of compliance. The Group has also communicated internally on the Group’s core values, one of which is RESPECT, which refers to compliance.
Management of supplier relations
To assess the level of satisfaction of the relationship between FORVIA SE and its suppliers, the Group conducts an annual satisfaction survey. The index is established on a scale of one to four and measures supplier satisfaction in five areas: strategy, innovation, operational excellence, business ethics and decarbonization.
The 2023 survey was conducted among more than 1,700 direct suppliers of the FORVIA group representing two-thirds of the Group’s direct industrial purchasing volume. The level of satisfaction reached a score of 2.99 on a scale of 1 to 4, up compared to 2022 (score of 2.97). More than two-thirds of suppliers have perceived an improvement in our relationships and a majority of them see the creation of the FORVIA group as an opportunity. The main areas of progress that emerge are better visibility on future projects and better consideration of supplier innovations.
Corruption prevention and detection
In order to maintain a strong compliance culture, the Compliance department has set up different training sessions accessible to all employees (including part-time employees, interns, consultants, etc.). These training courses are tailored to FORVIA SE’s risk profile with which local teams may be confronted.
Along with the Human Resources, Internal Audit and Control teams, the Compliance department ensures that all the identified people are effectively trained in the internal rules, in order to maintain a strong ethics and compliance culture in the Group.
- ■Over the last three years, a total of 47,600 employees (employees, consultants, interns, etc.) have taken Ethics (25,900) and Antitrust (21,600) training modules (MOOCs).
- ■By the end of 2023, 46,700 employees (employees, consultants, interns, etc.) had taken the Anti-corruption MOOC, including 97.7% of the target population.
- ■Refresher training sessions are regularly organized at the industrial sites and in the divisions, in particular on the risks of breaches of best practices in the fight against anti-competitive practices.
Employees also have access to practical guides on anti-competitive practices, reporting and managing conflicts of interest and the internal whistle-blowing procedure on allegations of non-compliance with the Code of Ethics. Significant communication efforts have ensured that these guides are widely distributed.
Prevention of tax evasion
In support of its overall business strategy and objectives, FORVIA SE’s tax policy complies with the Code of Ethics. It is entrusted to a global team of tax professionals and is based on a firm set of principles.
Regulatory compliance
FORVIA SE complies with the letter and spirit of applicable laws and regulations, and relies on the relevant international standards (for example, the OECD guidelines).
FORVIA SE ensures that tax filings and payments are made in accordance with all local regulations. The Group also maintains all tax records and performs tax reporting as required by any law in countries in which the Group operates.
Integrity and transparency
FORVIA SE is committed to showing integrity and total transparency and to establishing constructive relationships with the tax authorities. In the event of a legal interpretation that does not agree with the tax authorities, FORVIA SE is prepared to refer the matter to the competent court to defend the interpretation of the law made by the Group.
Absence of subterfuges on structures and transfers between companies
FORVIA SE manages tax affairs in a proactive manner and does not use contrived or abnormal tax structures that are intended for tax avoidance, have no commercial substance and do not meet the spirit of local or international law. FORVIA SE does not use secret jurisdictions or so-called “tax havens” for tax avoidance.
The aim is to pay an appropriate amount of tax according to where value is created within the normal course of industrial or commercial activity. Consequently, all transfers of goods and services between companies within the Group are conducted on an arm’s length basis. The pricing of such transactions between Group companies is based on fair market terms and reflects the commercial nature of the transactions.
Meeting stakeholder expectations
The assessment of taxes respects shareholder value and fully complies with all legal and regulatory obligations, in line with stakeholders’ expectations.
4.4.1.3.Metrics and targets
CASES OF CORRUPTION OR PAYMENT OF BRIBERY
In 2023, there were no convictions or fines against FORVIA SE with regard to the fight against corruption and acts of corruption.
Political influence and lobbying activities
In 2023, FORVIA adopted a policy on government relations and advocacy (7) which sets out its commitment to responsible lobbying and political commitment. This policy aims to ensure that FORVIA’s advocacy and government relations activities are conducted in an ethical, transparent and honest manner, and in compliance with applicable laws and regulations. This policy applies globally and for the entire Group.
FORVIA engages with governments and other public players to support the Company’s strategy, in particular with regard to:
- ■the strengthening of its industrial and technological centers, in order to guarantee its competitiveness and its ability to meet market needs;
- ■its commitment to sustainability and climate action, supported by its roadmap to achieve net zero emissions by 2045;
- ■the promotion of research and innovation, in order to guarantee its future development;
- ■the protection of fundamental human rights.
FORVIA’s lobbying strategy includes interaction with its stakeholders, including political decision-makers and other public authorities in the regions where FORVIA operates.
The Group takes into account the impact studies of draft regulations or legislation on a series of important issues for its activities, in particular:
FORVIA communicates its positions on policy, regulatory and legislative proposals to policy-makers directly or through its professional associations to answer their questions or propose adjustments to take into account the interests of all FORVIA’s stakeholders.
FORVIA maintains regular discussions with its professional associations: CLEPA in Brussels, PFA in France, VDA in Germany and MEMA in the USA.
FORVIA is committed to conducting its lobbying activities in an ethical and responsible manner. Its anti-corruption Code of Conduct requires risk-based due diligence for intermediaries who are considered to be at high risk of corruption. Depending on the information obtained, it may be decided not to enter into relations with these intermediaries, in particular lobbyists. Training on the Anti-Corruption Code of Conduct is mandatory for the entire Group. In accordance with its internal rules on the management of third parties in terms of compliance, the main internal stakeholders must share the relevant information in order to implement the required prior assessment.
Within the Board of Directors and the Executive Committee, the Executive Vice President in charge of Communications, Public Affairs and Sustainable Development is responsible for monitoring lobbying activities.
In order to ensure the dissemination of information on subjects that may be considered sensitive, the Group is registered in the European Union Transparency Register under the number 963186850826-94.
FORVIA does not fund political parties, does not make financial contributions to political campaigns and is not actively involved in political campaigns.
Payment practices
-
4.5.Appendices
4.5.1.Report by one of the independent third-party organization on the verification of the consolidated non-financial statement included on a voluntary basis in the Group management report
This is a free translation into English of the independent third-party organization’s report issued in French and is provided solely for the convenience of English-speaking readers. This report should be read in conjunction with, and construed in accordance with, French law and professional standards applicable in France.
In our capacity as independent third-party organization, member of Mazars Group and accredited by COFRAC Inspection under number 3-1895 (scope of accreditation available on www.cofrac.fr), we have performed work to provide a reasoned opinion that expresses a limited level of assurance on the historical information (observed and extrapolated, hereinafter respectively the "Information") of the consolidated extra-financial performance statement, prepared in accordance with the entity’s procedures (hereinafter the “Guidelines”) for the financial year ended December 31, 2023, presented in the management report of the group (hereinafter the “Statement”) , in application of the provisions of Article L. 310-1-1-1 of the Insurance Code which refers to Article L225-102-1 of the Commercial Code.
Conclusion
Based on the procedures we performed, as described in the "Nature and scope of our work” and the evidence we collected, nothing has come to our attention that causes us to believe that Statement is not presented in accordance with the applicable regulatory requirements and that the Information, taken as a whole, is not presented fairly in accordance with the Guidelines, in all material respects.
Preparation of the non-financial performance statement
The lack of a commonly used framework or established practice on which to base the assessment and evaluation of information allows for the use of alternative accepted methodologies that may affect comparability between entities and over time.
The Statement has been prepared in accordance with the entity’s procedures, the main elements of which are presented in the Statement and are available on request from the entity’s head office.
Restrictions due to the preparation of the Information
The Information may contain inherent uncertainty about the state of scientific or economic knowledge and the quality of external data used. Some of the Information is dependent on the methodological choices, assumptions and/or estimates made in preparing the information and presented in the Statement.
The entity’s responsibility
- ■selecting or setting appropriate criteria for the provision of the Information;
- ■preparing the Statement with reference to legal and regulatory requirements, including a presentation of the business model, a description of the principal non-financial risks, a presentation of the policies implemented considering those risks and the outcomes of said policies, including key performance indicators and also, the Information required by Article 8 of Regulation (EU) 2020/852 (EU Taxonomy);
- ■and implementing internal control procedures deemed necessary to preparation of information, free from material misstatement, whether due to fraud or error.
Responsibility of the Statutory Auditor
Based on our work, our responsibility is to provide a report expressing a limited assurance conclusion on:
- ■the compliance of the Statement with the requirements of article R. 225-105 of the French Commercial Code;
- ■the fairness of the Information provided in accordance with article R. 225 105 I, 3° and II of the French Commercial Code, i.e., the outcomes, including key performance indicators, and the measures implemented considering the principal risks (hereinafter the “Information”).
We have carried out work aimed at formulating a reasoned opinion expressing a conclusion of moderate assurance on the historical information, observed or extrapolated.
However, it is not our responsibility to comment on the entity’s compliance with other applicable legal and regulatory requirements, in particular the French duty of care law and anti-corruption and tax avoidance legislation nor on the compliance of products and services with the applicable regulations.
- ■the entity’s compliance with other applicable legal and regulatory requirements (in particular with regard to the Information required by Article 8 of Regulation (EU) 2020/852, the due diligence plan and the fight against corruption and tax evasion);
- ■the truthfulness of the Information provided for in Article 8 of Regulation (EU) 2020/852 (EU Taxonomy);
- ■the compliance of products and services with applicable regulations.
Regulatory provisions and applicable professional standards
The work described below was performed with reference to the provisions of articles A. 225-1 et seq. of the French Commercial Code, as well as with the professional guidance of the French Institute of Statutory Auditors (“CNCC”) applicable to such engagements and with ISAE 3000 (reviewed)(8).
Independence and quality control
Our independence is defined by the requirements of article L. 822-11-3 of the French Commercial Code and the French Code of Ethics (Code de déontologie) of our profession. In addition, we have implemented a system of quality control including documented policies and procedures regarding compliance with applicable legal and regulatory requirements, the ethical requirements and French professional.
Means and resources
Nature and scope of our work
We planned and performed our work considering the risks of significant misstatement of the Information.
We are convinced that the procedures we have carried out in the exercise of our professional judgment enable us to provide a limited assurance conclusion:
- ■we obtained an understanding of the consolidated entities’ activities and the description of the principal risks associated;
- ■we assessed the suitability of the criteria of the Guidelines with respect to their relevance, completeness, reliability, neutrality and understandability, with due consideration of industry best practices, where appropriate;
- ■we verified that the Statement includes each category of social and environmental information set out in article L. 225 102 1 III as well as information regarding compliance with human rights and anti-corruption and tax avoidance legislation;
- ■we verified that the Statement provides the Information required under article R. 225-105 II of the French Commercial Code, where relevant with respect to the principal risks, and includes, where applicable, an explanation for the absence of the Information required under article L. 225-102-1 III, paragraph 2 of the French Commercial Code;
- ■we verified that the Statement presents the business model and a description of principal risks associated with all the consolidated entities’ activities, including where relevant and proportionate, the risks associated with their business relationships, their products or services, as well as their policies, measures and the outcomes thereof, including key performance indicators associated to the principal risks;
- ■we referred to documentary sources and conducted interviews to:
- ■assess the process used to identify and confirm the principal risks as well as the consistency of the outcomes, including the key performance indicators used, with respect to the principal risks and the policies presented, and
- ■corroborate the qualitative information (measures and outcomes) that we considered to be the most important presented in Appendix 1. Concerning certain risks such as social dialogue, business ethics, sustainable supply chain, product quality and safety, climate transition, for the others risks, our work was carried out on the consolidating entity and on a selection of entities ;
- ■we verified that the Statement covers the scope of consolidation, i.e., all the consolidated entities in accordance with article L. 233-16 of the French Commercial Code within the limitations set out in the Statement;
- ■we obtained an understanding of internal control and risk management procedures the entity has put in place and assessed the data collection process to ensure the completeness and fairness of the Information;
- ■for the key performance indicators and other quantitative outcomes that we considered to be the most important presented in Appendix 1, we implemented:
- ■analytical procedures to verify the proper consolidation of the data collected and the consistency of any changes in those data,
- ■tests of details, using sampling techniques, in order to verify the proper application of the definitions and procedures and reconcile the data with the supporting documents. This work was carried out on a selection of contributing entities(9) and covers between 16% and 100% of the consolidated data relating to the key performance indicators and outcomes selected for these tests;
- ■we assessed the overall consistency of the Statement based on our knowledge of all the consolidated entities.
We are convinced that the work carried out, based on our professional judgement, is sufficient to provide a basis for our limited assurance conclusion; a higher level of assurance would have required us to carry out more extensive procedures.
Appendix 1: Information considered most important
Qualitative information (actions and results)
- ■Safety in the workplace
- ■Talents attraction and retention
- ■Social dialogue
- ■Employee commitments
- ■Business ethics
- ■Responsible supply chain
- ■Product quality and safety
- ■Environmental impact of sites and climate change
Quantitative indicators (including key performance indicators)
- ■Total number of employees recorded and split by contract
- ■FR0t (Accidents with lost time per millions of hours worked) by employees and temporary workers
- ■FR1t (Accidents without lost time per millions of hours worked) by employees and temporary workers
- ■Turnover rate of managers and professionals
- ■Employee Engagement Index
- ■Percentage of M&P having received training on the Code of Ethics
- ■Share of direct suppliers assessed for CSR performance
- ■Customer satisfaction index
- ■Part of ISO 14001-certified production plants
- ■Energy consumption (MWh)/€m of sales
- ■Tons of waste/€m of sales
- ■Tons of CO2 equivalent/€m of sales (scopes 1 and 2)
- ■Carbon footprint (scope 1, 2, 3)
-
5Capital stock and
shareholding structure5.1.Shareholding structure
5.1.1.Changes in capital stock
As of December 31, 2023, the Company’s capital stock amounted to €1,379,625,380, divided into 197,089,340 fully paid-up shares with a par value of €7 each, all in the same class.
The total number of double voting rights existing within the Company represents less than 7% of the total number of voting rights as of December 31, 2023.
The breakdown of FORVIA’s capital stock and voting rights as of December 31, 2023 and over the last three fiscal years is as follows:
Number
of shares% capital
stockTheoretical voting rights(4)
% theoretical voting rights
Exercisable voting rights(5)
% exercisable voting rights
Major shareholders(1)
HELLA Family Pool
17,959,574
9.11
17,959,574
8.51
17,959,574
8.51
Franklin Resources, Inc.(2)
15,859,175
8.05
15,859,175
7.51
15,859,175
7.51
Exor
9,948,904
5.05
9,948,904
4.71
9,948,904
4.71
PEUGEOT 1810
6,110,494
3.10
10,810,874
5.12
10,810,874
5.12
Bpifrance Participations
4,266,020
2.16
7,547,574
3.58
7,547,574
3.58
Dongfeng
3,880,379
1.97
6,865,288
3.27
6,865,288
3.25
Sub total
58,024,546
29.44
68,991,389
32.69
68,991,389
32.69
Company shareholding
Corporate officers(3)
173,494
0.09
297,761
0.14
297,761
0.14
Employee shareholding (including FCP Faur’ESO)(4)
3,578, 896
1.82
4,869,906
2.31
4,869,906
2.31
Treasury stock
5,091
0.00
5,091
0.00
0.00
0.00
o/w liquidity contract
-
-
-
-
-
-
Sub total
3,757,481
1.91
5,172,758
2.45
5,167,667
2.45
Floating shareholding
Other shareholders (registered and bearer)
135,307,313
68.65
136,902,872
64.86
136,902,872
64.86
Total
197,089,340
100.00
211,067,019
100.00
211,061,928
100.00
- ( 1 )The major shareholders mentioned are those (i) holding more than 5% of the capital stock or voting rights as of December 31 and/or (ii) resulting from the distribution of FORVIA shares held by Stellantis or from the HELLA acquisition.
- ( 2 )On the basis of the information given by Franklin Resources Inc. in its threshold crossing notification sent to the Company dated December 19, 2023. Franklin Resources Inc. declares acting on its own behalf and on behalf of its affiliated investment funds and client accounts under management(and in particular Templeton Global Advisors Limited. See Section 5.1.2.).
- ( 3 )Excluding PEUGEOT 1810, Board member, whose shareholding is indicated above. However, this figure includes the shares held personally by Robert Peugeot, who was an individual Board member until May 31, 2021 and then has been the permanent representative of PEUGEOT 1810 since that date. Taking into account the stake held by PEUGEOT 1810, the percentages of capital stock, theoretical voting rights and voting rights exercisable at the Annual General Meeting would be 3.19% and 5.26% respectively.
- ( 4 )Calculated in accordance with Article L. 225-102 of the French Commercial Code. This figure includes the shares held by Faur’ESO International Employees as part of the Stock Appreciation Rights (SAR) plan.
- ( 5 )Theoretical voting rights = total number of voting rights attached to the total number of shares, including shares deprived of voting rights (including treasury shares). It is reminded that, in accordance with applicable regulations on the crossing of thresholds, the thresholds related to voting rights are calculated on the basis of theoretical voting rights (and not on the basis of exercisable voting rights).
- ( 6 )Exercisable voting rights = number of voting rights attached to the shares with voting rights.
Situation at
December 31, 2023Situation at
December 31, 2022Situation at
December 31, 2021Number of shares
% capital stock
Theore-
tical
voting rights(7)% theore-
tical voting rights(8)% of voting rights exerc-
isable at GM(9)Number of shares
% capital stock
% theore-
tical
voting rightsNumber of shares
% capital stock
% theore-
tical
voting rightsMajor shareholders(1)
Stellantis(2)
-
-
-
-
-
-
-
-
1,166,434
0.85
0.83
HELLA Family Pool
17,959,574
9.11
17,959,574
8.51
8.51
18,162,790
8.95
8.93
-
-
-
Franklin Resources, Inc.(3)
15,859,175
8.05
15,859,175
7.51
7.51
Exor
9,948,904
5.05
9,948,904
4.74
4.74
9,948,904
5.05
4.98
7,653,004
5.54
5.47
PEUGEOT 1810(4)
6,110,494
3.10
10,810,874
5.12
5.12
6,110,494
3.10
3.31
4,700,380
3.41
3.36
Bpifrance Participations
4,266,020
2.16
7,547,574
3.58
3.58
4,266,020
2.16
2.13
3,281,554
2.38
2.35
Dongfeng
3,880,379
1.97
6,865,288
3.25
3.25
3,880,379
1.97
1.94
2,984,909
2.16
2.13
Sub total
58,024,546
29.44
68,991,389
32.69
32.69
42,368,587
21.23
21.29
19,786,281
14.33
14.14
Company shareholding
Corporate officers(5)
173,494
0.09
297,761
0.14
0.14
368,389
0.19
0.23
125,767
0.09
0.12
Employee shareholding (including FCP Faur’ESO)(6)
3,578,896
1.82
4,869,906
2.31
2.31
3,752,754
1.90
2.21
3,765,155
2.73
2.97
Treasury stock
5,091
0.00
5,091
0.00
0.00
147,093
0.07
0.07
84,171
0.06
0.06
o/w liquidity contract
-
-
-
-
-
70,000
0.04
0.04
-
-
-
Sub total
3,757,481
1.91
5,172,758
2.45
2.45
4,268,236
2.17
2.51
3,975,093
2.88
3.15
Floating shareholding
Other shareholders (registered and bearer)
135,307,313
68.65
136,902,872
64.86
64.86
150,452,517
76.60
76.20
114,274,427
82.79
82.70
Total
197,089,340
100
211,067,019
100
100
197,089,340
100
100
138,035,801
100
100
- ( 1 )The main shareholders mentioned are those (i) holding more than 5% of the capital stock or voting rights as of December 31, (ii) resulting from the distribution of FORVIA shares held by Stellantis completed on March 22, 2021 or (iii) resulting from the acquisition of the majority interest in HELLA.
- ( 2 )The interest in FORVIA was held by Peugeot S.A. (PSA) until the completion of the merger between FCA and PSA on January 16, 2021 to create Stellantis. As part of this merger, the interest in FORVIA was transferred to Stellantis. On March 8, 2021, the General Meeting of Stellantis approved the distribution of the interest in FORVIA to the shareholders of Stellantis, it being specified that upon completion of this distribution, on March 22, 2021, Stellantis retained approximately 0.85% of the capital stock in order to be able to meet the commitments made by PSA to General Motors, and taken over at the time of the merger, upon the purchase of Opel (delivery of FORVIA shares in the event of the exercise by General Motors of share subscription warrants issued by PSA). As of December 31, 2023, Stellantis no longer holds any FORVIA shares.
- ( 3 )On the basis of the information given by Franklin Resources Inc. in its threshold crossing notification sent to the Company dated December 19, 2023. Franklin Resources Inc. declares acting on its own behalf and on behalf of its affiliated investment funds and client accounts under management(and in particular Templeton Global Advisors Limited. See Section 5.1.2.).
- ( 4 )The stake of 510,000 shares was initially held by Peugeot Invest. It was contributed to PEUGEOT 1810 as part of the internal reclassification carried out by the Peugeot family prior to the merger with Stellantis.
- ( 5 )Excluding PEUGEOT 1810, Board member since May 31, 2021, whose shareholding is indicated above. However, this figure includes the shares held personally by Robert Peugeot, who was an individual Board member until May 31, 2021 and then has been the permanent representative of PEUGEOT 1810 since that date. Taking into account the stake held by PEUGEOT 1810, the percentages of capital, theoretical voting rights and voting rights exercisable at the Annual General Meeting would be 3.19% and 5.26% respectively.
- ( 6 )Calculated in accordance with Article L. 225-102 of the French Commercial Code. This figure includes the shares held by Faur’ESO International Employees as part of the Stock Appreciation Rights (SAR) plan.
- ( 7 )Theoretical voting rights = total number of voting rights attached to the total number of shares, including shares deprived of voting rights (including treasury shares). It is reminded that, in accordance with applicable regulations on the crossing of thresholds, the thresholds related to voting rights are calculated on the basis of theoretical voting rights (and not on the basis of exercisable voting rights).
- ( 8 )Exercisable voting rights = number of voting rights attached to the shares with voting rights.
- ( 9 )The difference between the percentage of capital held by the shareholder and the percentage of voting rights results from the holding by the shareholder of double voting rights.
-
5.2.Capital stock
5.2.1.Authorized capital stock
The table below summarizes the financial authorizations and delegations for capital increases and cancellations of shares granted by the General Meeting held on May 30, 2023, as well as the use made of them during the 2023 fiscal year and since the beginning of the 2024 fiscal year up to the date of this Universal Registration Document.
Type of authorization/delegation
Maximum amount/nominal value
Term
Utilization
Resolution no. 16
Delegation of authority to be granted to the Board of Directors to issue shares and/or securities giving access, immediately or in the future, to the share capital of the Company and/or of a Subsidiary, with preferential subscription rights (suspension during tender offer periods)
- ■Capital: 40% (assessed on the day of the General Meeting; total capital ceiling)
- ■Debt securities: €1 billion (total debt ceiling)
26 months
No
Resolution no. 17
Delegation of authority to be granted to the Board of Directors to issue shares and/or securities giving access, immediately or in the future, to the share capital of the Company and/or a Subsidiary, without preferential subscription rights through a public offering (excluding offers referred to in 1° of Article L. 411-2 of the French Monetary and Financial Code) and/or as compensation for securities as part of a public exchange offer (suspension during tender offer periods)
- ■Capital: 10% (ceiling shared with Resolutions 18 and 20; to be deducted from the total capital ceiling)
- ■Debt securities: €1 billion (deducted from the total debt ceiling)
26 months
No
Resolution no. 18
Delegation of authority to be granted to the Board of Directors to issue shares and/or securities giving access, immediately or in the future, to the share capital of the Company and/or a Subsidiary, without preferential subscription rights through an offer exclusively targeting a restricted circle of investors acting for their own account or qualified investors (suspension during tender offer periods)
- ■Capital: 10% (ceiling shared with Resolutions 17 and 20; to be deducted from the total capital ceiling)
- ■Debt securities: €1 billion (deducted from the total debt ceiling)
26 months
No
Resolution no. 19
Authorization to increase the amount of issues provided for in Resolutions no. 16, no. 17 and no. 18 (suspension during tender offer periods)
- ■Up to a limit of 15% of the initial issue and deducted from the maximum amounts authorized by the delegations under which the initial issue is made (Resolutions 16 to 18)
26 months
No
Resolution no. 20
Delegation to be granted to the Board of Directors to issue shares and/or securities giving access, immediately or in the future, to the share capital of the Company, without preferential subscription rights, in order to remunerate contributions in kind to the Company (suspension during tender offer periods)
- ■Capital: 10% (ceiling shared with Resolutions 17 and 18; to be deducted from the total capital ceiling)
- ■Debt securities: €1 billion (deducted from the total debt ceiling)
26 months
No
Resolution no. 21
Delegation of authority to be granted to the Board of Directors to increase the Company's share capital by incorporation of reserves, profits, premiums or other amounts whose capitalization would be allowed (suspension during a public tender offer period)
- ■Capital: €175 million (ceiling independent of other resolutions)
26 months
No
Resolution no. 22
Authorization to be granted to the Board of Directors to grant, for free, existing shares and/or shares to be issued to employees and/or certain corporate officers of the Company or of affiliated companies or economic interest groups, with waiver by the shareholders of their preferential subscription rights
- ■Number of shares: 3,000,000 (ceiling independent of other resolutions)
- ■Sub-ceiling for executive and non-executive corporate officers: 10% of the above-mentioned ceiling
26 months
Authorization used by the Board of Directors on July 26, 2023 in a maximum amount of 2,116,540 shares for the implementation of plan no. 15
Resolution no. 23
Delegation of authority to be granted to the Board of Directors for the purpose of increasing the share capital through the issue of shares and/or securities giving access to the share capital, with removal of preferential subscription rights for the benefit of members of a company or group savings plan
- ■Capital: 2% (assessed on the day of the General Meeting)
26 months
No
Resolution no. 24
Delegation of authority to be granted to the Board of Directors for the purpose of carrying out share capital increases, with removal of preferential subscription rights in favor of a category of beneficiaries
- ■Capital: 0.6% (assessed on the day of the General Meeting; to be deducted from the ceiling of Resolution 23 or any resolution that may replace it at a later date)
18 months
No
Resolution no. 25
Authorization to be granted to the Board of Directors for the purpose of reducing the capital stock by cancellation of shares
- ■10% of the shares comprising the Company’s capital stock per period of 24 months
26 months
No
-
5.3.Transactions carried out by the Company in its own shares
The General Meeting of May 30, 2023 authorized the implementation of a share buy-back program (Resolution 14) which replaced, from that date, the program authorized by Resolution 13 of the General Meeting of June 1, 2022.
Liquidity agreement
Description of the contract
Since April 27, 2009, FORVIA has been implementing a liquidity contract that complies with the AMAFI Charter.
The current liquidity contract was signed on November 18, 2019 between FORVIA and Rothschild Martin Maurel. This contract, which complies with the AMF decision no. 2021-01 of June 22, 2021 covering the implementation of liquidity contracts on equity securities in respect of accepted market practices, replaced the previous contract of November 20, 2015, as amended on May 24, 2018.
The liquidity contract was signed for 12 months, from November 18, 2019 and is thereafter renewable by tacit renewal for successive 12-month periods. The amount of €10,837,505.31 was recorded as credit in the liquidity account on November 15, 2019.
The liquidity contract covers Company shares, and the trading platform on which the transactions are carried out is the Euronext regulated market in Paris.
The contract stipulates that its execution shall be suspended under the conditions set out in Article 5 of the above-mentioned AMF decision, namely (i) while stabilization measures are being carried out under the meaning of (EU) Regulation no. 596/2014 of the European Parliament and Council of April 16, 2014 on market abuse, with the suspension of the liquidity contract taking place from the admission to trading of the securities concerned by the stabilization measures up to the publication of the information indicated in Article 6, Paragraph 3 of the Delegated (EU) Regulation no. 2016/1052 and (ii) during a public offering period or pre-offering period and until the offer is closed, when the issuer initiates the public offering or when the issuer’s securities are targeted by the offering.
The contract may also be suspended on the Company’s request for technical reasons, such as the counting of shares with voting rights before General Meetings or the counting of shares giving rights to dividends before the ex-dividend date and for a period that it shall specify.
The contract may be terminated at any time by the Company, without notice and with notice of one month for the investment services provider.
Implementation in 2023
In 2023, under the liquidity contract, cumulative purchases related to 3,996,678 shares, i.e. 2% of the capital stock, for a value of €79,215,537 and cumulative sales related to 4,066,678 shares for a value of €80,866,007. The capital gain generated in 2023 under the liquidity contract amounted to €1,650,469. Management fees for the liquidity contract came to €150,000 in 2023. Under this liquidity contract, as at December 31, 2023, the following assets were included in the liquidity account: 0 securities and €10,865,799 in cash.
-
5.4.Share price
FORVIA shares (ticker code FRVIA) are listed on compartment A of the regulated market of Euronext Paris. They are listed on the CAC Next 20 and CAC 40 SBT 1.5° indices of Euronext and the MSCI France index.
The share price at the 2023 closing date (Friday, December 29, 2023) was €20.42 compared to a closing price of €14.13 (Friday, December 30, 2022), i.e. a market capitalization of approximately €4.025 billion at the end of 2023 compared to approximately €2.785 billion at the end of 2022 (the number of shares being identical at the end of the two years, i.e. 197,089,340 shares).
This increase of 44.52% over the year 2023 partially corrects the sharp decline in 2022, which was mainly caused by the combination of the strong impact of the war in Ukraine on the financial markets and the global macroeconomic environment, particularly in terms of inflation, simultaneously with the finalization of the strategic acquisition of a majority interest in the equipment manufacturer HELLA, largely financed by debt.
Over the same period of 2023, the French CAC 40 and SBF 120 indices increased by 16.52% and 15.26% respectively.
While the global macroeconomic context remained tense in 2023, with inflation still high and interest rates raised several times, the FORVIA share rose more than the indices already mentioned and also peers such as Plastic Omnium and Valeo (down 11.63% and 16.68% respectively in 2023). Indeed, in 2023 the Group demonstrated its ability to finalize the refinancing of the HELLA acquisition and also, through the effective completion of a first asset disposal program for €1 billion, that its priority objective was to accelerate its deleveraging after the HELLA acquisition, thus alleviating investor risk aversion in an inflationary environment.
In October 2023, again with a view to accelerating the Group’s debt reduction, a second asset disposal program for €1 billion was announced during the publication of the Q3 sales.
The average price of FORVIA’s share over 2023 was €19.58. The price peaked at €25.40 on July 24, 2023, and hit its lowest closing price of the year, €14.40, on January 2, 2023.
The average number of monthly trades on Euronext was 22.335 million shares, representing €435.77 million.
5.4.1.Share price and trading volumes (source Euronext)
2023 share price and trading volume
Price (in €)
Trading volume
High
Average
Low
Close
Shares
Capital
(in € thousands)
January
18.84
17.50
14.40
18.14
29,374,411
509,866
February
21.30
19.44
17.84
20.71
24,597,144
482,977
March
23.56
20.35
17.42
19.95
41,298,581
834,243
April
22.10
19.77
17.63
18.75
23,350,611
461,613
May
21.42
19.31
16.92
19.33
22,559,201
435,694
June
23.15
21.64
19.35
21.57
19,687,847
426,613
July
25.40
23.21
21.03
22.82
18,261,333
425,275
August
23.06
20.50
18.99
19.64
14,801,157
304,847
September
20.96
19.67
18.46
19.61
15,801,932
310,650
October
20.08
16.89
14.99
15.84
21,621,722
365,134
November
18.20
17.00
15.56
18.04
18,909,706
322,176
December
21.63
19.78
17.55
20.42
17,759,354
350,171
2022 share price and trading volumes
Price (in €)
Trading volume
High
Average
Low
Close
Shares
Capital
(in € thousands)
January
45.16
42.51
38.14
38.63
11,995,795
507,156
February
43.75
39.56
32.85
34.05
17,236,742
670,861
March
34.19
25.01
21.86
23.65
37,819,015
954,356
April
24.82
22.41
19.71
21.07
29,170,079
649,961
May
26.40
22.23
18.60
25.82
37,718,205
865,663
June
23.95
21.09
18.14
18.92
37,397,666
803,585
July
19.51
17.09
15.39
17.55
32,008,274
547,418
August
18.32
16.22
13.69
14.39
28,279,405
454,354
September
15.36
13.64
10.75
11.23
40,727,033
545,829
October
15.16
12.90
10.73
15.12
39,919,449
508,362
November
17.90
15.70
13.36
15.76
32,939,260
511,858
December
16.20
14.25
13.26
14.13
23,412,900
333,941
-
5.5.Relations with the financial community
For many years, FORVIA’s management has made it a priority to establish a relationship of trust with financial market players by developing a constant dialog with its shareholders and lenders.
FORVIA therefore encourages constructive dialog, both on its financial results and on its strategy and latest news, through accurate, comprehensive, regular and transparent financial reporting, in accordance with current regulations and as close as possible to financial communication best practices.
HELLA, in which FORVIA acquired a majority interest finalized at the end of January 2022 and which has been consolidated in FORVIA’s financial statements since February 1, 2022, is listed on the Frankfurt Stock Exchange (ticker: HLE). HELLA manages its financial communications independently, while adhering to a financial communications calendar compatible with that of FORVIA for its consolidated financial statements. HELLA’s financial communications are available on the website www.hella.com, in German and English.
The FORVIA group provides investors with a large number of documents covering its business, strategy and all the financial information that it is required to disclose under stock market regulations. They include the Company’s registration documents and Universal Registration Documents, interim financial reports, documents distributed as regulated information, as well as the Company’s bylaws and the Board of Directors’ internal rules, and are available online www.faurencia.com or www.forvia.com, in French and English.
Financial information is regularly supplemented by the publication of press releases announcing important events relating to the Group’s operations and activities. All of these press releases are available in the “Newsroom” space on the website.
At the end of each quarter, the Group organizes a communication on its performance for the previous quarter or half year:
- ■in April and October of each year, the Group publishes changes to its quarterly sales by business and by region. In addition to a press release, a telephone meeting is also held for this communication, to which analysts and investors are invited;
- ■in February and July, the Group publishes all of its annual and half-yearly results. In addition to a press release, a meeting is then held (physical meeting or videoconference) to which analysts and investors are invited.
Throughout the year, FORVIA promotes meetings between its Executive Management and financial market players at conferences and meetings (financial roadshows) in France and worldwide, in the form of individual or group meetings.
Finally, the Group very regularly organizes investor days (“Capital Markets Days”) to present the medium-term strategic vision, with some of these days dedicated to specific topics.
- ■a toll-free number has been set up, which is available in France only (0805 651 206). This number allows individual shareholders to obtain information or answers to any questions they may have about the life of the Group, or about how to become a shareholder (all their requests can also be sent to the following address: actionnaires@faurecia.com);
- ■a digital “Letter to shareholders” is published periodically on the Group’s website;
- ■meetings with individual shareholders are organized in the various French regions.
In 2023, in addition to meetings to present annual and interim results and conference calls for Q1 and Q3 sales reporting, FORVIA carried out over 200 meetings with investors and financial analysts during financial roadshows, conferences, and individual appointments.
FORVIA also ensures a constant dialog with individual shareholders. In addition to the General Meeting, which is a privileged moment of exchange with its shareholders at the Group’s head office, FORVIA regularly meets with individual shareholders in the provinces. The Group traveled to Nantes in 2023 to present the Company and its prospects to an audience of individual investors.
On November 3, 2022, FORVIA held its first "Capital Markets Day" in Paris under its new scope Faurecia + HELLA, during which the Group presented “Power25”, its new medium-term plan (2025) aiming to generate profitable growth, strengthen cash generation and accelerate the Group’s debt reduction.
(1)No stock subscription options plans have been in force since April 16, 2017. Consequently, tables No. 8 of the AFEP-MEDEF Code and AMF recommendation No. 2021-02 (“History of allocations of stock options”) and No. 9 of the AMF recommendation No. 2021-02 (“Stock subscription or purchase options granted during the period to the top ten non-corporate officer employees and options exercised by them during the year”) are not applicable.(2)As of Plan No. 10, the plans provide for an adjustment in the event that it appears (i) that the Group's sales for the last fiscal year ended of the reference period (2022 for Plan No. 12 and 2023 for Plan No. 13) would be lower or higher (in value) than +/- 5% compared to the sales forecast for the fiscal year concerned in the strategic plan adopted by the Board of Directors and (ii) that this variation would be due to exogenous factors such as changes in vehicle production volumes at the global level or exchange rates. In such a case, the level of the Group net income (after tax) target to be achieved under the plan for the last period ended of the reference period would remain unchanged but the gap between the performance threshold and the maximum target would be doubled.(3)The value used to calculate the TSR is the average share price over the year (12 months) preceding the valuation.(4)The tables below present the current plans (or those expired) during the 2023 fiscal year. Plans No.1 to 10, which have expired, have not been included in this Universal Registration Document. For more information on these plans (including performance conditions, objectives set and achievement of these objectives), please refer to the 2018 Universal Registration Document, page 209, the 2019 Universal Registration Document, page 330, the 2020 Universal Registration Document, page 378, the Registration Document, page 398. For information however, please note that for Plans No. 1 to 10, subject to performance condition(s), the performance conditions (i) were met for six Plans (Plans No. 1, 5, 6, 7, 8 and 9), at the maximum rate for three of them (except for Plans No. 7 and 8), and (ii) were not met for four Plans (Planes No. 2, 3, 4 and 10) and therefore no shares were definitively vested for the beneficiaries of these four plans. -
6.2.Simplified organizational chart
The simplified organizational chart below shows the general legal organization of the Group as at December 31, 2023.
The full list of companies in the Group’s scope of consolidation as of December 31, 2023 is provided in Chapter 1 “Financial and accounting information”, Section 1.3.6 “List of consolidated companies as of December 31, 2023”.
Group simplified organizational chart as at December 31, 2023
-
6.3.Historical background
1891. The first automobiles, in the modern sense, are made, powered by gasoline engines. The first steel tubes follow, patented by Peugeot and manufactured primarily in Audincourt (Doubs, France).
1929. Bertrand Faure acquires the patent for the Epeda process. The patent allows the Company to perfect its seats for the automotive industry. After the Second World War, Bertrand Faure’s customers include Renault, Peugeot, Citroën, Talbot, Panhard-Levassor, Berliet and Simca.
1950. Bernard Deconinck, the son-in-law of Joseph Allibert who founded the Allibert company, invests in an injection molding machine from the United States to mold large plastic parts from a single clamping unit. He moves into the automotive industry.
1955. A Peugeot subsidiary starts manufacturing automotive equipment (seats, exhausts, steering columns) and expands internationally.
1972. François Sommer merges his automotive floor coverings company with Bernard Deconinck’s company, Allibert. They combine their know-how in textiles and plastics to found the Sommer Allibert group.
1982. Epeda Bertrand Faure is listed on the Paris stock exchange on May 4, 1982. The Group goes on to specialize in the automotive industry (interior design). It also experiences strong international growth.
1987. Cycles Peugeot merges with Aciers & Outillages Peugeot to form Ecia (Équipements et Composants pour l’Industrie Automobile), the PSA Peugeot Citroën group’s specialist automotive equipment subsidiary. Over the next ten years, Ecia undergoes intensive industrial and geographical development.
1990. Epeda Bertrand Faure is the European leader in automotive seating trades and components following the acquisition of the Rentrop Group in Germany. It opts to focus on its expertise as an automotive supplier.
1992. Ecia sells its cycle business, then its tool business the following year and makes significant acquisitions in European companies specializing in exhaust, with Tubauto and Eli Échappement in France, Leistritz Abgastechnik in Germany and Silenciadores PCG in Spain. Ecia then becomes the European leader in exhaust systems. At the same time, its Automotive Seating division joins forces with Spanish automotive supplier Irausa and create Ardasa. Its customers include Volkswagen, Renault, Daimler Chrysler, Opel, Honda and Mitsubishi.
1997. In December, Ecia makes a friendly takeover bid for Bertrand Faure, bringing its direct and indirect stake in the Group to 99%.
1998. While Bertrand Faure sells his luggage and aeronautics businesses, Ecia sells its motorcycle business to the PSA Peugeot Citroën group.
1999. Ecia and Bertrand Faure merge to form Faurecia on June 1. Bertrand Faure brings to Ecia a broader geographical and commercial presence, particularly in Germany, where the Company forges strong partnerships with automakers such as Volkswagen and BMW. The merged entity generates sales of more than €4 billion with a workforce of 32,000. By the end of 1999, the PSA Peugeot Citroën Group is its main shareholder with a stake of 52.6%. At the end of 1999, the Faurecia group develops its exhaust systems business in North America by acquiring the US company AP Automotive Systems.
2000-2001. Faurecia purchases Sommer Allibert. The PSA Peugeot Citroën Group finances the transaction, thus increasing its shareholding in Faurecia to 71.5%. Now fully established in Germany and Spain, the Group has significant market shares in Europe in the vehicle interior sector. It then achieves sales of €9.6 billion.
2002-2007. Faurecia strengthens its operations in Asia. In 2002, it creates a joint venture with GSK, a Taiwanese automotive supplier, to produce seats in Wuhan, China, and in 2003 it acquires the South Korean company Chang Heung Precision, which specializes in exhaust systems. In 2005, Faurecia increases its stake in Daeki, a company specializing in exhaust systems acquired in 2002, from 49% to 100%. It signs a joint-venture agreement with the South Korean company Kwang Jin Sang Gong, dedicated to the production of door modules for Hyundai Motors and Kia Motors.
In Europe, the Group signs an agreement with Siemens-VDO, which strengthens and expands their joint venture (a joint stock company): this company assembles cockpits for BMW, Daimler Chrysler, the Ford group, Renault-Nissan and the Volkswagen group.
2009. Faurecia acquires Emcon Technologies (formerly Arvin Industries), and becomes the world leader in exhaust systems. Faurecia boosts both (i) its position with German and American automakers (notably Ford), and (ii) its operations in South America, India and Thailand. Faurecia also ventures into the specialized commercial vehicles market (trucks and off-road). Following this all-equity acquisition, One Equity Partners (JP Morgan Chase & Co.’s private equity arm), holds a 17.3% stake in Faurecia and PSA Peugeot Citroën’s interest is reduced to 57.4%.
Faurecia buys out its joint-venture partner Tata to become the sole owner of Taco Faurecia Design Center. The company is renamed Faurecia Automotive Engineering India and becomes Faurecia’s development center in India.
2010. Faurecia becomes European leader in external automotive parts by acquiring Plastal’s German and Spanish businesses. It was able to expand internationally, setting up a joint venture in China with Huaxiang, supplier of exterior parts to FAW-Volkswagen.
A strategic alliance with the Geely and Limin groups marks a significant new development stage for Faurecia Interior Systems and Faurecia Automotive Exteriors in China.
In Europe, Faurecia Automotive Seating acquires the “seat comfort technology” business of Hoerbiger Automotive Komfortsysteme GmbH, while Faurecia Interior Systems acquires Angell-Demmel Europe GmbH, world leader in metal interior trim parts for the automotive sector.
2011. Faurecia boosts its business in China by (i) signing a new joint-venture agreement with Ningbo Huazhong Plastic Products Co., Ltd to manufacture external automotive parts and (ii) extending its cooperation agreement with Changchun Xuyang group signed in 2010 whereby Faurecia takes an 18.75% stake in the company. This allows the Group to expand the range of products and services it provides in the following strategic areas: complete seats, interior systems, acoustic modules and interior linings.
2012. Faurecia acquires the interior components plant belonging to Ford ACH located in Saline, Michigan (United States) and signs a joint venture agreement with Rush Group Ltd. This joint venture, Detroit Manufacturing Systems (DMS), supports activities such as the assembly and sequencing of interior parts in a new plant in Detroit.
2013. As part of its development in Asia, Faurecia Interior Systems signs a joint venture agreement with Thai supplier Summit Auto Seats to support Ford. Faurecia also signs a joint-venture agreement with Chang’an Automobile Group, one of China’s largest automakers.
Faurecia and Magneti Marelli sign a cooperation agreement for the design, development and manufacture of human-machine interface (HMI) products for vehicle interiors.
2014. Faurecia sets up a joint venture, Faurecia Howa Interiors, with Japanese automotive supplier Howa, for the Mexican production of interior systems for Renault-Nissan. The agreement signed opens up new commercial prospects for Faurecia: with Nissan in Mexico, Thailand, Spain, Brazil and in South Africa.
Faurecia sets up a joint venture, Automotive Performance Materials (APM), with Interval, a major French farming cooperative, to develop and produce bio-sourced raw materials in order to continue Faurecia’s drive to make vehicles lighter while protecting the environment.
2015. Faurecia continues to expand in China and signs a global partnership agreement with Dongfeng Hongtai (a majority-owned subsidiary of Dongfeng Motor Corporation, one of China’s largest automotive groups) covering all of the Faurecia group’s businesses. The first step of this partnership is the formation, in May 2015, of two joint ventures, one with a view to the development, manufacturing and delivery of automotive interior components (Dongfeng Faurecia Automotive Interior Co., Ltd) and the other with a view to the development, manufacture and delivery of automotive exterior components (Dongfeng Faurecia Automotive Exterior Co., Ltd).
Faurecia and Beijing WKW Automotive Parts Co. Ltd, one of the Chinese leading manufacturers of automotive interior and exterior trim parts, sign a joint-venture agreement. Together, the two partners aim to unlock synergies in the area of aluminum interior trim parts for light vehicles.
2016. Faurecia and the Italian company Tabu S.p.A., which is specialized in the production of flexible wood trims, sign a partnership agreement that results in the creation of the Ligneos S.r.l. joint venture. The two partners have developed a patented technology aimed at extending automotive wood trim applications to a wider range of surfaces.
In line with the agreement signed in December 2015, in July 2016, Faurecia sells its Automotive Exteriors bumpers and front-end modules business to Plastic Omnium (excluding the Faurecia Smart plant in Hambach and two joint ventures in Brazil and China).
Faurecia and German premium automaker Borgward sign a partnership agreement to create a joint venture (Borgward Faurecia Auto Systems Co., Ltd) in Tianjin, China, to jointly develop and produce complete automotive seats for the new Borgward vehicles.
2017. Faurecia expands its innovations ecosystem and forges technological and industrial partnerships with:
- ■Parrot Automotive, a leading provider of connectivity and infotainment solutions for the automotive industry. Faurecia gradually acquires shareholdings in the company, thereby enabling it to accelerate the development of electronic solutions for the connected car;
- ■ZF, for the development of advanced seat-integrated safety solutions for various cockpit applications;
- ■Mahle, to develop innovative technologies for thermal management of the passenger compartment.
Faurecia acquires a majority interest in Chinese company Jiangxi Coagent Electronics Co. Ltd, renamed Faurecia Coagent Electronics S&T Co. Ltd, which develops integrated and innovative in-car infotainment solutions.
- ■finalizing its 100% acquisition of Parrot Faurecia Automotive;
- ■creation of a new joint-venture with Liuzhou Wuling Automotive Industry Co., Ltd;
- ■investment in the French HumanFab center (laboratory specializing in cognitive sciences), the French start-up Enogia (energy efficiency) and American start-up Powersphyr (cockpit of the future);
- ■acquisition of 100% of the Swiss company Hug Engineering (purification of exhaust gases for very high-power engines).
2019. Faurecia consolidates its expansion in the field of new technologies with the acquisition of 100% of the Japanese company Clarion Ltd. and the creation of a fourth activity “Faurecia Clarion Electronics” dedicated to electronics and software within the cockpit. This new division completes Faurecia’s portfolio of “Faurecia Automotive Seating”, “Faurecia Interiors Solutions” and “Faurecia Clean Mobility”.
- ■acquires all of the Chinese company Faurecia Coagent Electronics S&T Co. (infotainment and interior electronic solutions);
- ■takes a majority interest in the Swedish company Creo Dynamics (innovative acoustic systems and active noise control solutions);
- ■invests in the Israeli company Guardknox (cyber defense for connected and autonomous vehicles);
- ■creates a 50/50 joint venture with the Portuguese company Aptoide (Android application store);
- ■enters into partnerships with Japan Display Inc. to improve the digital experience of users inside the cockpit.
Faurecia and Michelin create a joint venture around Symbio, which brings together all Michelin and Faurecia hydrogen fuel cell activities.
Faurecia creates a global center of expertise dedicated to the development of hydrogen storage systems at its R&D center in Bavans, France.
- ■with Continental, the remaining 50% of its joint-venture SAS, a major player in the assembly and logistics of complex modules for vehicle interiors;
- ■100% of IRYStec Inc., a Canadian start-up that developed the world’s first software platform using perception and physiology to optimize the display system within the cockpit, and consequently the user experience.
Faurecia has chosen Schneider Electric as a preferred partner for the implementation of its CO2 neutrality strategy for scopes 1 and 2 in 2025, the trajectories of which have been validated by the Science Based Targets initiative (SBTi) .
2021. As part of the merger between PSA and FCA, in March 2021 Stellantis distributed the shares it held in Faurecia up to 39.3% of its capital. Following this distribution, Faurecia’s free float increased significantly to represent approximately 95% of its share capital as of December 31, 2021. Faurecia also successfully completed a first employee shareholding plan for 2% of the capital stock, raising employee shareholding to more than 2.6% of the capital stock.
Faurecia announces a strategic and transformative acquisition with the takeover of the German equipment manufacturer HELLA, making it the seventh largest supplier in the world. HELLA brings to Faurecia recognized know-how in electronics (automated driving, cockpit, energy management, sensors and actuators, etc.), lighting (headlamps, tail lights, interior and exterior lighting) and after-sales solutions (spare parts and diagnostic accessories).
In 2021, Faurecia carried out the following transactions to support its strategy focused on the Cockpit of the Future and Sustainable Mobility:
- ■development of partnerships with Renault, SAIC and Air Liquide in the field of hydrogen;
- ■the acquisition of (i) a majority interest in CLD, one of the main Chinese manufacturers of hydrogen tanks, (ii) the intellectual property assets of uMist Ltd, a Swedish start-up specializing in biomimetic spraying technology, (iii) designLed, a Scottish company specializing in advanced backlighting technologies and (iv) a 50% stake in Beijing BAIC DAS Automotive System Co., main supplier of seats for BAIC Hyundai;
- ■the sale of the AST (Acoustics and Soft Trim) division.
Faurecia has also continued and accelerated its approach to carbon neutrality by setting up partnerships with Palantir Technologies Inc., Engie, Schneider Electric and KPMG.
2022. The major event of the year was the finalization of the acquisition of a majority interest in HELLA GmbH & Co. KGaA.
To seal the merger of Faurecia and HELLA, which together form the seventh-largest automotive supplier in the world, the two companies created the FORVIA brand. The new entity comprises six divisions: “Seating”, “Interiors”, “Clean Mobility”, “Electronics”, “Lighting” and “Lifecycle Solutions”. The Combined Group presented, at its Capital Market Day, its new medium-term strategic plan, Power25, aimed at generating profitable growth, strengthening cash generation and accelerating the Group’s debt reduction.
- ■a capital increase with preferential subscription rights in the amount of €705 million, including the issue premium, carried out in June 2022;
- ■the issue of senior bonds linked to sustainable development in the amount of €700 million.
As part of the FORVIA Group’s €1 billion asset disposal program to be completed by the end of 2023, HELLA sold its 33.33% stake in HBPO to its co-shareholder Plastic Omnium for €290 million.
The Group also continued and strengthened its sustainable development strategy, aiming to become CO2 neutral in industrial operations by 2025:
- ■two major electricity purchase contracts were signed, setting up an 85.8 MW Swedish Rodene wind project in Alingsas, in partnership with Octopus Energy Generation and Mirova Eurofideme 4, with the support of Schneider Electric, and a 15-year solar energy project was launched with ENGIE and EDP to equip more than 150 sites across 22 countries with solar panels;
- ■Faurecia also announced the creation of MATERI'ACT, a new entity focused on sustainable materials, with expected revenue of more than €2 billion in 2030 and a team of 400 people by the end of 2025.
In June, the Group had its roadmap for “net zero emissions” validated by the Science Based Target initiative (SBTi). Faurecia and HELLA will reach zero net emissions by 2045 (Scope 1, 2 and 3). Only 20 companies worldwide have had their net zero emission commitment approved to date.
The Group is accelerating and supporting its hydrogen strategy with the following development projects:
- ■Faurecia will equip the truck fleet supplied by MAN for the Bavarian region with complete hydrogen storage systems;
- ■Faurecia, Michelin and Symbio have been selected by the California Energy Commission for the development of a hydrogen truck through the “Symbio H2 Central Valley Express” project;
- ■Faurecia won a contract to supply high-capacity hydrogen storage systems to supply charging stations located in the "Zero Emission Valley (ZEV)", the first French project for sustainable hydrogen mobility for professional fleets;
- ■Faurecia signed a partnership with HYVIA (joint venture between the Renault group and Plug) to supply new generation hydrogen storage systems for the mass production of the Renault Master H2-TECH, manufactured in France;
- ■the hydrogen activities of Faurecia, as well as those of Symbio (50/50 joint venture with Michelin), have been selected as being of common European interest by the European Commission as part of the “IPCEI Hy2Use” project aimed at supporting research and innovation, the first industrial deployment and the construction of relevant infrastructure in the hydrogen value chain.
2023. Faurecia's General Meeting of May 30, 2023 changed Faurecia’s company name to FORVIA. This new name marks a new stage in the creation of the group combining Faurecia and HELLA and aims to strengthen the reputation and attractiveness of the FORVIA brand within its ecosystem.
In 2023, FORVIA completed the €1 billion asset disposal program announced and started in 2022 intended to accelerate the Group’s debt reduction following the acquisition of a majority interest in HELLA, completed in early February 2022. This program, completed in less than 15 months, includes:
- ■approximately 40% of transactions relating to non-consolidated joint ventures:
- ■sale by HELLA of its 33% interest in HBPO to its co-shareholder Plastic Omnium (completed in 2022),
- ■acquisition by Stellantis of an interest in Symbio, a company previously 50/50 owned with Michelin and now equally owned by the three companies (finalized in the third quarter of 2023);
- ■approximately 60% of transactions resulting from the sale of consolidated non-strategic assets to players in the automotive industry:
- ■sale of the Interiors business in India to TAFE (finalized in 2022),
- ■sale of the SAS Cockpit Modules division to the Motherson group (finalized in the third quarter of 2023),
- ■sale of the commercial vehicle exhaust business in Europe and North America to Cummins (completed in the fourth quarter of 2023).
Taking into account the successful execution of the first disposal program and the need to reduce the Group’s debt and financial costs in a context of persistently high interest rates, in October 2023, FORVIA announced the launch of a new €1 billion disposal program. The first step of this new program is the sale by HELLA of its 50% interest in BHTC, co-owned with MAHLE, for a value of €600 million (i.e. €300 million for each of the two shareholders), with the completion scheduled for the first half of 2024.
FORVIA steps up its decarbonization efforts by signing a ten-year supply contract with Renewable Power Capital. This agreement ensures nearly 70% of its European consumption through the purchase of renewable electricity from the Klevberget onshore wind farm in Sweden, thus contributing to its net zero target approved by SBTi.
The Group has also made further progress in its objective of reducing CO2 emissions in its supply chain (Scope 3):
- ■MATERI'ACT, an entity of the Interiors business, inaugurated its world-class R&D center in Villeurbanne (Auvergne-Rhône-Alpes region) to develop the materials of tomorrow with the objective of reducing their carbon footprint by 85% by 2030, with the development of plastics made from 70% recycled materials;
- ■the Group has started a partnership with the Nordic company SSAB to develop seats incorporating 90% decarbonized steel structures, with series integration planned for 2026.
- ■the Group has launched the mass production of Type IV hydrogen tanks from the Allenjoie plant (Bourgogne-Franche Comté region), aiming to produce 100,000 tanks per year, intended to supply the hydrogen distribution and storage market for the automotive industry in Europe. This plant obtained “BREAM Excellent” certification, a first in France symbolizing the reduction in energy consumption and serving as a model for the Group’s global production standards;
- ■in July, FORVIA and Michelin sold part of their interest in Symbio to Stellantis, helping to strengthen the resources and growth prospects of the hydrogen fuel cell specialist. In December, Symbio inaugurated SymphonHy, the largest fuel cell manufacturing plant in Europe, in Saint Fons (Auvergne-Rhône-Alpes region). This “BREAM Very Good” certified plant employs more than 450 engineers and plans to deploy an annual production capacity of 50,000 batteries by 2026;
- ■lastly, the Group won its two first Type IV hydrogen tank programs for medium-duty commercial vehicles in North America, confirming its status as an international player.
-
6.4.Additional information on audits of financial statements
Audit of financial statements
In accordance with French company law, FORVIA’s Statutory Auditors certify the parent company and Group financial statements and review the situation of its significant consolidated subsidiaries through members of their networks.
For the 2023 fiscal year, Ernst & Young Audit received €5.7 million for its audit assignments; while Mazars also received €8.1 million for its audit assignments.
The table showing the breakdown of fees that FORVIA and its fully consolidated subsidiaries recognized in their 2023 financial statements for work assigned to the Statutory Auditors appears in Chapter 1 “Financial and accounting information”, Note 34 in Section 1.3.5 “Notes to the consolidated financial statements”.
-
6.5.Declaration by the person responsible for the Universal Registration Document and the information officer
Person responsible for the Universal Registration Document
I hereby declare that the information contained in the Universal Registration Document is, to the best of my knowledge, in accordance with the facts and contains no omission likely to affect its import.
I further declare that, to the best of my knowledge, the financial statements have been prepared in accordance with the applicable accounting standards and give a true and fair view of the assets and liabilities, the financial position and the results of the Company and the consolidated companies making up the Group, and that the management report, for which the cross-reference table is shown on page 494, provides a true and fair picture of the changes in the business, the results and financial position of the Company and its consolidated companies, as well as a description of the main risks and uncertainties they face.
-
6.6.Cross-reference tables
Cross-reference table with Annexes 1 and 2 of Delegated Regulation (EU) no. 2019/980 of the European Commission of March 14, 2019
In order to make this Universal Registration Document easier to understand, the cross-reference table below makes it possible to identify the key items of information required by Annexes 1 and 2 of Delegated Regulation no. 2019/980 of March 14, 2019.
Information
Headings
Sections
1
PERSONS RESPONSIBLE, INFORMATION FROM
THIRD PARTIES, EXPERT REPORTS AND APPROVAL OF THE COMPETENT AUTHORITY
1.1
Persons responsible for the information
6.5
1.2
Statement by the persons responsible for the document
6.5
1.3
Expert statement
N/A
1.4
Other statements if information comes from third parties
N/A
1.5
Statement without the prior approval of the relevant authority
Preamble
2
STATUTORY AUDITORS
6.4
3
RISK FACTORS
2.1
4
INFORMATION ABOUT THE ISSUER
4.1
Legal and commercial name
6.1
4.2
Registration with the trade and companies register (RCS) and legal entity identifier (LEI)
6.1
4.3
Date of incorporation and term
6.1
4.4
Registered office – legal form – applicable legislation – website – other
6.1
5
BUSINESS OVERVIEW
5.1
Principal activities
Introductory chapter; 1.1.1; 1.5
5.1.2
New product and /or services
Introductory Chapter
5.2
Principal markets
Introductory chapter; 1.1
5.3
Important events
Introductory chapter; 1.1.; 1.5
5.4
Financial and non-financial strategy and objectives
Introductory chapter; 1.1.2; 1.1.3; 1.2; 1.6.3,
Note 2; 4.1.1 ; 4.1.35.5
Level of dependence
6.1; 2.1.1.3; 2.1.1.9
5.6
Competitive position
Introductory chapter
5.7
Investments
5.7.1
Material investments made
Introductory chapter; 1.1.6.2; 1.3.5, Notes 4, 11, 12A and 26.3; 1.5; 1.6.3, Note 17; 6.3
5.7.2
Ongoing material investments or firm commitments
1.1.6.2; 1.3.3; 1.3.5, Notes 4, 11 and 12A
5.7.3
Joint ventures and significant interests
1.1.1.2; 1.3.6; 1.5; 1.6.5; 6.2; 6.3
5.7.4
Environmental impact of the use of property, plant and equipment
4.2.5
6
ORGANIZATIONAL STRUCTURE
6.1
Brief description of the Group/Organizational chart
1.3.6; 1.6.5; 6.2
6.2
List of significant subsidiaries
1.3.6; 1.6.5
7
OPERATING AND FINANCIAL REVIEW
7.1
Financial position
Introductory chapter, Chapter 1
7.1.1
Presentation of the development and performance of the business
Introductory chapter; 1.1.3 to 1.1.5; 1.3.5, Note 4
7.1.2
Future changes and activities in research and development
1.1.1.2; 1.2; Introductory chapter; 1.3.5, Note 5.4
7.2
Net operating income
Introductory chapter; 1.1.4
7.2.1
Significant factors
1.1.1; 1.3.5, Note 2; 1.5
7.2.2
Significant changes in sales or net income
1.1.3; 1.1.5; 1.3.5, Note 2; 1.5
8
CAPITAL RESOURCES
8.1
Issuer’s capital
1.3.4; 1.3.5, Note 22; 1.6.3, Note 15
8.2
Cash flows
Introductory chapter (figures); 1.1.6.1; 1.3.3; 1.3.5, Note 21
8.3
Borrowing requirements and funding structure
1.1.6; 1.3.5, Note 26; 1.5 (Financial structure and net debt); 1.6.3, Note 17
8.4
Restriction on the use of capital
1.5; 1.3.5, Note 26; 1.6.3, Note 17
8.5
Anticipated sources of funds
1.1.1.2; 1.3.5, Note 26; 1.6.3, Note 17
9
REGULATORY ENVIRONMENT
9.1
Description of the regulatory environment and influencing exterior factors
2.1.1.2; 2.1.1.11; 2.1.3.1, 6.1
10
TREND INFORMATION
10.1
a) Main recent trends
Introductory chapter; 1.1.1.2; 1.2
b) Significant change in the Group’s financial performance since the closing or a negative statement
N/A
10.2
Factor likely to have a material effect on the outlook
Introductory chapter; 1.1.1.2; 1.2; 2.1
11
PROFIT FORECASTS OR ESTIMATES
1.2
12
ADMINISTRATIVE, MANAGEMENT AND
SUPERVISORY BODIES AND EXECUTIVE MANAGEMENT
12.1
Information on members of the Company’s administrative and management bodies
3.1.2.2
12.2
Conflicts of interest or negative statement
3.6
13
COMPENSATION AND BENEFITS
13.1
Compensation and benefits paid or granted
3.3
13.2
Provisions for pensions and other benefits
1.3.5, Note 25
14
WORKING METHODS OF ADMINISTRATIVE AND
MANAGEMENT BODIES
14.1
Terms of office
3.1.2.1; 3.1.2.2
14.2
Service contracts or appropriate statement
3.8.3
14.3
Committees
3.1.3.1; 3.1.4
14.4
Compliance with corporate governance rules
3.4
14.5
Potential material impacts on and future changes in corporate governance
3.1.2.5
15
EMPLOYEES
15.1
Breakdown of employees
Introductory chapter; 4.3 (introduction) ; 4.3.1
15.2
Equity investments and stock options
3.1.2.1; 3.1.2.2; 3.3.1.2.2.3; 3.3.1.2.3; 3.3.1.4.2; 4.3.1.4 ; 5.1.1; 5.2.4
15.3
Employee profit-sharing agreements
3.3.3; 4.3.1.4; 5.2.4
16
MAJOR SHAREHOLDERS
16.1
Breakdown of capital or appropriate statement
5.1
16.2
Different voting rights or appropriate statement
5.1; 6.1
16.3
Control of the issuer
5.1; 6.1
16.4
Shareholders’ agreement
6.1
17
RELATED-PARTY TRANSACTIONS
17.1
Details of transactions
1.3.5, Note 32; 3.8.1
18
FINANCIAL INFORMATION CONCERNING THE ISSUER'S ASSETS,
LIABILITIES, FINANCIAL POSITION AND RESULTS
18.1
Historical financial information
18.1.1
Audited historical financial information
1.3; 1.4; 1.6; 1.7; 6.1
18.1.2
Change of accounting reference date
N/A
18.1.3
Accounting standards
1.3.5, Note 1; 1.6.3, Note 1
18.1.4
Change of accounting framework
1.3.5, Note 1
18.1.5
Minimum content of audited financial information
1.3; 1.6; 6.1
18.1.6
Consolidated financial statements
1.3
18.1.7
Date of latest financial information
1.3; 1.6
18.2
Interim and other financial information
18.2.1
Quarterly or half-yearly financial information
N/A
18.3
Audit of historical annual financial information
18.3.1
Audit report
1.4; 1.7; 6.1
18.3.2
Other audited information
N/A
18.3.3
Unaudited financial information
N/A
18.4
Pro forma financial information
18.4.1
Significant change in gross values
N/A
18.5
Dividend policy
18.5.1
Description or negative statement
1.3.5, Note 35; 5.4.4; 6.1
18.5.2
Amount of dividend per share
1.3.5, Note 35; 5.4.3
18.6
Legal and arbitration proceedings
1.3.5, Note 24; 2.1.3.2
18.7
Significant change in the issuer’s financial position
1.1.1.2; 1.2; 1.3.5, Note 2; 1.6.3, Note 2
19
ADDITIONAL INFORMATION
19.1
Capital stock
19.1.1
Amount of capital issued
5.1.1
19.1.2
Shares not representing the capital
N/A
19.1.3
Treasury shares
5.1.1; 5.3
19.1.4
Securities
N/A
19.1.5
Vesting conditions and/or any obligations
N/A
19.1.6
Option or agreement
6.1
19.1.7
History of the capital stock
5.1.1; 5.2.3
19.2
Memorandum and bylaws
19.2.1
Registration and corporate purpose
6.1
19.2.2
Existing share categories
5.1.1
19.2.3
Provisions affecting a change in control
6.1
20
MAJOR CONTRACTS
20.1
Summary of each contract
6.1
21
DOCUMENTS AVAILABLE
21.1
Statement on documents available for consultation
6.1